

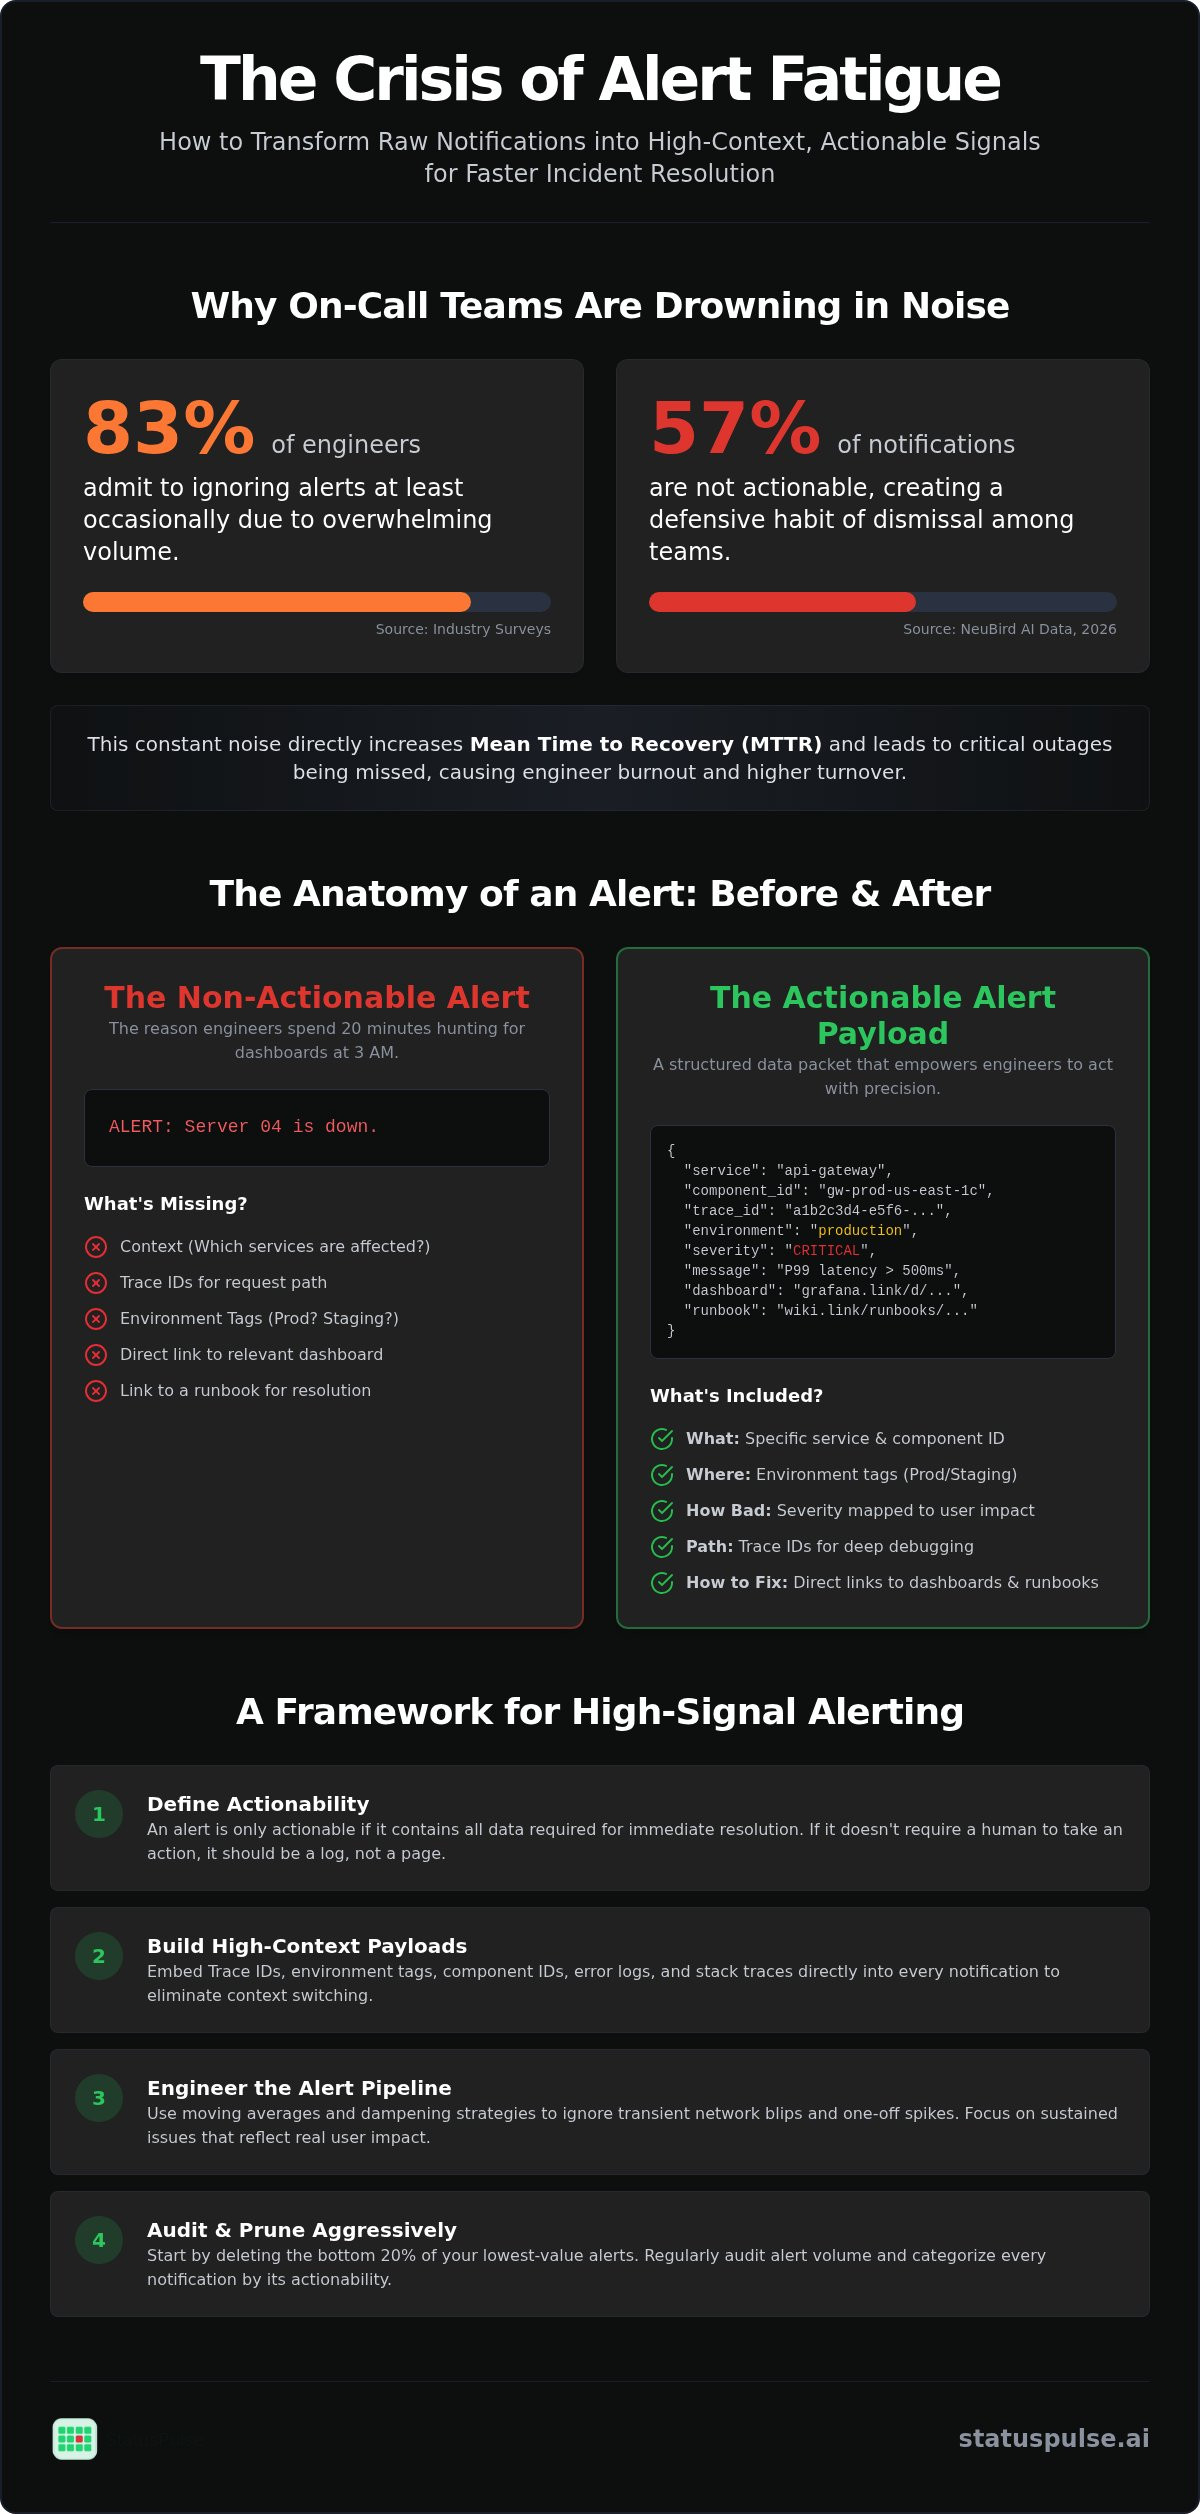
83% of on-call engineers admit to ignoring alerts at least occasionally. It's a rational response to overwhelming volume. When 57% of notifications aren't actionable, your team develops a defensive habit of dismissal. Streamlining incident communication is no longer just about morale; it's a requirement for preventing production outages caused by alert fatigue.
You've likely spent twenty minutes hunting for a dashboard at 3:00 AM because an SMS lacked basic context. We agree that the current industry standard of alerting on every minor threshold is broken. This guide shows you how to transform raw notifications into high-context, actionable signals that empower your team to act with precision.
You'll learn how to build alert payloads that help engineers resolve incidents faster and lower your MTTR. We will examine the technical trade-offs of threshold-based monitoring versus anomaly detection. We also provide a framework for predictable communication that keeps stakeholders informed without distracting the people actually fixing the problem.
Key Takeaways
- Define actionable alerting as a notification containing all data required for immediate resolution to reduce the cognitive load on your on-call team.
- Build high-context alert payloads using Trace IDs and environment tags to eliminate the 20-minute search for relevant dashboards.
- Improve your pipeline by streamlining incident communication through moving averages and dampening strategies that ignore transient network blips.
- Audit existing alert volume to categorize notifications by actionability and embed runbook URLs directly into payloads for guided resolution.
- Consolidate monitoring and status pages to reduce operational bloat while maintaining data sovereignty with a choice of EU or US hosting.
The Crisis of Alert Fatigue: Why Detection is Not Enough
Actionable alerting is a notification that contains every piece of data required for an immediate resolution. It isn't just a signal that something is broken; it is the first step in the fix. Most legacy monitoring setups focus on detection, but detection is only half the battle. If your team receives a notification but still has to spend 15 minutes finding the right dashboard, you haven't solved the problem. You've just moved it.
In 2026, the industry is seeing a massive shift. DevOps teams are moving away from simple Up/Down checks. These binary signals don't account for the complexity of modern distributed systems. Instead, engineers are adopting intent-based monitoring. This approach focuses on whether a service is actually performing its intended function for the user. Streamlining incident communication starts with this shift in mindset. You must distinguish between informational events and actionable incidents to reduce the cognitive load on your on-call rotation.
The Crisis of Alert Fatigue carries a heavy tax. When systems are noisy, critical outages get buried under a mountain of low-priority pings. This leads to missed SLAs and degraded system reliability. Organizations that fail to filter their signals often find that their most skilled engineers are the first to burn out.
The Anatomy of a Non-Actionable Alert
Imagine a Slack notification at 3 AM: "Server 04 is down." It provides no context, no impact data, and no link to a runbook. The engineer has to wake up, log in, and start a manual search through logs to identify which microservices are affected. Generic log-based notifications often fail in complex architectures because they don't include the Trace IDs or Environment tags needed to track a cascading failure. This lack of context is a primary driver of engineer frustration during the triage phase.
Quantifying the Impact of Noise on MTTR
There is a direct correlation between alert volume and incident duration. According to 2026 data from NeuBird AI, 57% of on-call teams report that less than 30% of their alerts are actionable. This noise creates a distraction factor that significantly inflates Mean Time to Recovery (MTTR). When an engineer is flooded with false positives, they start to second-guess every notification. This hesitation costs minutes during a critical outage.
The human cost is equally high. High-pressure SRE teams experience faster burnout and higher turnover when they can't trust their monitoring. Start streamlining incident communication by deleting the bottom 20% of your lowest-value alerts today. If an alert doesn't require a human to take an immediate action, it should be a log entry, not a page. Focus on quality over quantity to keep your team sharp and your systems stable.
The Technical Anatomy of an Actionable Alert Payload
An actionable alert isn't just a notification. It's a data packet. To be effective, every payload must answer three fundamental questions: What is broken? Where is it? How bad is it? Without these answers, the engineer is essentially blind during the first few minutes of a crisis. Streamlining incident communication requires moving beyond simple text strings to structured metadata that provides immediate clarity.
Required metadata includes:
- Component IDs for the specific service.
- Trace IDs for the request path.
- Environment tags to distinguish production from staging.
This setup prevents the "which server is it?" guessing game that wastes critical time. Dependency mapping is equally vital for reducing noise across the stack. If your primary database fails, you don't need 50 separate alerts from every microservice that depends on it. One alert identifying the root cause is far more valuable than a flood of downstream symptoms. A high-context alert is one requiring zero external searching for five minutes.
Contextual Metadata: Beyond the Message
Context is king. Don't just say a service is failing; show why. Include direct links to specific Grafana or Datadog dashboards within the notification. Even better, pass through the last five lines of error logs or a stack trace in the notification payload itself. This allows for instant triage without context switching. For endpoint-specific failures, linking to API Monitoring data helps pinpoint exactly which contract is broken. This level of detail stops the "it works on my machine" debate before it starts.
Mapping Severity to Business Impact
Severity should reflect the user experience, not just hardware metrics. High CPU usage is often just a warning, but a failed checkout process is a P1. Reserving P1 status for revenue-impacting events is a proven way to reduce Alert Fatigue across the team. Use SLIs (Service Level Indicators) and SLOs (Service Level Objectives) to trigger alerts instead of arbitrary, static thresholds. If your error budget is healthy, a minor transient spike shouldn't wake anyone up. There is a clear trade-off: high-precision alerts take longer to configure initially. However, they save dozens of on-call hours by eliminating false positives.
Building these payloads is the technical foundation for streamlining incident communication. If you are tired of noisy, context-free notifications, you can start building better signals with StatusPulse's monitoring tools.
Engineering the Alert Pipeline for Precision
Precision in your alerting pipeline is the difference between a high-performing SRE team and one drowning in technical debt. Static thresholds are easy to set but often fail in dynamic environments. Moving averages provide a more stable signal by smoothing out micro-bursts that don't actually impact user experience. Streamlining incident communication requires these refined triggers to ensure every notification represents a genuine deviation from the norm.
Dampening is another essential layer. You shouldn't wake an engineer for a two-second network blip or a transient 503 error that self-heals on retry. Implementing a "for" duration in your monitoring configuration ensures that an alert only fires if the failure persists. This filtering is a core recommendation for streamlining incident communication, as it protects the team's attention for high-impact events.
Data sovereignty is often overlooked in alerting pipelines. If you are operating in Europe, your incident data must respect GDPR compliance. This includes ensuring that PII isn't leaked into alert payloads or status updates. Tools like StatusPulse allow you to choose between EU or US hosting to maintain strict data residency standards.
Thresholds vs. Anomaly Detection
Static thresholds still have a place. For example, a 90% disk space alert is far more reliable than an AI model trying to predict storage growth. However, for traffic-dependent metrics, anomaly detection is superior. It identifies "flapping" services that trigger repetitive, useless notifications during maintenance windows. A simple logic check in your Prometheus-style config can prevent these noise cycles:
alert: HighErrorRate

expr: job:request_errors:rate5m > 0.05

for: 10m

labels:

  severity: page
Synthetic API Checks for Faster Detection
Synthetic probes provide a cleaner signal than application logs because they test the system from the outside in. While logs are useful for debugging, they are often too noisy for initial alerting. Probing from multiple global regions is non-negotiable for 2026 SaaS companies. A regional outage in AWS us-east-1 might not be visible from a single monitoring node in Europe. Implementing Website Availability Monitoring across diverse geographic points ensures you catch localized failures before they escalate into global incidents.
Implementation: From Pager Blare to Guided Resolution
Moving from a noisy alerting system to a high-precision pipeline requires a structured implementation plan. Start by auditing your existing alert volume from the last 30 days. Categorize every notification into two buckets: Action Taken or Ignored. If an alert is consistently ignored, it's noise and should be removed or downgraded to a log entry. This is the first practical step toward streamlining incident communication and restoring team trust in the monitoring stack.
Once you have a clean set of signals, you must automate the escalation path. Manual handoffs during a shift change are a primary cause of extended outages. Your system should utilize logic that respects time zones and Follow-the-Sun models, ensuring the alert reaches an engineer who is actually awake. Finally, use AI to bridge the gap between technical logs and human-readable updates. This ensures that while engineers fix the root cause, stakeholders receive accurate summaries without constant manual pings.
Linking Runbooks to Alerts
A notification without a response guide is just a stressor. Every actionable alert payload should include a direct link to a Minimal Viable Runbook (MVR). An MVR doesn't need to be an exhaustive manual. It only needs the first three steps: how to verify the impact, which log group to check, and the rollback command. For junior on-call engineers, read-only runbooks provide a safe environment to diagnose issues during high-stress incidents without the risk of accidental write actions. Streamlining incident communication becomes much easier when the "how-to" is delivered alongside the "what's wrong." You can see this in practice with StatusPulse's incident management tools, which allow you to embed response guides directly into the notification flow.
Automating the First Look with AI
AI excels at parsing complex JSON logs into a three-sentence summary for Slack or Microsoft Teams. Providing this summary in the initial notification significantly reduces the Time to Acknowledge (TTA). Instead of an engineer spending five minutes grokking a stack trace, they get an immediate overview of the failure. However, technical honesty is required here. AI summaries can occasionally hallucinate or miss subtle nuances in the data. Never rely on the summary alone. Your alerting pipeline must always include a link to the raw log source for final human verification. This balanced approach uses AI as an assistant rather than a replacement for engineering judgment.
Scaling Reliability with StatusPulse
StatusPulse provides a technical foundation for teams that value precision over corporate bloat. By combining uptime monitoring with native status pages, the platform eliminates the need to stitch together disparate tools. This unified approach is the most effective way of streamlining incident communication for modern engineering teams. It ensures that the data driving your internal alerts is the same data informing your customers.
The AI Incident Management feature serves a specific, practical role: drafting status updates based on real-time monitoring data. It acts as a specialized assistant. It proposes clear language for public updates while the engineer remains focused on remediation. This reduces the manual overhead of keeping stakeholders informed during high-stress outages, preventing the "communication lag" that often follows a technical fix.
Unified Monitoring and Incident Communication
Most monitoring setups stop at the pager. StatusPulse bridges the gap between the on-call engineer and the end user. When a monitoring alert triggers, the system can automate the creation of a status page incident. This immediate transparency provides users with the information they need before they have a chance to open a support ticket. You don't need a separate person manually updating a page while the system is down.
By providing a single source of truth, you reduce the cognitive load on your support team. They no longer need to hunt for status updates in private Slack channels. The information is already public and verified. It turns a technical failure into a managed, professional communication event that preserves user trust even during downtime. This level of transparency is essential for maintaining long-term customer relationships.
A Principled Approach to Pricing and Privacy
We believe flat pricing is more ethical for growing startups than complex per-user or per-subscriber models. Many established players in the incident management space charge more as your customer base grows. This effectively penalizes your success. StatusPulse offers transparent costs without per-subscriber fees, allowing you to scale your communication without financial surprises or unpredictable monthly bills.
Data sovereignty is a core virtue, not a marketing afterthought. You can choose between EU and US hosting to meet your specific regional regulatory requirements. This localized approach ensures that your incident data stays within the jurisdiction you require for GDPR compliance or internal policy. If you're ready to move away from corporate-bloated incumbents and adopt a more focused toolset, you can start streamlining incident communication with StatusPulse today.
Building Resilient On-Call Cultures
Effective alerting is about more than just a loud pager. It requires a shift toward high-context payloads that give engineers the data they need before they even log in. By refining your thresholds and auditing your noise, you protect your team's most valuable asset: their attention. Streamlining incident communication isn't a one-time configuration; it is a commitment to reducing cognitive load during every outage.
High-precision triggers and direct links to runbooks ensure that response times stay low while morale remains high. StatusPulse helps you achieve this with a unified platform for monitoring and communication. We offer flat, transparent pricing and a choice between EU or US data hosting for true sovereignty. You can also leverage AI to draft incident updates, keeping your stakeholders informed without distracting your engineers from the fix.
Build a more reliable on-call rotation with StatusPulse. Start treating your alerts as data packets rather than just noise. Your team and your users will thank you for the clarity.
Frequently Asked Questions
What makes an alert actionable versus just a notification?
An actionable alert contains the specific context required for immediate resolution. It must answer what is broken, where the failure is located, and the severity of the user impact. Unlike a simple notification, an actionable alert includes Trace IDs, environment tags, and links to relevant dashboards. This approach is the first step in streamlining incident communication by ensuring engineers don't waste time searching for basic data.
How can I reduce alert fatigue without missing critical system failures?
You can reduce fatigue by moving from static thresholds to moving averages and anomaly detection. Implement dampening to ignore transient network blips that resolve themselves within seconds. Focus your paging on user-facing Service Level Objectives rather than internal hardware metrics like high CPU usage. If an event doesn't require a human to take an immediate action, it should be recorded as a log entry rather than triggering a page.
Should I link runbooks directly to my on-call alerts?
Linking runbooks directly to alerts is a best practice for high-performing SRE teams. Every actionable alert payload should include a direct URL to a Minimal Viable Runbook. This reduces the cognitive load during high-stress incidents, especially for junior engineers. Even a simple guide that lists the first three diagnostic steps can significantly lower your Mean Time to Recovery by eliminating guesswork and manual searching during an outage.
What is the difference between EU and US hosting for monitoring data?
The difference lies in data sovereignty and regulatory compliance. EU-based hosting ensures that your monitoring data and incident logs remain within European jurisdiction, which is often a requirement for strict GDPR compliance. US hosting is a standard choice for teams focused on North American markets. StatusPulse provides both options to ensure you can meet your regional residency requirements without compromising on performance or reliability for your global users.
How does AI incident management help on-call teams resolve issues?
AI incident management acts as a technical assistant that parses complex JSON logs into concise summaries. It helps in streamlining incident communication by drafting public status updates based on real-time monitoring data. This automation allows your on-call engineers to stay focused on remediation while ensuring that stakeholders and customers receive accurate, human-readable impact reports without manual intervention or constant pings from the technical team.
Why is flat pricing better for incident communication tools?
Flat pricing is a more ethical and predictable model for growing startups. Many industry incumbents use per-user or per-subscriber models that cause your costs to scale unpredictably as your team or customer base grows. A flat, transparent price ensures that you can scale your incident communication and monitoring without facing financial surprises. It treats monitoring as a utility rather than a luxury reserved for large enterprises with massive budgets.
Can I automate my public status page updates from my monitoring alerts?
You can automate these updates to ensure total transparency with your users. StatusPulse bridges the gap between the internal pager and the public status page. When an uptime or API monitor detects a failure, it can automatically trigger a new incident on your status page. This immediate communication informs your customers before they have time to open support tickets, preserving trust while your team works on the fix.


