

What if your monitoring stack is actually the biggest threat to your team's productivity? Most SREs and developers accept alert fatigue as an unavoidable tax on their sanity. You've likely woken up at 3:00 AM for a critical outage, only to find a transient network blip that resolved itself before you even opened your laptop. It's a cycle that erodes trust. When your status page starts "flapping" during a non-event, your credibility with stakeholders takes a hit.
We agree that a pager should only go off when there's a real fire. This guide details exactly how to reduce uptime monitoring false positives by moving beyond single-node myopia toward multi-regional verification. You'll learn the specific configuration strategies and architectural shifts required to eliminate noise and restore integrity to your monitoring stack. We'll explore how adjusting retry logic, fine-tuning timeout thresholds, and leveraging AI-driven incident drafting can transform your on-call rotation. The goal is a reliable, quiet operation that reflects reality whether your data sits in the EU or the US.
Key Takeaways
- Single-node monitoring is inherently unreliable because localized ISP routing issues often mimic service outages. High-fidelity monitoring requires data from multiple geographic points.
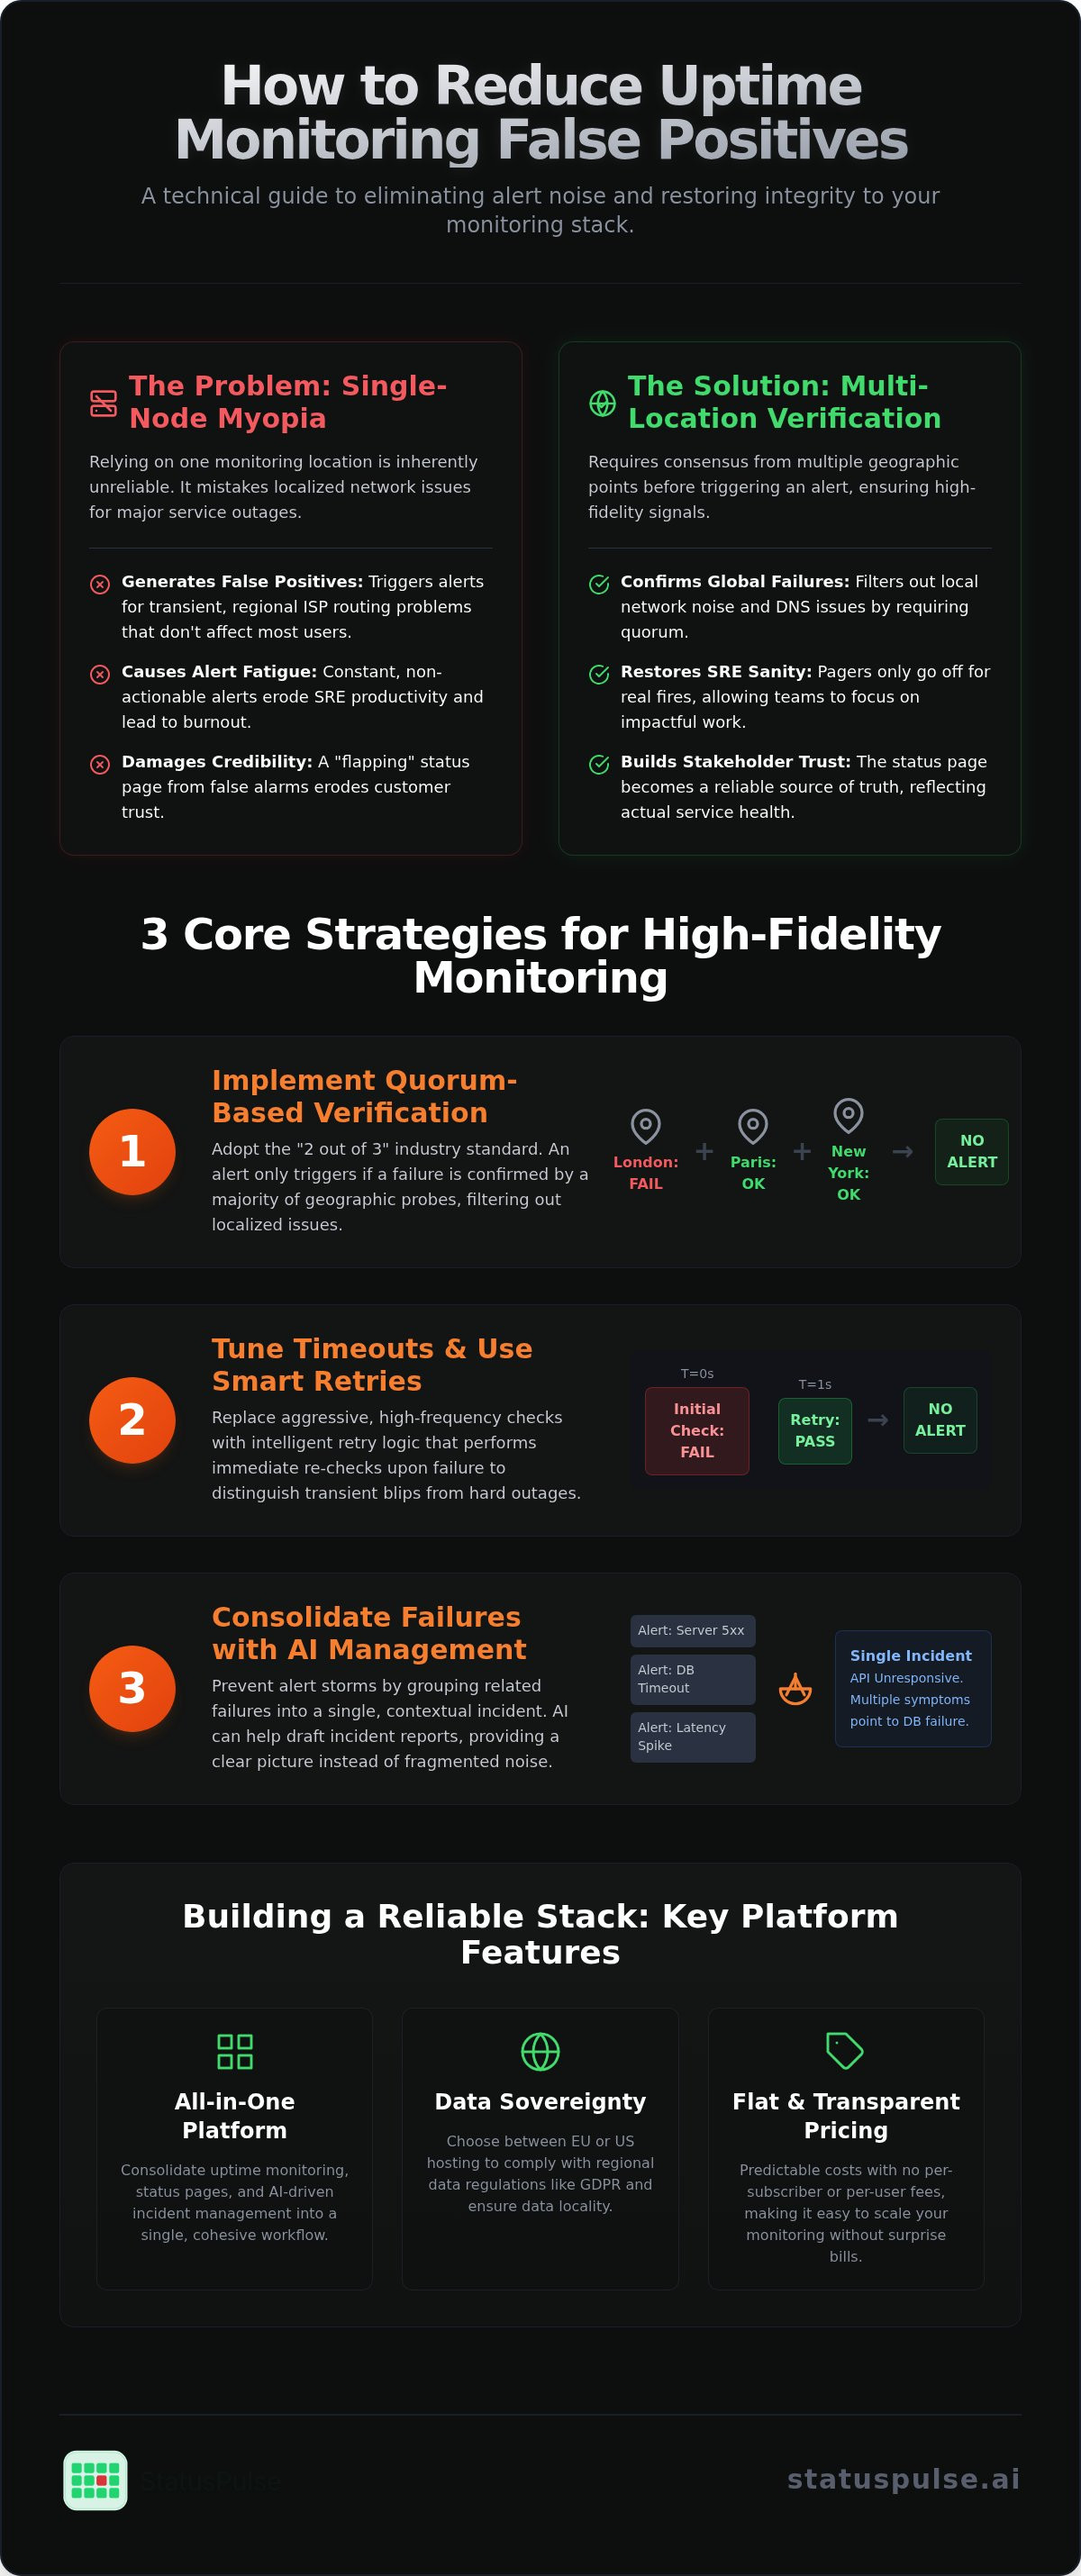
- Adopt quorum-based verification to ensure alerts only trigger when at least three distinct geographic regions confirm a failure.
- Learn how to reduce uptime monitoring false positives by replacing aggressive timeouts with smart retry logic that performs immediate, automated re-checks.
- Consolidate related failures through alert grouping and AI incident management to prevent alert storms and maintain an accurate status page.
- Ensure data sovereignty by choosing monitoring platforms that offer a choice between EU or US hosting and transparent, flat pricing.
The Technical Anatomy of a False Positive
A false positive is a monitoring event that triggers an alert without a corresponding service failure. It's a technical hallucination. Relying on a single monitoring node is fundamentally broken. If that specific probe encounters a regional ISP routing issue, it reports a failure that doesn't exist for the majority of your users. This is why multi-location verification is the baseline for any serious setup. It prevents local network noise from becoming an emergency for your engineering team.
Alert fatigue is the direct result of these errors. It erodes SRE productivity and causes burnout during on-call rotations. When the pager fires for transient noise, trust in the system vanishes. Engineers eventually stop treating alerts with urgency, which is how real outages get missed. A flapping state occurs when a service frequently transitions between up and down states within a short timeframe, triggering a storm of contradictory notifications.
Transient Network Blips vs. Actual Outages
Distinguishing between a temporary hiccup and a hard failure is the first step in learning how to reduce uptime monitoring false positives. Most "outages" reported by basic tools are actually transient blips caused by the underlying complexity of the internet. Border Gateway Protocol (BGP) routing changes often cause temporary connectivity loss as traffic is rerouted. These shifts take seconds to resolve but can easily trigger an aggressive monitor.
| Feature | Transient Blip | Actual Outage |
|---|---|---|
| Root Cause | ISP path failure, DNS cache miss | Server 5xx, DB timeout, crashed process |
| Duration | Seconds to a few minutes | Until manual or auto-remediation |
| Scope | Regional or specific network path | Global or application-wide failure |
The "up for me, down for you" scenario is common in global SaaS. A user in Berlin might face a timeout while a user in New York has no issues. This is often a "silent failure" for a subset of users, but it isn't necessarily a total service outage. If your monitor isn't configured to distinguish between these, you'll spend your day chasing ghosts in the network stack.
The Problem with Aggressive Sensitivity
Setting a 1-second check interval sounds like a badge of honor for reliability. In reality, it's often a liability. High sensitivity doesn't account for network jitter or brief cloud provider maintenance windows. If your monitor expects a response in 500ms every single time, a minor spike in latency will trigger an alert. This noise creates a status page that looks like a strobe light, damaging your credibility with customers.
Finding a balance between detection speed and data integrity is vital. You don't want to ignore real issues, but you shouldn't alert on every 200ms delay. For a deeper look at balancing these technical needs, see our guide on Uptime Monitoring: A Developer’s Guide to Reliability and Honest Communication. True reliability comes from consistent performance, not just high-frequency polling.
Implementing Multi-Location Verification
One of the most effective methods for how to reduce uptime monitoring false positives is implementing quorum logic. Instead of alerting based on a single probe's failure, the system requires consensus from multiple geographic points. Network monitoring strategies that rely on a single node often fail to account for local congestion or DNS resolver issues specific to one data center. By checking from at least three distinct regions, you ensure that a localized ISP outage in London doesn't wake up an engineer in San Francisco. This approach also mitigates the impact of local DNS resolver failures. If a specific regional resolver fails to propagate a record, a multi-location check will reveal that the service remains reachable from other parts of the internet backbone.
Configuring Regional Quorum Rules
The "2 out of 3" rule is the industry standard for high-fidelity alerting. If your London probe fails but Paris and New York report the service as healthy, the failure is likely regional or transient. The alert is suppressed. This logic is essential for global SaaS platforms where latency varies significantly. You must account for the overhead of global latency on check times. A response that takes 200ms in the EU might take 800ms when checked from a probe in Tokyo. For distant regions, you should adjust your thresholds to account for higher RTT (Round Trip Time) without triggering a false failure.
A typical configuration for a quorum-based check might look like this:
- Check Type: HTTP/HTTPS
- Total Probes: 3
- Required Failures for Alert: 2
- Regions: EU-West, US-East, US-West
Managing Data Sovereignty and Probes
Data sovereignty is a critical consideration for modern engineering teams. European teams often prioritize probes located within the EU to align with GDPR expectations and ensure data stays within specific jurisdictions. However, global availability requires testing from US-based nodes to reflect the experience of North American users. Balancing these needs is often a trade-off between coverage and compliance. You shouldn't have to sacrifice one for the other.
We believe in giving you control over where your data lives. StatusPulse allows you to choose between EU or US hosting for your monitoring stack, ensuring you meet regional requirements without sacrificing global visibility. This flexibility is a core part of building a reliable uptime monitoring strategy that respects both your users and your legal obligations. By utilizing regional probes that match your actual user distribution, you gain a more truthful representation of site health and reduce unnecessary noise.
Tuning Timeouts and Smart Retry Logic
A smart retry is an immediate re-check performed by the same monitoring node before an alert enters the notification queue. It's a simple but effective filter. If the first check fails due to a micro-blip, the second check often succeeds milliseconds later. This single configuration change is one of the most practical answers to how to reduce uptime monitoring false positives. It ensures that a momentary packet loss doesn't turn into a high-priority incident.
Many teams default to a 5-second timeout across all services. For a complex API call involving multiple database joins or third-party integrations, this is often too aggressive. It doesn't account for cold starts or temporary congestion. A standard HTTP GET request generally benefits from a 10-second timeout baseline to accommodate normal internet jitter without triggering unnecessary noise. When configuring retries, use an exponential backoff strategy. This involves increasing the delay between subsequent checks. It ensures your monitoring stack doesn't act like a localized DDOS attack while your infrastructure is attempting to recover from a heavy load.
Protocol-Specific Timeout Thresholds
Different services require different levels of patience. A static landing page should load quickly, but an SSL handshake or a data-heavy endpoint needs more breathing room. Tuning these thresholds based on the actual workload is essential for a quiet pager.
- Static Sites: 5 seconds.
- Heavy API Endpoints: 10 to 15 seconds.
- SSL Certificate Handshakes: 30 seconds.
SSL certificate monitoring logic differs from standard uptime because the handshake involves specific cryptographic negotiations that can be slower than a basic TCP connection. For a deeper dive into managing these complexities, read our guide on API Monitoring: The Developer’s Guide to High Availability in 2026. Matching the timeout to the protocol prevents "timeout flapping" during peak traffic hours.
The Role of Sequential Checks
Checking the same node twice is often more valuable than checking ten different nodes once. It confirms that the issue is persistent on that specific network path. Most reliable setups follow a "Wait X cycles" rule. This means the system must record two or three consecutive failures before escalating the incident to PagerDuty or Slack. Your check interval should match your SLA requirements. A 1-minute interval is standard for mission-critical services. A 5-minute interval is often sufficient for internal tools or non-critical staging environments. This tiered approach ensures your team only responds to incidents that actually impact the business.
Advanced Noise Reduction and AI Management
Alert grouping is the primary defense against alert storms. When a foundational service fails, it often triggers a cascade of failures across dependent microservices. Without grouping, your team receives dozens of redundant notifications for a single event. Consolidating these failures into a single incident is a critical step in how to reduce uptime monitoring false positives and ensuring your on-call rotation remains manageable.
AI incident management takes this a step further by filtering technical logs to identify the root cause. Instead of just knowing a service is down, you understand why. Research from 2026 indicates that enterprises using AIOps report an 80 to 95 percent reduction in alert volume due to intelligent grouping and deduplication. Additionally, implementing maintenance windows ensures that planned downtime doesn't trigger false alarms. Automated status alerts keep users informed and reduce support ticket volume during confirmed outages, allowing your team to focus on the fix rather than the inbox.
Using AI to Draft Honest Incident Updates
Writing incident updates during a crisis is stressful and prone to error. StatusPulse features AI-powered incident management to assist your team by summarizing hundreds of failed checks into a single, coherent report. This allows you to communicate with stakeholders quickly without sacrificing technical accuracy. We view AI as a powerful assistant that requires a final human action; it helps you draft the truth, but you remain the authority. You can try StatusPulse for AI-driven incident management to see how this balance improves your incident response workflow.
Filtering by Response Content
A "200 OK" status code isn't always a sign of health. Your server might be returning a successful header while the page body displays a "Database Connection Error" or a blank screen. Keyword monitoring, or content-string verification, ensures the page actually loaded correctly before the monitor reports a success. This prevents false negatives where your monitoring stack thinks everything is fine while users see an empty site.
Use this checklist for effective content-string verification:
- Verify unique UI elements: Check for a specific footer ID or a unique string like "Copyright 2026".
- Exclude error strings: Ensure phrases like "Connection refused" or "SQL Error" are not present in the body.
- Check for dynamic data: Verify that specific API keys or expected data placeholders are rendered correctly.
- Set minimum body size: Reject responses that are unexpectedly small, which often indicates a partial load failure or a generic error page.
Building a Reliable Monitoring Stack with StatusPulse
A reliable monitoring stack is the sum of the technical strategies we've discussed. It requires multi-location verification, tuned timeouts, and intelligent grouping to function without noise. By consolidating these tools into an all-in-one platform, you eliminate the friction between detecting an issue and communicating it. This integration is the final step in how to reduce uptime monitoring false positives while maintaining high-fidelity alerts that represent actual user impact.
Before moving a monitor to production, use this checklist to ensure your setup is optimized for precision:
- Quorum Logic: Verify that at least three geographic regions must confirm a failure before a notification is sent.
- Sequential Retries: Ensure the system performs an immediate, automated re-check to filter out transient network blips.
- Timeout Calibration: Match timeouts to the specific protocol and expected latency of the target service.
- Payload Validation: Use keyword monitoring to check for "Database Error" or empty responses even when headers return 200 OK.
- Maintenance Windows: Sync your monitoring with deployment schedules to suppress alerts during planned downtime.
Why Integration Matters
When your monitoring detects a legitimate failure, the transition to communication should be logical. The workflow moves from detection to AI-drafted incident reports and then to public status page updates. Managing Uptime, SSL, and API monitoring in a single dashboard reduces technical overhead. It prevents the tool sprawl that often leads to misconfiguration and missed incidents. For teams seeking a principled monitoring partner, StatusPulse provides this unified workflow with a focus on technical depth rather than marketing flash.
The Ethics of Pricing and Transparency
Many incumbents in the monitoring space rely on complex pricing models that charge per subscriber or per seat. This creates a "success tax" where your costs grow alongside your user base. We opt for flat, transparent pricing. It's a fairer approach for teams that value integrity and budget predictability. While basic free tools exist, they often lack the multi-location quorum logic required for production environments. We provide the choice between EU or US hosting for every account. This ensures your data sovereignty remains intact regardless of your regional regulatory requirements. It's about giving you the tools to build a reliable system without the corporate bloat.
Restoring Integrity to Your Monitoring Stack
Reliable uptime monitoring isn't about high-frequency polling; it's about data integrity. We've explored how to reduce uptime monitoring false positives by implementing multi-location verification and protocol-specific timeout tuning. These technical shifts move your team away from reactive chaos toward a controlled, quiet on-call rotation. By prioritizing quorum logic over single-node checks, you ensure that every alert represents a genuine impact on your users rather than a transient network blip.
Your monitoring tools should be assistants, not sources of stress. StatusPulse offers a principled alternative to bloated enterprise software. With options for both EU or US hosting and AI-powered incident management to draft honest updates, you can maintain data sovereignty and clear communication without the burden of per-subscriber fees. It's time to stop chasing network ghosts and start building a monitoring strategy based on technical precision and ethical pricing.
Restore trust in your alerts with StatusPulse uptime monitoring. You don't have to accept alert fatigue as a cost of doing business. With the right configuration and a focused platform, you can finally reclaim your sleep and your stakeholders' trust.
Frequently Asked Questions
What is the most common cause of false positive uptime alerts?
The most common cause is localized network congestion or ISP routing failures that affect only the monitoring node's path. If you only check from one location, a regional blip looks like a global outage. These silent failures trigger alerts even when the service is healthy for most users. This is a primary reason why engineers look for how to reduce uptime monitoring false positives by implementing multi-location checks and quorum logic.
How many locations should I use to verify downtime?
Industry standards suggest using at least three distinct geographic regions to verify service health. A 2 out of 3 quorum rule ensures that a failure is persistent across the internet backbone rather than a regional hiccup. Using three locations provides enough data to filter out local DNS resolver issues while keeping monitoring costs predictable. It balances detection speed with the high fidelity required to maintain a reliable status page and build trust with your users.
Should I use 1-minute or 5-minute monitoring intervals?
Your monitoring interval should align with your Service Level Agreement. A 1-minute interval is standard for mission-critical production environments where every second of downtime impacts revenue. For internal tools, staging environments, or non-critical microservices, a 5-minute interval is often sufficient. Shorter intervals provide faster detection but require more careful tuning of retry logic and timeouts to avoid triggering noise during brief maintenance windows. It's about balancing speed with alert integrity.
Can AI really help reduce monitoring noise?
AI reduces noise by grouping related failures into a single incident. Instead of receiving 50 alerts for 50 failing microservices, AI incident management identifies the shared root cause. Research from 2026 shows that AIOps can reduce alert volume by 80 to 95 percent through deduplication. At StatusPulse, we use AI to assist technical teams by drafting coherent incident summaries, which helps filter technical logs into actionable insights without replacing human oversight.
What is the difference between a timeout and a connection refused error?
A timeout occurs when the monitoring node receives no response within the specified timeframe, often due to network congestion or a hanging process. A Connection Refused error is an active rejection from the server, usually indicating that the service is down or the port is closed. Timeouts are more prone to being false positives because they can be caused by transient latency. A refusal typically points to a specific server-side configuration issue or a crashed service.
Is multi-location monitoring necessary for a small SaaS?
Yes, multi-location checks are essential for any production service regardless of size. Even a small SaaS needs to maintain credibility with stakeholders. Without multi-regional verification, a single network hiccup in one data center could trigger a down state on your public status page. This creates unnecessary stress for your team and false alarms for your customers. Implementing a multi-node setup ensures your uptime data reflects the actual user experience globally and reduces alert fatigue.
How do I stop my status page from showing "Down" during a transient blip?
To prevent flapping on your status page, configure smart retries and quorum rules. Ensure the system performs an immediate re-check before updating your status. Additionally, require at least two separate regions to confirm the failure. StatusPulse allows you to choose between EU or US hosting to match your user base, ensuring that regional network noise doesn't damage your reputation. This tiered verification keeps your status page reflecting reality rather than network jitter.


