

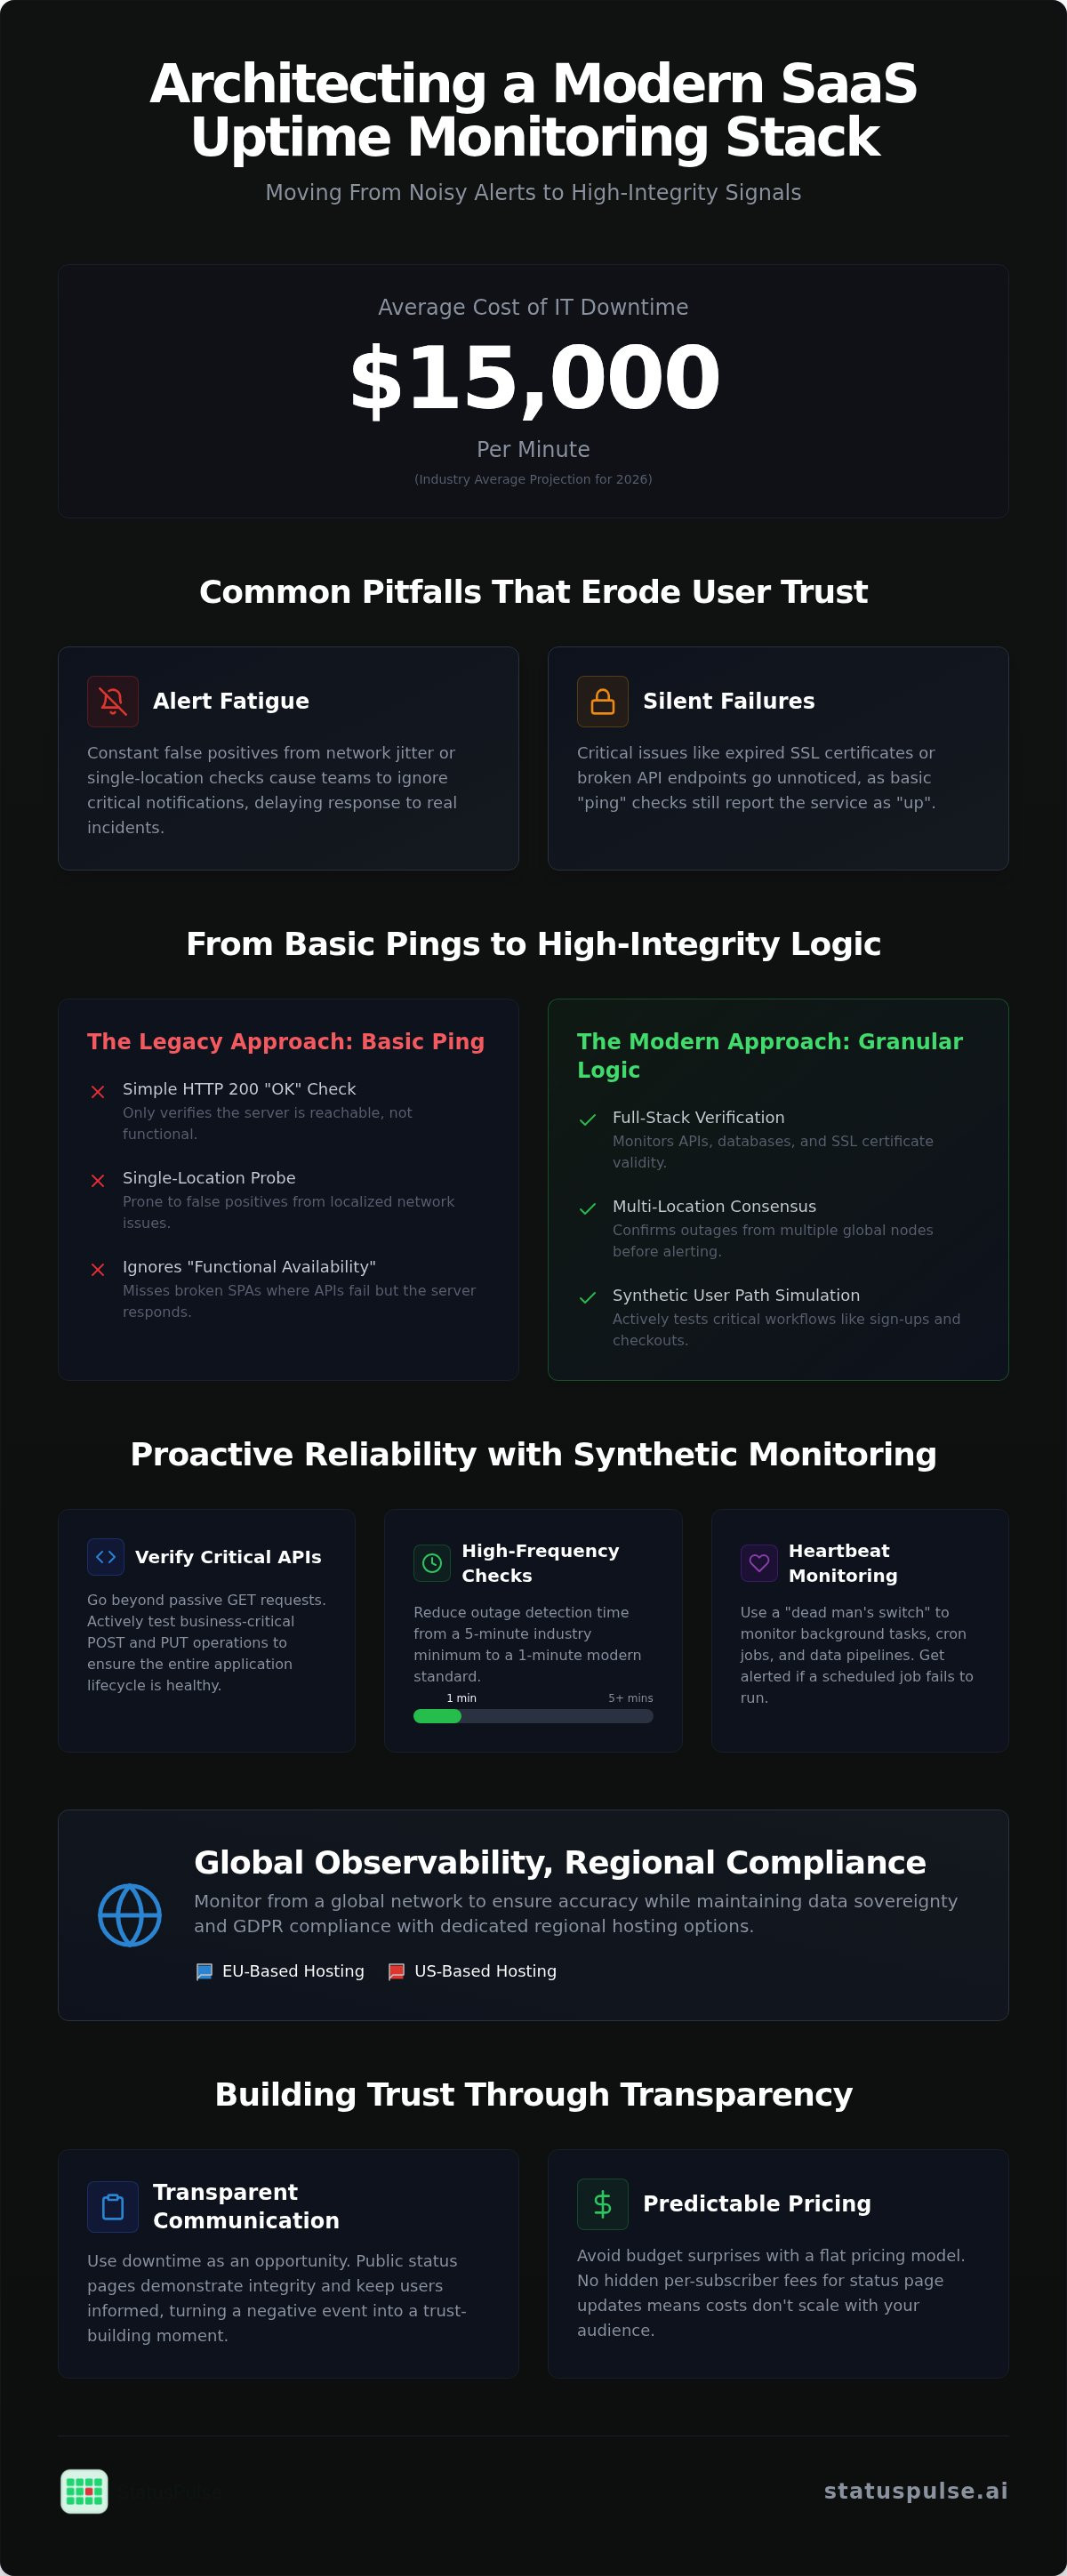
The average cost of IT downtime in 2026 has reached approximately $15,000 per minute. Despite this, many engineering teams still struggle with SaaS uptime monitoring stacks that produce more noise than signal. You know the pattern. It's the 3 AM alert for a false positive that causes instant fatigue, or the silent SSL expiration that goes unnoticed until a customer emails support. These gaps don't just drain your time; they erode the trust you've worked hard to build.
We agree that monitoring shouldn't be a source of stress or a budget black hole filled with hidden per-subscriber fees. This guide provides a technical blueprint for architecting a reliable stack that detects failures before your users do. You'll learn how to implement high-frequency 1-minute intervals and automate incident communication while maintaining strict GDPR compliance through EU-based hosting. We'll move from basic ping checks to a transparent, high-integrity system that respects both your team's focus and your users' data sovereignty.
Key Takeaways
- Implement granular SaaS uptime monitoring that goes beyond simple HTTP 200 checks to verify the actual performance of single-page apps.
- Use synthetic monitoring to simulate critical user paths, focusing on POST and PUT requests rather than just simple GET pings.
- Maintain data sovereignty by selecting monitoring locations that align with regional regulations, such as using EU-based hosting for European data.
- Leverage transparent incident communication to build trust, treating downtime as an opportunity to demonstrate integrity through public status pages.
- Avoid hidden costs by selecting monitoring platforms that use flat pricing instead of charging per subscriber for status page updates.
Beyond the Ping: Why SaaS Uptime Monitoring Requires Granular Logic
SaaS uptime monitoring is the continuous process of verifying that your application is both reachable and functional. While many tools focus on a simple "ping," true reliability requires deeper inspection. A basic Website monitoring strategy often stops at the HTTP 200 OK status code. For modern single-page apps (SPAs), this is a dangerous metric. Your web server might serve the index.html file perfectly, but if the underlying API is timing out or the database connection is refused, your user sees a broken screen. This is "functional availability." Failing to track it leads to silent churn, where users leave because the app "feels" broken despite your status page showing green.
The Anatomy of a False Positive
Network jitter is a reality of the public internet. A single failed request doesn't always indicate a server outage. It could be a temporary routing issue, a localized CDN blip, or a spike in packet loss. Alert fatigue happens when your monitoring tool lacks the nuance to distinguish between a blip and a crash. Reliable SaaS uptime monitoring requires smart retry logic and consensus. StatusPulse addresses this by performing multi-location verification. We don't page your team until the failure is confirmed from multiple independent geographic nodes. This prevents the "flapping" state where a monitor toggles between up and down, triggering a flood of notifications that your team eventually starts to ignore.
Monitoring the Full Stack
Effective monitoring must extend to every layer of your architecture. Watching the homepage is a start, but your business lives in the API layer. If your checkout endpoint or authentication service fails, your site is effectively down regardless of the uptime percentage on your marketing page. Additionally, unexpected SSL certificate expirations remain a leading cause of avoidable outages. These "Connection Not Private" errors kill trust instantly and can take hours to resolve if your registrar has manual verification steps. Integrating API Monitoring: The Developer’s Guide into your workflow ensures that every critical path is covered, from the initial TLS handshake to the final database write.
Synthetic Monitoring for API-First Architectures
Synthetic monitoring moves from passive observation to active simulation. Instead of waiting for a user to hit an error, you programmatically simulate critical paths. For modern SaaS, this means verifying that a user can actually create an account or process a payment. While basic SaaS uptime monitoring often relies on GET requests to check if a page loads, this only tests the surface. It doesn't tell you if the application is actually usable.
Prioritize POST and PUT request monitoring. A GET request might return a 200 OK because the cache is warm, even if the database is in read-only mode. By testing write operations, you ensure the entire application lifecycle is healthy. However, there's a trade-off. High-frequency synthetic checks increase server overhead and can clutter logs. Focus these intensive checks on your "money paths," the specific workflows that define your product's value. You should also monitor the third-party APIs you depend on, like Stripe or Twilio. If they go down, your app is down. Setting up these checks with StatusPulse allows you to distinguish between your internal failures and external provider outages.
Architecting 1-Minute Checks
A 5-minute check interval is the industry minimum. For a high-traffic SaaS, it's insufficient. If your site goes down immediately after a check, you lose four minutes of data before the next probe even fires. A 1-minute standard is the baseline for modern reliability. This requires a global network of low-latency nodes to ensure the check itself doesn't time out due to network distance. When configuring these, use custom headers. This allows your backend to identify monitoring traffic. You can then bypass rate limits or handle authenticated API checks without exposing real user credentials to your logs.
Heartbeat and Cron Job Monitoring
Not all failures happen on the frontend. Background workers, data migrations, and scheduled reports often suffer from silent failures. The job fails to start, but no error is thrown because nothing triggered the code. Use the "dead man's switch" pattern for these tasks. Your script sends a signal to the monitor upon successful completion. If the monitor doesn't receive that heartbeat within the expected window, it triggers an alert. This proactive approach is detailed further in our Uptime Monitoring: A Developer’s Guide, which covers how to maintain honest communication during these backend disruptions.
Global Observability and Data Sovereignty
Global observability is often marketed as a "worldwide network," but the legal reality of where your monitoring data is stored is frequently ignored. Most industry incumbents default to US-based hosting. For companies operating in Europe, SaaS uptime monitoring must account for data sovereignty. This isn't just about performance. It's about ensuring that your logs, subscriber emails for status pages, and incident data aren't exported to jurisdictions with conflicting privacy laws. With the enforcement of the NIS2 Directive in late 2024, maintaining regional data residency has moved from a preference to a compliance necessity for many entities.
| Consideration | EU-Based Hosting | US-Based Hosting |
|---|---|---|
| Compliance | Aligns with GDPR and NIS2 requirements. | Subject to US data access laws. |
| Data Residency | Logs and subscriber data stay in the EU. | Data crosses the Atlantic. |
| Network Latency | Optimal for European user bases. | Optimal for North American user bases. |
GDPR compliance extends to your incident communication. When a user signs up for status page updates, you're collecting PII (Personally Identifiable Information). If that data is stored on a US-centric platform, you may be required to disclose that transfer in your privacy policy. Keeping this data within the EU simplifies your compliance audit and reduces third-party risk. It's a straightforward way to maintain integrity with your users while avoiding the legal hurdles of cross-border data transfers.
The Latency Fallacy
A 200ms response time in New York might look like a 2s Time to First Byte (TTFB) in Berlin. This isn't a server failure; it's physics. Multi-region monitoring allows you to isolate these issues. If a Berlin probe shows a spike but London and Paris are stable, you likely have a regional CDN routing error rather than a backend outage. Don't alert your team for regional latency spikes unless they persist across multiple checks. Setting specific latency thresholds per region prevents unnecessary pages while still catching genuine performance degradation that could lead to churn.
Choosing Your Hosting Region
We provide a choice between EU or US hosting locations. This allows you to keep monitoring logs within the same regulatory zone as your primary infrastructure. For enterprise SaaS, this simplifies the Data Processing Agreement (DPA) and Master Service Agreement (MSA) process. By keeping data local, you reduce the legal complexity of third-party risk assessments. It's a principled approach that prioritizes privacy over the convenience of a single data silo. You shouldn't have to compromise your compliance posture just to get reliable uptime data.
Incident Communication: The Human Side of Uptime
Even with a robust SaaS uptime monitoring stack, downtime is inevitable. Hardware fails. Third-party APIs lag. Your brand isn't defined by the outage itself, but by how you handle the fallout. Most developers dread the communication phase of an incident. It's high stress. You're trying to debug a production issue while support is getting hammered with tickets. This friction often leads to "radio silence," which is the quickest way to lose customer trust.
This is where the "transparency paradox" comes in. By being open about your failures, you build more trust than if you tried to hide them. It shows you're in control and value your users' time. Honest communication transforms a technical failure into a customer success opportunity. For a deeper look at the logic behind this, read about The Architecture of Incident Communication Transparency. Being proactive isn't just ethical; it's a practical way to manage the load on your engineering team.
AI-Assisted Incident Management
During a technical crisis, staring at a blank text box is a waste of resources. AI shouldn't replace the engineer, but it can act as a technical assistant. It can ingest error logs or incident notes and draft a concise summary for your users. This reduces the cognitive load on your SREs. You keep a human-in-the-loop to review, edit, and approve the text before it goes live. Proactive public status updates can significantly reduce support ticket volume. When users see an issue is acknowledged on your status page, they don't need to reach for the "Contact Us" button. It keeps your team focused on the fix rather than the inbox.
Public vs. Private Status Pages
Public status pages are for brand integrity. They show your historical reliability to prospects and current users. Private status pages are for internal stakeholders and tracking strict SLAs. Both require granularity to be useful. Don't just show a single "All Systems Operational" checkmark. Break down your status by component, such as the Dashboard, the API, and Webhooks. This level of detail helps users understand if an outage actually affects their specific integration. You can customize these pages to match your SaaS identity, ensuring a professional experience even when things go wrong. If you want to automate this process, you can launch your own public status page and start building trust today.
StatusPulse: A Principled Approach to SaaS Availability
StatusPulse is a tool built by specialists for specialists. We saw a market dominated by faceless corporations and decided to build a principled alternative. Our SaaS uptime monitoring platform avoids the flashy marketing and hidden costs common among industry incumbents. We specifically reject the model of charging per-subscriber for status page updates. Your success shouldn't come with an increasing bill every time a new user signs up to stay informed about your service health.
All-in-One vs. Tool Sprawl
Managing a fragmented monitoring stack leads to administrative bloat and technical friction. StatusPulse combines uptime, API, and SSL monitoring with AI-powered status pages in a single, focused interface. If your team requires deep, session-by-session frontend profiling, a dedicated RUM tool is likely a better fit. However, for teams focused on high-integrity availability, our streamlined UI removes the noise. You can configure domain expiry checks and SSL tracking in less than five minutes, ensuring you never miss a renewal again.
The AI incident management assistant is a core part of this streamlined workflow. It doesn't act autonomously; it serves as a technical assistant that drafts updates based on your incident data. This keeps the human-in-the-loop while significantly reducing the time spent on communication during a crisis. By combining these tools, we help you maintain a high standard of transparency without the overhead of a large DevOps team. It's about reducing technical stress through simplicity and precision.
Getting Started with Integrity
Migrating your monitoring data shouldn't be a hurdle to choosing a better partner. We offer straightforward paths to move your historical data from legacy providers without losing your uptime records. You'll work with a team that values privacy and data sovereignty as much as you do. Whether you choose our EU or US hosting, you receive the same level of technical precision and human-led support. We prioritize the choice of geographic hosting to ensure your compliance requirements are met without compromise.
Our mission is to provide the reliability you need without the bloat of traditional enterprise software. We believe in flat pricing, transparent communication, and technical depth. It's time to move away from opaque enterprise contracts and toward a tool that respects your time and your budget. Start monitoring with StatusPulse today to see the difference a focused, ethical team can make for your application's availability.
Building a Transparent Reliability Stack
Reliability isn't just about keeping the lights on; it's about how you respond when they flicker. Moving your SaaS uptime monitoring beyond simple pings to deep synthetic checks ensures you catch functional failures before they impact revenue. By prioritizing regional data sovereignty and human-led communication, you transform technical debt into customer trust. You shouldn't have to choose between technical precision and ethical pricing.
We built StatusPulse to solve these specific engineering pains without the corporate bloat or predatory pricing of industry incumbents. You get a unified stack for monitoring, SSL tracking, and public status pages with a choice of EU or US hosting. There are no per-subscriber fees to penalize your growth. Our AI-powered incident drafting assists your team during a crisis, keeping the focus on the fix rather than the status update.
It's time to stop fighting your tools and start trusting your stack. Monitor your SaaS with StatusPulse to achieve professional-grade observability with total transparency. Build something reliable and keep your users informed every step of the way.
Frequently Asked Questions
What is the difference between uptime and availability in SaaS?
Uptime measures the time a system is technically powered on and reachable via network pings. Availability is a broader metric that focuses on whether the service is functional for the end user. Your server might have 99.9% uptime, but if the database is locked, the application's availability is zero. True SaaS uptime monitoring should track functional availability to ensure users can complete critical workflows without errors.
How does multi-location monitoring prevent false positives?
Multi-location monitoring uses a consensus model to verify outages before alerting your team. If a probe in London reports a failure but nodes in Paris and New York see the site as healthy, it's likely a regional routing issue. This prevents false positives caused by localized network jitter. By requiring multiple geographic nodes to confirm a downtime event, you reduce alert fatigue and ensure that 3 AM pages are only sent for genuine global failures.
Why should I monitor my SSL certificates if they auto-renew?
Auto-renewal processes often fail due to DNS configuration changes, expired payment methods, or domain validation errors. Monitoring acts as a safety net that alerts you weeks before a certificate actually expires. It also detects "Connection Not Private" errors caused by misconfigured intermediate certificates or protocol mismatches. This proactive check ensures that a technical glitch in the renewal pipeline doesn't result in an immediate loss of customer trust and site access.
Can I host my status page on a custom domain?
You can host your public status page on a custom domain, such as status.yourcompany.com, to maintain brand consistency. This allows users to find your incident updates at a familiar URL even when your primary application is down. Using a custom domain also helps with SEO and ensures that your communication remains professional. StatusPulse provides the CNAME records needed to map your domain to our infrastructure while handling the SSL certificate for that subdomain.
Is EU hosting really better for GDPR compliance?
EU hosting provides a clearer path to GDPR compliance by ensuring that PII, such as status page subscriber emails, never leaves the European Economic Area. While US companies can implement safeguards, regional data residency simplifies your Data Processing Agreement and reduces legal risk. It removes the complexities of cross-border data transfers that often require additional impact assessments. For European SaaS companies, keeping monitoring logs within the EU aligns with strict data sovereignty standards.
How does the AI incident management assistant work?
The AI incident management assistant functions as a technical peer that drafts summaries based on your error logs and incident notes. It analyzes the context of the failure to suggest clear, concise updates for your status page. This reduces the cognitive load on engineers during a crisis. The system follows a human-in-the-loop model, meaning the AI only proposes text while a human must review, edit, and click publish to ensure absolute accuracy before users see it.
Does StatusPulse support API monitoring with authentication?
StatusPulse supports API monitoring for authenticated endpoints using custom headers and tokens. You can configure GET, POST, or PUT requests to include Bearer tokens or API keys in the request header. This allows you to monitor the health of private endpoints and verify that your authentication layer is functioning correctly. Testing these "money paths" with real credentials ensures that your most critical business logic is active and reachable by authorized users.
Why is flat pricing better for growing SaaS companies?
Flat pricing eliminates the "growth penalty" found in per-subscriber or per-user models. As your SaaS scales and your status page audience grows, your monitoring costs remain predictable. This ethical approach ensures that you aren't discouraged from being transparent with a larger user base. Effective SaaS uptime monitoring should be an investment in trust, not a variable expense that fluctuates based on how many people want to receive your incident notifications.


