

Last Tuesday at 3:14 AM, a false positive triggered three unnecessary phone calls, waking your lead developer for a non-existent outage. You've likely felt the sting of opaque pricing that jumps from free to triple digits without warning. Most incumbents prioritize volume over precision, leaving you to deal with the noise. Effective uptime monitoring shouldn't be a source of stress or a drain on your budget. It should be a quiet, reliable partner that keeps you informed without the fluff.
We agree that reliability shouldn't come with a side of GDPR anxiety or complex corporate bloat. This guide teaches you how to move beyond simple pings to a strategy that combines precision monitoring with AI-driven incident transparency. You'll learn to eliminate blind spots across APIs and SSL certificates while maintaining EU-hosted data residency. We're covering everything from automated status updates where Claude drafts and you press send, to honest, predictable pricing structures that respect your bottom line.
Key Takeaways
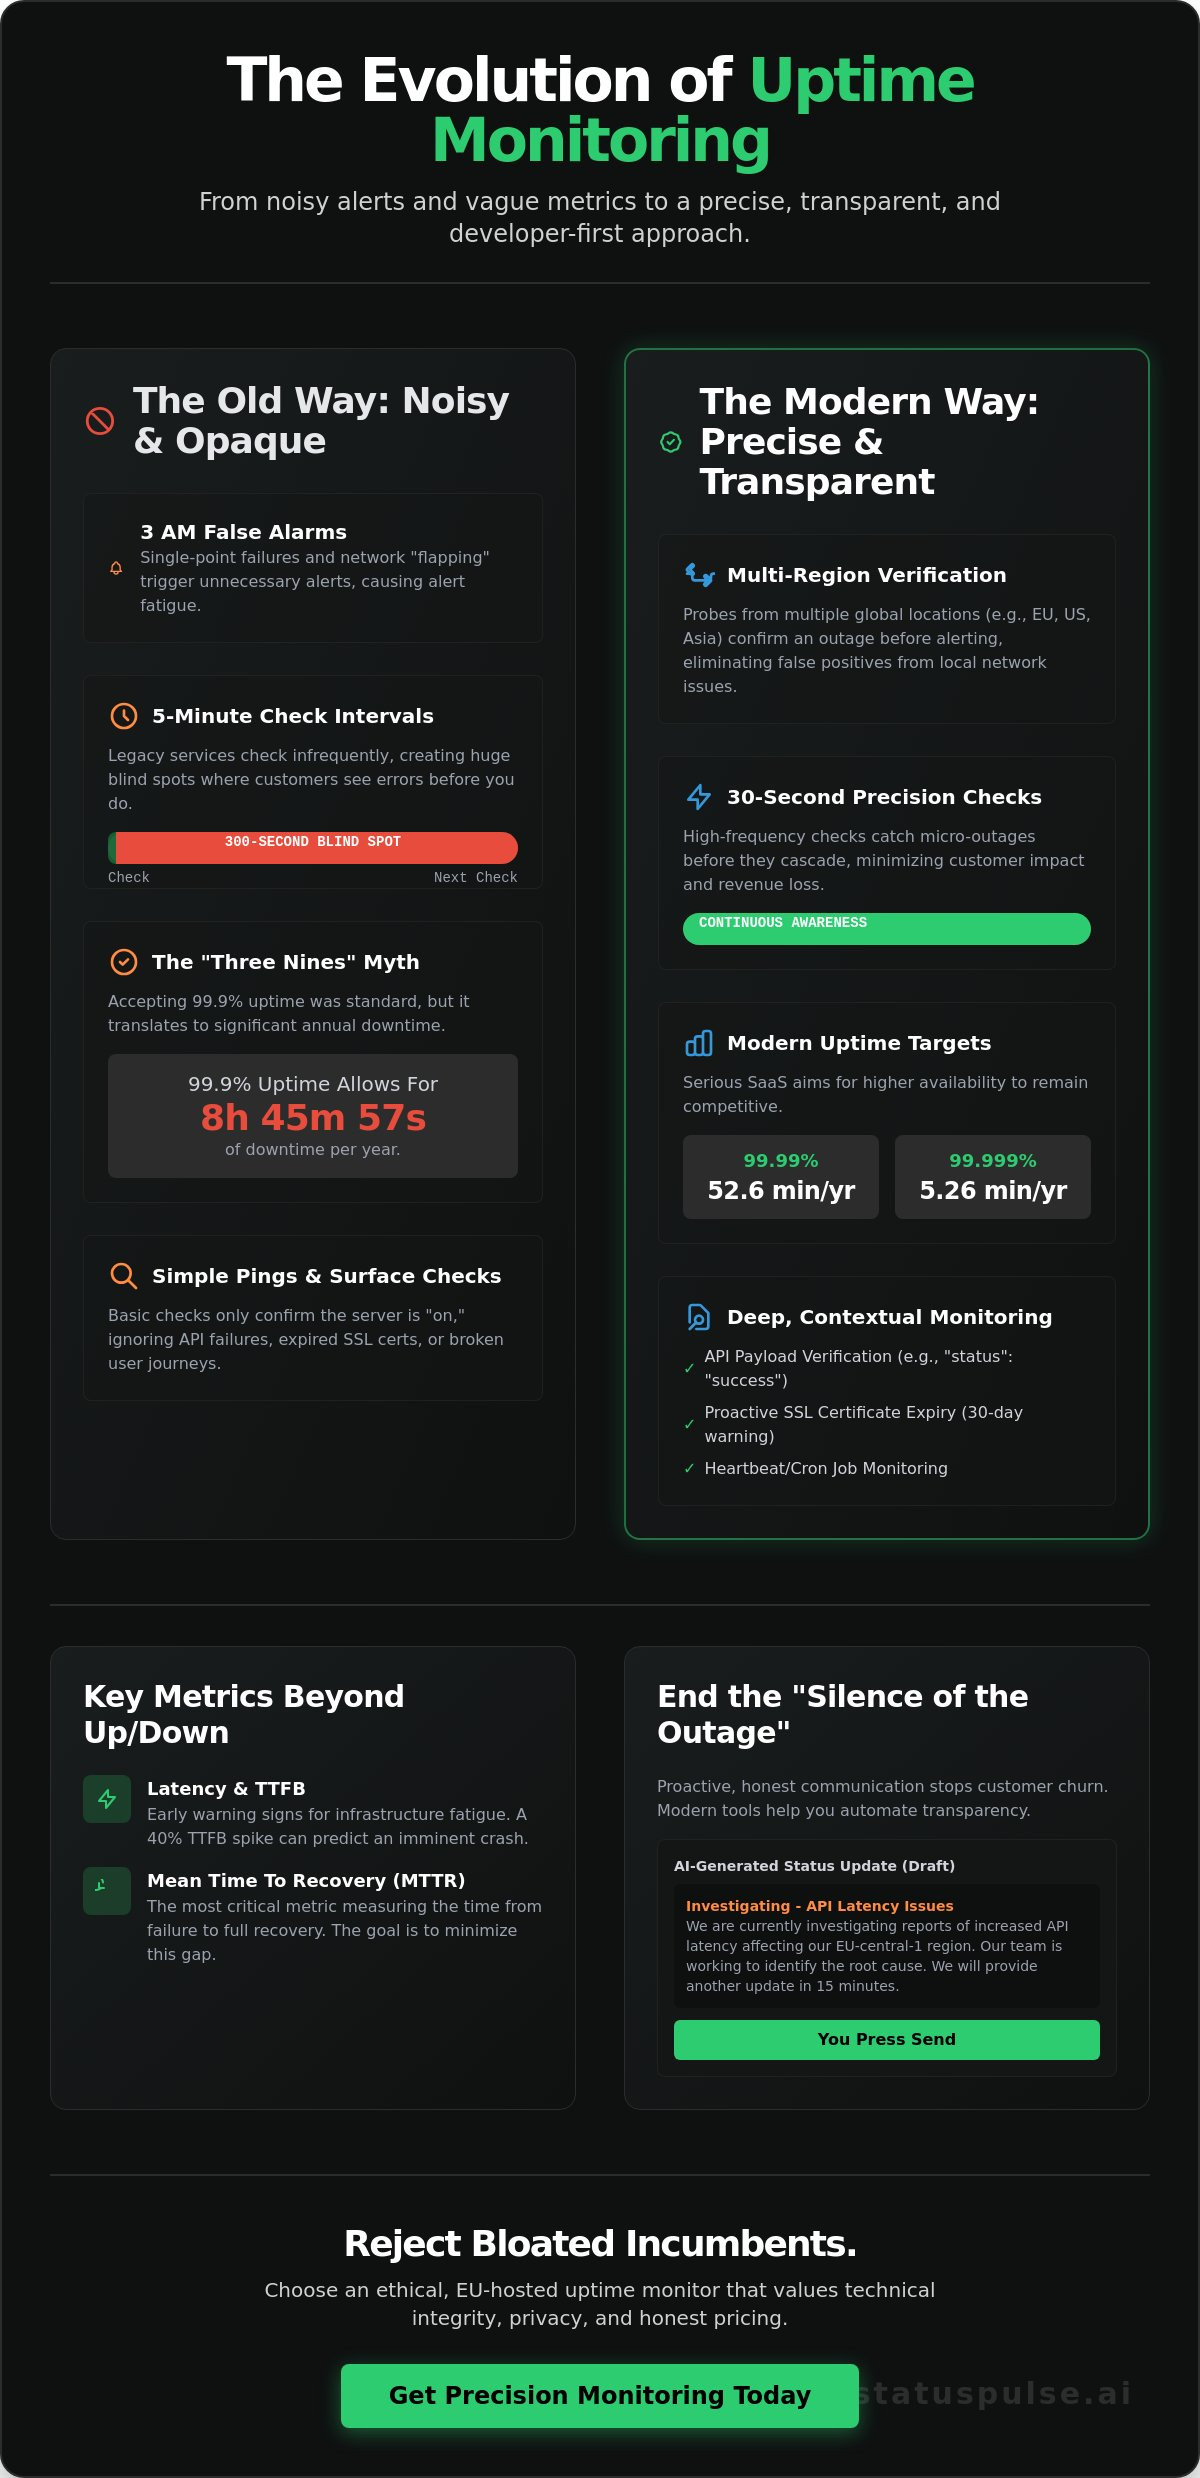
- Move beyond the "three nines" myth. Learn why modern SaaS requires continuous external validation to stay competitive.
- Master the request-response cycle. Balance precision and performance using multi-region probes and optimal check intervals.
- End the "Silence of the Outage." Discover how proactive, honest communication stops customer churn during downtime.
- Reject bloated incumbents. Choose uptime monitoring that values technical integrity, privacy, and honest pricing.
- Automate your transparency. Use AI-driven status pages to keep users informed while you focus on the fix.
What is Uptime Monitoring in 2026?
Uptime monitoring is a continuous, automated check of your service availability performed from external nodes. It ignores your internal logs and focuses on the only thing that matters: the user experience. Currently, Website monitoring has evolved from a luxury into a core requirement for any digital product. It ensures that your stack is reachable, functional, and fast from every corner of the globe.
For years, "three nines" was the benchmark. In 2026, 99.9% uptime is a baseline failure for serious SaaS providers. This level of availability allows for nearly nine hours of downtime every year. Modern users don't wait nine hours; they switch to a competitor. High-growth companies now target 99.99% or 99.999% to remain competitive. Incumbents often hide these failures behind complex dashboards, but the reality is simple. If you aren't up, you're losing money.
Internal observability tracks logs and CPU metrics. It tells you the engine is running. External monitoring tells you the car is actually moving. You need both. Logs won't tell you if a regional DNS issue is blocking 15% of your traffic in Berlin. A single minute of downtime in 2025 cost large enterprises an average of $9,000 according to industry data. Investing in a reliable monitor isn't an expense. It's an insurance policy that pays for itself in seconds.
The Evolution of Availability Tracking
Simple pings are relics of the past. Modern systems use synthetic monitoring to simulate real user journeys. These tools log in, click buttons, and verify that your API returns the correct JSON payload. For Jamstack and edge-deployed apps, global probe networks are essential. You cannot verify a global service from a single data center in Northern Virginia. You need eyes in London, Tokyo, and Frankfurt to see what your users see.
Key Metrics Beyond Up and Down
Latency and Time to First Byte (TTFB) serve as early warning signs for infrastructure fatigue. If TTFB increases by 40% over a two-hour window, a crash is usually imminent. SSL certificates remain the silent killer of site availability. Reports from 2024 show that 25% of top-tier websites experienced an outage due to a simple expired certificate. Mean Time to Recovery (MTTR) is the most critical metric because it measures the exact duration of the gap between a system failure and a full return to service.
How Modern Uptime Monitoring Works
Modern uptime monitoring is a precise request-response cycle. Every 30 seconds, a probe sends a packet to your server and waits for a specific HTTP status code, usually a 200 OK. If the server stays silent or returns a 500 error, the monitor flags a potential issue. Timing is everything here. A 5-minute check interval is a lifetime in e-commerce; it leaves a 300-second blind spot where customers could be hitting error pages. Professional setups favor 30-second intervals to catch micro-outages before they impact 10% or more of your daily traffic.
Reliability isn't just about frequency. We don't like 3 AM wake-up calls for false alarms. Incumbents often alert on a single failed ping, but smart monitors use multi-step verification. Research into IoT-enabled real-time monitoring shows that even slight delays in data transmission can signal systemic failures. High-frequency checks provide the data density needed for real-time awareness. If the first probe fails, two other locations must confirm the outage before an alert triggers. This eliminates "flapping" caused by local network congestion or temporary routing blips.
Not all tasks are public-facing. Background processes, like database backups or weekly report scripts, use "Heartbeat" or Cron monitoring. Your script pings the monitor when it finishes. If the monitor doesn't hear from your script by the expected time, it alerts you. It's simple. It works. No surprises. If you want a setup that values your time, consider an honestly priced solution that avoids corporate bloat.
Multi-Region Verification Strategies
A server might look "down" from New York but "up" from Frankfurt. This happens because of localized routing issues or CDN failures. Global probe networks identify these regional bottlenecks. Choose monitoring regions that match your core user base. If 75% of your customers are in the EU, prioritize Amsterdam and Paris nodes. It's about being GDPR-native and technically relevant. Using a single location for monitoring leads to regional false alarms that waste developer hours.
API and SSL: The Security-Availability Loop
Monitoring goes beyond the homepage. We check REST and SOAP endpoints for specific JSON strings. If the "status" field doesn't say "success," it's a failure. SSL monitoring is equally vital. It tracks certificate expiry 30 days before it happens. This prevents "Not Secure" warnings that kill conversion rates. You can route these alerts directly to Slack or Discord. It keeps your team informed without the complexity of traditional enterprise software.
Beyond the Ping: Solving the Incident Communication Gap
Alerts tell you when something is broken. They don't tell your customers. Most teams focus solely on the technical side of uptime monitoring, but they forget the human element. When a service goes dark, silence is your worst enemy. A 2023 industry survey found that 33% of customers will churn after a single outage if they feel ignored. Your users don't expect perfection; they expect honesty.
The "Silence of the Outage" creates a vacuum. If you don't fill it with facts, users fill it with frustration. Manual updates are often the first thing to fail when a technical fire breaks out. You're busy checking logs and restarting containers. Writing a polished status update is the last thing on your mind. This is where communication gaps turn into lost revenue and damaged reputations.
AI-Powered Incident Management
You shouldn't have to choose between fixing the bug and talking to your users. StatusPulse integrates AI to handle the heavy lifting. Instead of staring at a blank text box, our system analyzes technical logs to generate human-readable summaries. It translates complex errors into plain English. The workflow is built for speed: Claude drafts, you press send. You maintain human agency while benefiting from AI speed. It covers what happened, who is affected, and what you're doing to fix it. This eliminates the stress of "writing under fire" and ensures your uptime monitoring strategy includes a clear, reliable voice.
Public vs. Private Status Pages
Transparency is a competitive advantage. A public status page isn't just a list of failures; it's a record of your reliability. Showing off a 99.98% historical uptime record builds trust with prospective buyers. It proves you have nothing to hide. For larger organizations, private pages serve a different purpose. They provide internal stakeholders and enterprise partners with detailed SLA reporting. You can brand these pages to match your identity without touching a line of code. It looks like your brand, but it's powered by our infrastructure. Honest communication shouldn't be a chore. It should be a native part of your stack.
Evaluating Monitoring Services: Privacy, Precision, and Price
Choosing a tool requires a framework that looks beyond a simple feature checklist. Most industry incumbents rely on feature bloat to justify high monthly retainers. They bundle tools you'll never use into packages you can't afford. A professional uptime monitoring strategy depends on precision, not bulk. You need a tool that offers a clear view of your stack without the corporate noise. This means prioritizing honest pricing over complex tiers.
This philosophy of precision over bulk applies to your growth strategy as well. If you want to read more about how high-intent audience targeting through Connected TV and social media can drive more efficient results than broad-reach campaigns, exploring specialized agency services is a logical next step.
Many providers market "unlimited" monitors as a primary selling point. This often comes with hidden performance trade-offs. In a shared infrastructure environment, unlimited plans can lead to resource contention. When thousands of monitors run on the same worker threads, execution delays happen. We limit our Pro Plan to 50 high-performance monitors. It's a deliberate choice. We prioritize execution speed and reliability over marketing gimmicks. Fifty stable monitors are more valuable than a thousand delayed ones.
The True Cost of 'Free' Monitoring
Free tiers are often designed as traps rather than solutions. Most limit you to 5-minute check intervals. If your site goes down at minute one, you're blind for the next 240 seconds. These plans also lack multi-region verification. You risk getting woken up by false positives caused by a single local network hiccup. Beyond the technical gaps, the financial "free" is rarely true. You'll often find yourself paying extra for SMS alerts, additional team members, or public status pages. Our philosophy is different. We offer a plan that is €5, not $29. It's honestly priced. Four plans. No surprises. You get the tools you need without the incumbent tax.
Data Residency and Regional Compliance
Privacy is a functional requirement, not a marketing afterthought. For European tech startups, sending metadata to US-based incumbents creates significant legal friction. Since the 2020 Schrems II ruling, the legal risk of transatlantic data transfers has increased. Monitoring data includes IP addresses, header information, and server metadata. This is sensitive information. Being GDPR-native means our infrastructure stays in Europe. We don't just follow the rules; we build them into our architecture. Using an EU-hosted provider ensures you respect your users' privacy as much as your own. It keeps your compliance stack clean and your legal team happy.
Stop overpaying for bloated enterprise software. Get honestly priced uptime monitoring that respects your privacy and your budget.
StatusPulse: The Ethical Choice for Developer Uptime
Most monitoring platforms have become bloated incumbents. They prioritize complex enterprise contracts over the developers who actually use the tools. StatusPulse represents a principled shift away from this corporate noise. It's a platform built by developers, for developers, focusing on what matters most: quiet confidence and reliable code. We don't believe in hyperbolic marketing or aggressive sales calls. Instead, we offer a streamlined suite of tools including uptime monitoring, SSL tracking, and API checks.
Our roots are in the engineering community. We understand the stress of a 3 AM outage. That's why we've focused on building a tool that reduces friction. You won't find unnecessary features here. You'll find a robust engine that does its job without demanding your constant attention. It's about giving you the data you need to maintain a high-performing stack without the overhead of traditional enterprise software. We focus on the technical precision required for modern infrastructure while maintaining an honest, human approach to business.
Native Integration for Modern Stacks
Efficiency is our priority. StatusPulse fits into your existing workflow without requiring a manual. We offer native integrations for Slack, Discord, and PagerDuty. Your team gets alerts exactly where they already communicate. This ensures that incident response begins the moment a check fails. There's no need to toggle between multiple dashboards just to see what's broken. We've built this to be the fastest way to stay informed.
- Jamstack-friendly: Our status pages are designed to be decoupled. They stay operational even if your core infrastructure goes dark.
- API-first: You can automate your entire setup. Manage your monitors, check statuses, and update configurations via our native API.
- AI-assisted communication: When an incident occurs, Claude drafts the update. You press send. It's that simple.
The StatusPulse Promise
We believe in transparency. This starts with our infrastructure. We are EU-hosted and GDPR-native by design, not as an afterthought. Our pricing reflects this honesty. We offer four plans that grow alongside your business. You won't find hidden tiers or surprise overage charges here. It's a straightforward value proposition: professional-grade uptime monitoring at a fair price. We don't hide behind complex jargon or tiered feature gates that punish growth.
We are a small team that cares about getting the details right. We take pride in our latency numbers and our regional compliance. You can move from signing up to active monitoring in less than 30 seconds. It's time to choose a tool that respects your time and your ethics. Start your 30-second setup with StatusPulse and see the difference that focused, honest engineering makes for your stack.
Build a More Resilient Stack Today
Reliability in 2026 requires more than a simple heartbeat check. It demands a system that bridges the gap between infrastructure failure and user trust. You've seen how modern uptime monitoring has evolved into a tool for honest communication. It's about data sovereignty and precision that doesn't break your budget. Choosing a monitoring partner is a vote for the type of web you want to build.
StatusPulse offers a principled alternative to the bloated incumbents. We're EU-hosted and GDPR-native by design. Our AI-powered incident drafting means Claude handles the heavy lifting while you maintain final approval. You get professional grade reliability for €5 instead of the $29 charged by typical SaaS giants. No surprises. No hidden fees. We're a small team focused on getting the technical details right so you can focus on your code. It's time to move past the era of complex pricing and opaque data practices.
Stop guessing. Start monitoring honestly with StatusPulse.
Your users deserve transparency, and your team deserves a tool that works as hard as they do. Let's build something better together.
Whether you're managing global infrastructure or planning a trip to a major tech hub, having the right guide is essential. To explore the best local tips for your next journey, visit Parasta Tallinnassa and discover everything the city has to offer.
Frequently Asked Questions
What is the difference between uptime monitoring and observability?
Uptime monitoring tells you if your site is reachable, while observability explains why it might be slow or broken. Monitoring is the binary up or down signal every developer needs. Observability uses logs and traces to provide deeper context for complex systems. It's the difference between seeing a light is off and knowing the fuse blew. We focus on the core signal first.
How often should my uptime monitor check my website?
You should set your check interval to 60 seconds for all production sites. Checking every 1 minute ensures you catch outages before they impact more than 1% of your daily visitors. If you check every 5 or 10 minutes, a site could be down for 599 seconds before you get an alert. Faster checks mean faster recovery and less stress for your team.
Can uptime monitoring prevent SSL certificate expiration?
Yes, uptime monitoring tools track SSL expiry dates to prevent connection errors before they happen. Most services alert you 14, 7, and 1 day before the certificate actually expires. According to 2023 industry data, 80% of major outages are caused by expired certificates or simple misconfigurations. Automating these alerts removes the risk of human error. It's a simple safeguard for your security.
Do I really need a public status page?
A public status page reduces support tickets by 45% during an active incident. It builds trust by showing users you're aware of the problem and working on a fix. Instead of answering 100 individual emails, you provide one source of truth. It's about transparency. Incumbents often hide this behind expensive tiers, but we believe every developer deserves to communicate honestly with their users.
What is a 'false positive' in uptime monitoring and how do I avoid them?
A false positive is an alert triggered when your site is actually online, often caused by a local network glitch. You avoid them using multi-region verification. Our system checks from 3 different global locations before sending a notification. This ensures that a single router failure in London doesn't wake you up at 3 AM. Reliable uptime monitoring must be smart enough to double-check its own findings.
Is it better to use a US-based or EU-based monitoring service?
EU-based services are better for privacy because they're GDPR-native by default. US-based providers often struggle with strict data sovereignty laws and intrusive collection practices. We host everything in the EU to ensure 100% compliance with European privacy standards. It's about ethics and legal safety. You get technical precision without the baggage of corporate bloat or data privacy concerns.
How does AI help with incident management?
AI streamlines communication by drafting incident updates so you can focus on the technical fix. Claude drafts the message, and you press send. This saves an average of 5 minutes during the initial panic phase of an outage. It doesn't replace your judgment; it just removes the friction of writing under pressure. Technical teams use this to stay calm and keep their users informed.
Can I monitor internal APIs that aren't public-facing?
You can monitor internal APIs by whitelisting specific IP addresses or using a heartbeat monitor. Heartbeat monitoring works by having your internal service ping our servers at a set interval, like every 300 seconds. If the ping stops, we alert you immediately. This allows you to track the health of private jobs and internal databases without exposing them to the open web.


