
Your status page shows a green checkmark. Your logs show zero errors. Yet, your support inbox is filling with frustrated users who can't get the checkout page to load. This is the silent failure of the modern stack. It's the moment you realize that 100% availability doesn't mean your system is actually working for your customers.
We know the frustration of managing alert fatigue from false positives or paying for complex APM features that never get used. You need a strategy that respects your time and your budget. This guide clarifies the technical divide between uptime vs performance monitoring. We'll show you how to distinguish between reachability and usability without the corporate bloat of legacy incumbents.
You'll learn the technical distinctions between availability and speed to build a monitoring stack that actually prevents customer churn. We'll explore a framework for catching slow APIs before they impact your bottom line and how to use transparent incident communication to build trust. It's time to move past binary "up or down" metrics and focus on the speed your users actually experience.
Key Takeaways
- Understand the core technical distinction between uptime vs performance monitoring to identify whether your system is merely reachable or actually usable for the end user.
- Implement multi-region synthetic checks to eliminate localized false positives and ensure your infrastructure is healthy across the global internet stack.
- Define clear Service Level Objectives (SLOs) for latency to prevent "zombie sites" where a page loads but fails to function within acceptable timeframes.
- Build a lean monitoring stack that prioritizes precision and data sovereignty over the unnecessary complexity and high costs of legacy APM suites.
Defining the Boundary: Reachability vs. Usability
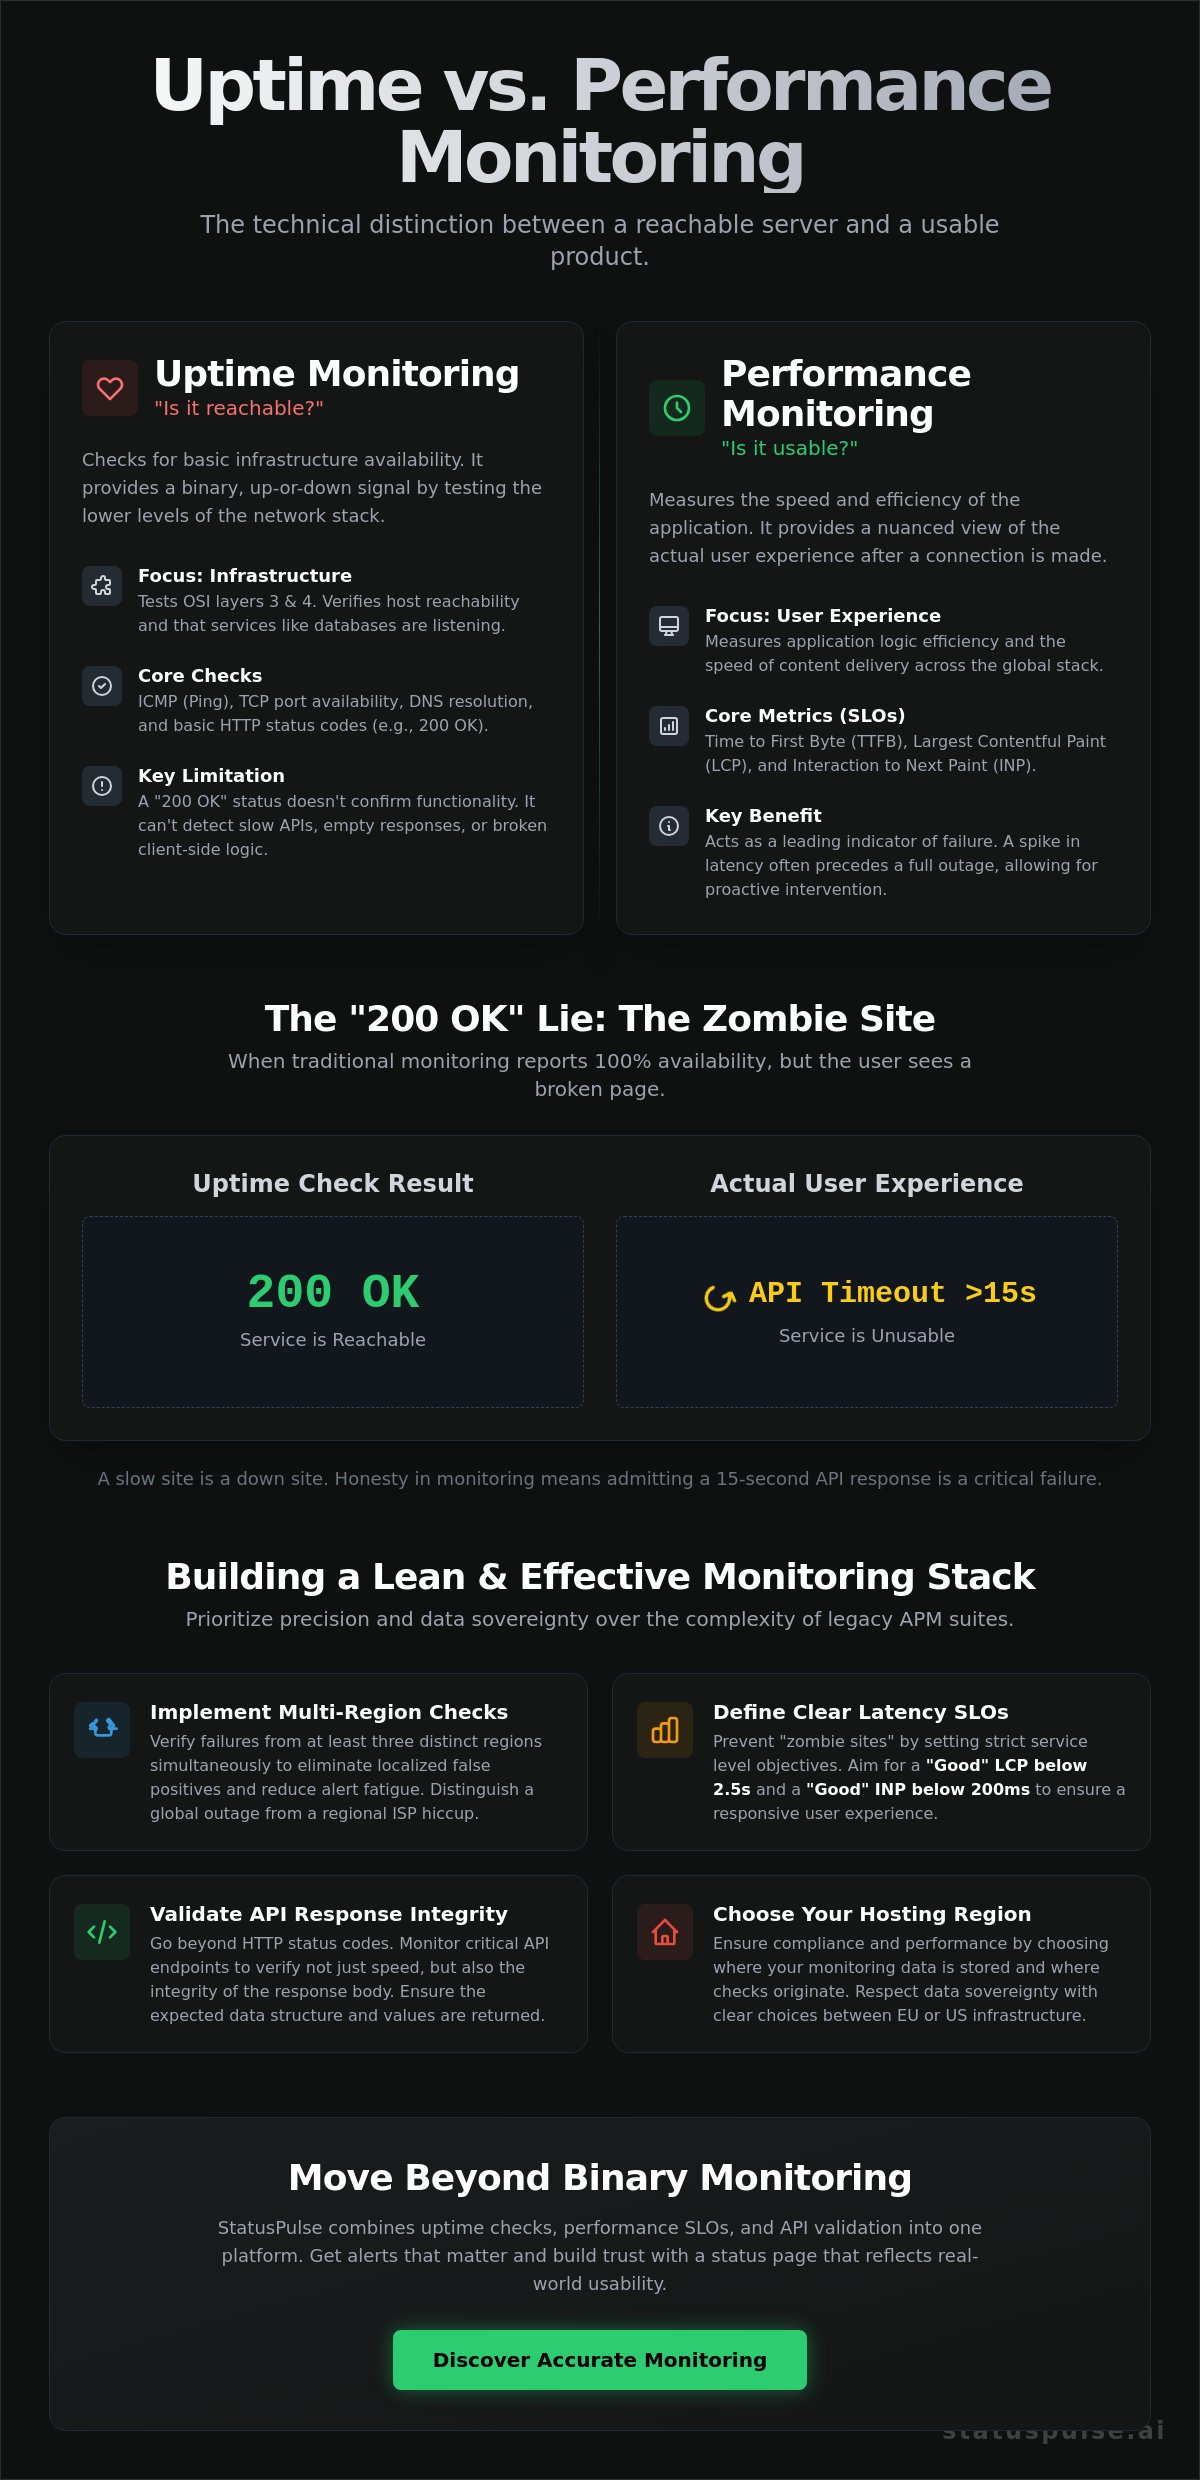
A server responding to a ping doesn't mean your checkout works. This is the fundamental tension in uptime vs performance monitoring. Uptime is a binary metric of reachability. Performance is a nuanced measure of usability. If your API takes 15 seconds to return a JSON payload, your monitoring might report 100% availability while your customers are already jumping to a competitor. Reliability isn't just about being "up"; it's about being useful.
The Binary Nature of Uptime
Uptime monitoring operates primarily at the lower levels of the networking stack. Within the broader scope of website monitoring, these checks focus on OSI model layers 3 and 4. You are testing whether the lights are on. This involves ICMP (Ping) to check host reachability, TCP port checks to ensure services like databases are listening, and DNS resolution to verify your records point to the right IP. It's the foundation of any reliability stack.
Most basic tools rely on HTTP status codes. A "200 OK" suggests success, but it's a low bar. It doesn't account for misconfigured CDNs, expired SSL certificates, or empty response bodies. While essential for catching total infrastructure collapses, uptime monitoring alone is a blunt instrument. It's the bare minimum required to maintain brand integrity, but it fails to capture the actual user experience.
The Granular Depth of Performance
Performance monitoring looks at what happens after the connection is established. It measures the efficiency of the application logic and the speed of the global internet stack. Key metrics like Time to First Byte (TTFB) reveal how quickly your server processes a request. Largest Contentful Paint (LCP) tells you when the main content is actually visible. Verified data shows that a "Good" LCP threshold is 2.5 seconds or below.
These metrics act as leading indicators of failure. A sudden spike in latency often precedes a complete outage. By tracking Interaction to Next Paint (INP), which has a "Good" threshold of 200 milliseconds or below, you can identify bottlenecks in your frontend execution before they cause a session to hang. This level of detail helps you distinguish between a network hiccup and a genuine code regression in your application logic.
Why the "200 OK" is Often a Lie
We've all seen the "Zombie Site." The browser connects. The server sends a 200 status code. Then, the page stays white because a critical JavaScript bundle failed to load or an API call timed out. Traditional availability checks miss these silent failures. Building a reliable system requires moving beyond status codes. You need to validate that your API returns the expected data structure within a specific timeframe. This is where StatusPulse adds value. It offers API monitoring that verifies both the speed and the integrity of the response, ensuring your "up" status actually reflects a working product. Honesty in monitoring means admitting that a slow site is, for all practical purposes, a down site.
Uptime Monitoring: The Pulse of Your Infrastructure
Uptime monitoring is your first line of defense. It's the heartbeat check that ensures your infrastructure is actually reachable by the public. While we discussed the technical landscape of website uptime monitoring tools in our 2026 reliability guide, the core remains synthetic testing. You aren't waiting for a real user to fail. You're simulating traffic from global locations to catch issues before they impact your bounce rate. This is the bedrock of system reliability.
Relying on a single monitoring node is a mistake. Localized network congestion or a routing issue in one data center can trigger a false positive. This leads to alert fatigue, a common pain point for DevOps teams. You need to verify failures from at least three distinct regions simultaneously. If London sees your site as down but Frankfurt and New York see it as up, the issue is likely regional, not a total outage. This distinction is vital when weighing uptime vs performance monitoring strategies. You don't want to wake up at 3 AM for a localized ISP hiccup.
API and Endpoint Validation
Availability isn't just for your homepage. It extends to your critical APIs and background workers. A simple ping check won't tell you if your authentication endpoint is returning a malformed JSON object. You need to validate the response body. If the status field in your JSON doesn't equal success, the service is down, regardless of the HTTP 200 code. This is where the technical nuance of uptime vs performance monitoring becomes clear: one checks for a heartbeat, the other checks for a sane conversation.
Monitoring automated tasks is equally critical. Cron jobs and background workers often fail silently. If your daily backup or email queue stops running, you might not notice for days. Using specialized API endpoint monitoring for automated tasks ensures these invisible processes stay healthy. It's about maintaining the integrity of the entire system stack, not just the visible frontend.
Reducing Noise with Smart Alerting
The goal of monitoring is to provide actionable intelligence, not noise. Google's SRE guide to monitoring emphasizes that alerts should be for events that require human intervention. To achieve this, configure smart retry logic. A single failed request should trigger a second check from a different region immediately. Only when multiple regions confirm the failure should the alert fire. This prevents "flapping" alerts from temporary network jitters.
Beyond the server, you must track SSL certificates and domain expiry. These are preventable causes of downtime that a standard infrastructure check might miss. At StatusPulse, we provide transparent uptime monitoring that includes these peripheral checks as standard. It's a lean way to ensure your pulse remains steady without the corporate bloat or complex pricing models of legacy APM suites. We focus on the precision you need to keep your services reachable and your engineers sane.
Performance Monitoring: Measuring the User Experience
Performance monitoring captures the friction your users feel. While uptime tells you the service is reachable, performance tells you if it's usable. This is the "speed" half of the uptime vs performance monitoring equation. It requires looking at both Synthetic testing and Real User Monitoring (RUM). Synthetic testing provides a clean baseline in a controlled environment. RUM shows you the messy reality of a real person browsing on a saturated mobile network.
Latency isn't just about your server logic. It's about the entire global internet stack. DNS lookup times, TCP handshakes, and TLS negotiation all add milliseconds before a single byte of your application reaches the client. Often, the biggest performance killers aren't even your own code. Third-party scripts for analytics, chat widgets, and ad tech can block the main thread. These scripts tank your Core Web Vitals even when your backend is healthy. Monitoring the impact of these external dependencies is critical for maintaining a fast experience.
We must also track resource exhaustion within the infrastructure. High CPU usage, RAM saturation, and disk I/O wait times are leading indicators of a pending crash. If your disk I/O is consistently hitting 90%, your application will soon become unresponsive. Monitoring these internal metrics allows you to scale resources or optimize code before a performance bottleneck turns into a complete outage. It's about moving from reactive fixes to proactive system management.
Observability with OpenTelemetry
Standardizing how we collect performance data is the goal of modern observability. Our 2026 guide to OpenTelemetry explains how traces and spans provide necessary context to slow requests. A trace shows you exactly which microservice or function call caused a delay. This turns a vague "site is slow" complaint into a specific, actionable technical task. It allows developers to see the path of a request across distributed systems with high precision.
Database and Query Performance
The database is frequently the primary bottleneck in any stack. Slow queries directly degrade the total response time and frustrate users. The "N+1" problem is a classic example where a single request triggers hundreds of unnecessary database calls. This inefficiency inflates infrastructure costs and ruins the user experience. Application-level performance metrics help you catch these query regressions during the development cycle. In the context of uptime vs performance monitoring, database health is what often determines whether your site is fast or merely "up."
When Performance Issues Become Downtime
The most dangerous failure is the one your monitoring doesn't see. We call this the "Zombie Site" syndrome. Your server is reachable. It returns a 200 OK status code. But the page takes 15 seconds to load. For a modern user, a 10-second delay is indistinguishable from a complete outage. This is where the distinction between uptime vs performance monitoring collapses into a single problem: reliability. If a user can't complete a task, your site is down. Period.
You need Service Level Objectives (SLOs) to manage this tension. An SLO defines the target level for your service's performance. If your objective is that 99% of requests must complete in under 500ms, any request slower than that consumes your "Error Budget." Once that budget is spent, you stop shipping new features and focus entirely on stability. It's a disciplined way to balance speed and reliability without the hyperbolic pressure of traditional enterprise management. You're making decisions based on data, not anxiety.
The 504 Gateway Timeout Trap
Upstream performance lag often triggers downstream uptime failures. If your application server takes too long to respond, your load balancer will throw a 504 Gateway Timeout. This turns a performance bottleneck into a hard availability failure. You must configure timeouts in Nginx or HAProxy to fail fast rather than letting requests hang indefinitely. For modern SaaS, a functional outage occurs the moment a critical user path exceeds 8 seconds. Proper timeout configuration ensures one slow service doesn't bring down your entire infrastructure.
Defining SLIs for Your Stack
Service Level Indicators (SLIs) provide the raw data for your SLOs. For web applications, a common SLI is the percentage of successful requests served faster than a specific threshold. High-precision performance data can trigger automated updates to your status page. This keeps users informed during "partial outages" where the site is up but slow. Be aware of the trade-off. Deep performance monitoring increases system overhead. You must choose a tool that provides visibility without dragging down the very performance you're trying to measure.
When performance degrades into downtime, transparency is your best tool for retention. Use StatusPulse to automate your incident communication and keep your users informed with real-time status pages. We provide a lean alternative to corporate bloat, focusing on the metrics that actually matter to your customers. It's about building trust through honesty, even when your system is struggling.
Strategic Monitoring: Building a Lean Observability Stack
High-end observability suites often demand a heavy tax for features your team might never touch. When you're balancing uptime vs performance monitoring, the goal isn't to collect every possible trace. The goal is to gain actionable insight that prevents churn. Legacy incumbents often lock essential features behind enterprise tiers that start at [VERIFY: Datadog infrastructure entry price] or [VERIFY: Dynatrace entry price]. For many specialists, this is corporate bloat that distracts from core reliability tasks.
Building a lean stack means choosing tools that solve specific problems. You need a clear view of your infrastructure without the noise of a thousand unused metrics. This is why StatusPulse bridges the gap between monitoring and communication. It provides a unified view of your system health while automating the transparency your customers expect. It's a principled alternative for teams that value precision over flashy marketing.
Data Sovereignty and Compliance
Most monitoring providers default to US-based hosting. For companies operating in Europe, this creates a friction point regarding data sovereignty and GDPR compliance. Regional monitoring accuracy also depends on where your checks originate. If your user base is primarily in the EU, running your monitoring nodes from the same region reduces network jitter and provides a more truthful representation of the user experience. You should have the choice to host your monitoring data in either the EU or the US to meet your specific regulatory requirements.
AI-Powered Incident Communication
Monitoring is only half the battle. The other half is what you do when the numbers turn red. AI can now summarize complex performance data into honest, plain-spoken status updates. This reduces the burden on your support team by providing proactive transparency. However, we believe in human agency. A developer should always review and approve the final update before it goes live on a public status page. This ensures the communication remains accurate and technical, avoiding the vague "investigating issues" templates used by faceless corporations.
A lean observability stack focuses on three priorities:
- Precision: High-frequency checks that distinguish between a slow site and a down one.
- Ethics: Transparent pricing and clear data hosting options.
- Transparency: Automated status pages that keep users informed without manual intervention.
By prioritizing these elements, you can manage uptime vs performance monitoring without the overhead of traditional enterprise software. You get the technical depth you need and the simplicity your team deserves. It's about building a system that respects both your time and your users' trust.
Moving Toward Proactive Reliability
Reliability isn't a binary state. It's a spectrum that spans from basic reachability to high-performance usability. You now have a framework to distinguish between uptime vs performance monitoring, allowing you to catch "zombie sites" before they drain your error budget. By focusing on SLIs that matter to your users and ignoring the noise of legacy APM bloat, you can maintain a lean, effective stack.
Building trust requires more than just internal metrics. It requires honest, transparent communication when things go wrong. We've built a platform that respects your need for data sovereignty with a choice between EU or US hosting. With transparent pricing, no per-subscriber fees, and AI-powered incident management, you can focus on shipping code rather than managing complex monitoring bills. It's time to build a system that stays fast, stays up, and keeps your users informed.
Start monitoring your uptime and performance with StatusPulse. You've got the tools to build a more resilient infrastructure. Let's get to work.
Frequently Asked Questions
What is the main difference between uptime and performance monitoring?
Uptime monitoring checks for binary availability while performance monitoring measures the quality of the connection. One tells you if the server is reachable; the other tells you if the user can actually use the application. In the context of uptime vs performance monitoring, reachability is the floor, but usability is the ceiling. You need both to ensure a reliable system that doesn't frustrate customers.
Can a website be "up" but have poor performance?
A website is often functionally down even when it returns a successful HTTP status code. If your backend takes 20 seconds to process a request, most users will abandon the session. This is why a "200 OK" can be misleading. Monitoring for Largest Contentful Paint (LCP) ensures that the visible part of your page loads within the verified 2.5-second threshold for a good user experience.
Do I need both uptime and performance monitoring for a small SaaS?
Small SaaS teams should implement a lean stack covering both. Uptime monitoring prevents you from being the last to know about a crash. Performance monitoring identifies slow database queries or bloated scripts before they cause a mass exit of users. You don't need a complex APM suite; a straightforward tool that handles both provides enough visibility to maintain a professional standard without the enterprise tax.
How does latency affect my website uptime metrics?
High latency often leads to cascading failures in your uptime metrics. When an application server lags, upstream proxies like Nginx or HAProxy may hit their timeout limits and return a 504 Gateway Timeout. This turns a performance bottleneck into a hard availability failure. Properly balancing uptime vs performance monitoring helps you identify these lag spikes before they trigger a recorded outage on your status page.
What are the most important performance metrics to track in 2026?
In 2026, focus on Core Web Vitals and backend latency. Largest Contentful Paint (LCP) should stay at or below 2.5 seconds to pass Google's "Good" threshold. Interaction to Next Paint (INP) is the primary metric for responsiveness, with a target of 200 milliseconds or less. Tracking Time to First Byte (TTFB) remains essential for identifying server-side bottlenecks and database query regressions that impact the total load time.
How often should uptime checks run for production environments?
Production environments typically require checks every 60 seconds. This frequency balances the need for rapid incident detection with the cost of monitoring overhead. For mission-critical APIs, 30-second intervals are common to reduce the Time to Discovery (TTD). Always ensure your monitoring provider checks from multiple geographic regions simultaneously to avoid triggering false alerts based on localized network congestion or routing issues between specific data centers.
Is synthetic monitoring better than Real User Monitoring (RUM)?
Synthetic monitoring and RUM are complementary tools rather than competitors. Synthetic monitoring provides a stable, reproducible baseline from controlled environments to catch regressions. RUM captures the actual experience of your users across diverse devices and networks. Use synthetic checks for consistent benchmarking and RUM to understand how real-world conditions, like high-latency mobile networks, impact your application's perceived speed across your global user base.
How do I communicate performance issues to my customers?
Transparency is the most effective way to manage customer expectations during a performance dip. Use a public status page to display real-time latency metrics alongside your uptime data. AI tools can help summarize technical performance issues into honest, human-readable updates. This reduces support ticket volume and builds long-term trust by showing that your team is aware of the issue and actively working on a fix.


