

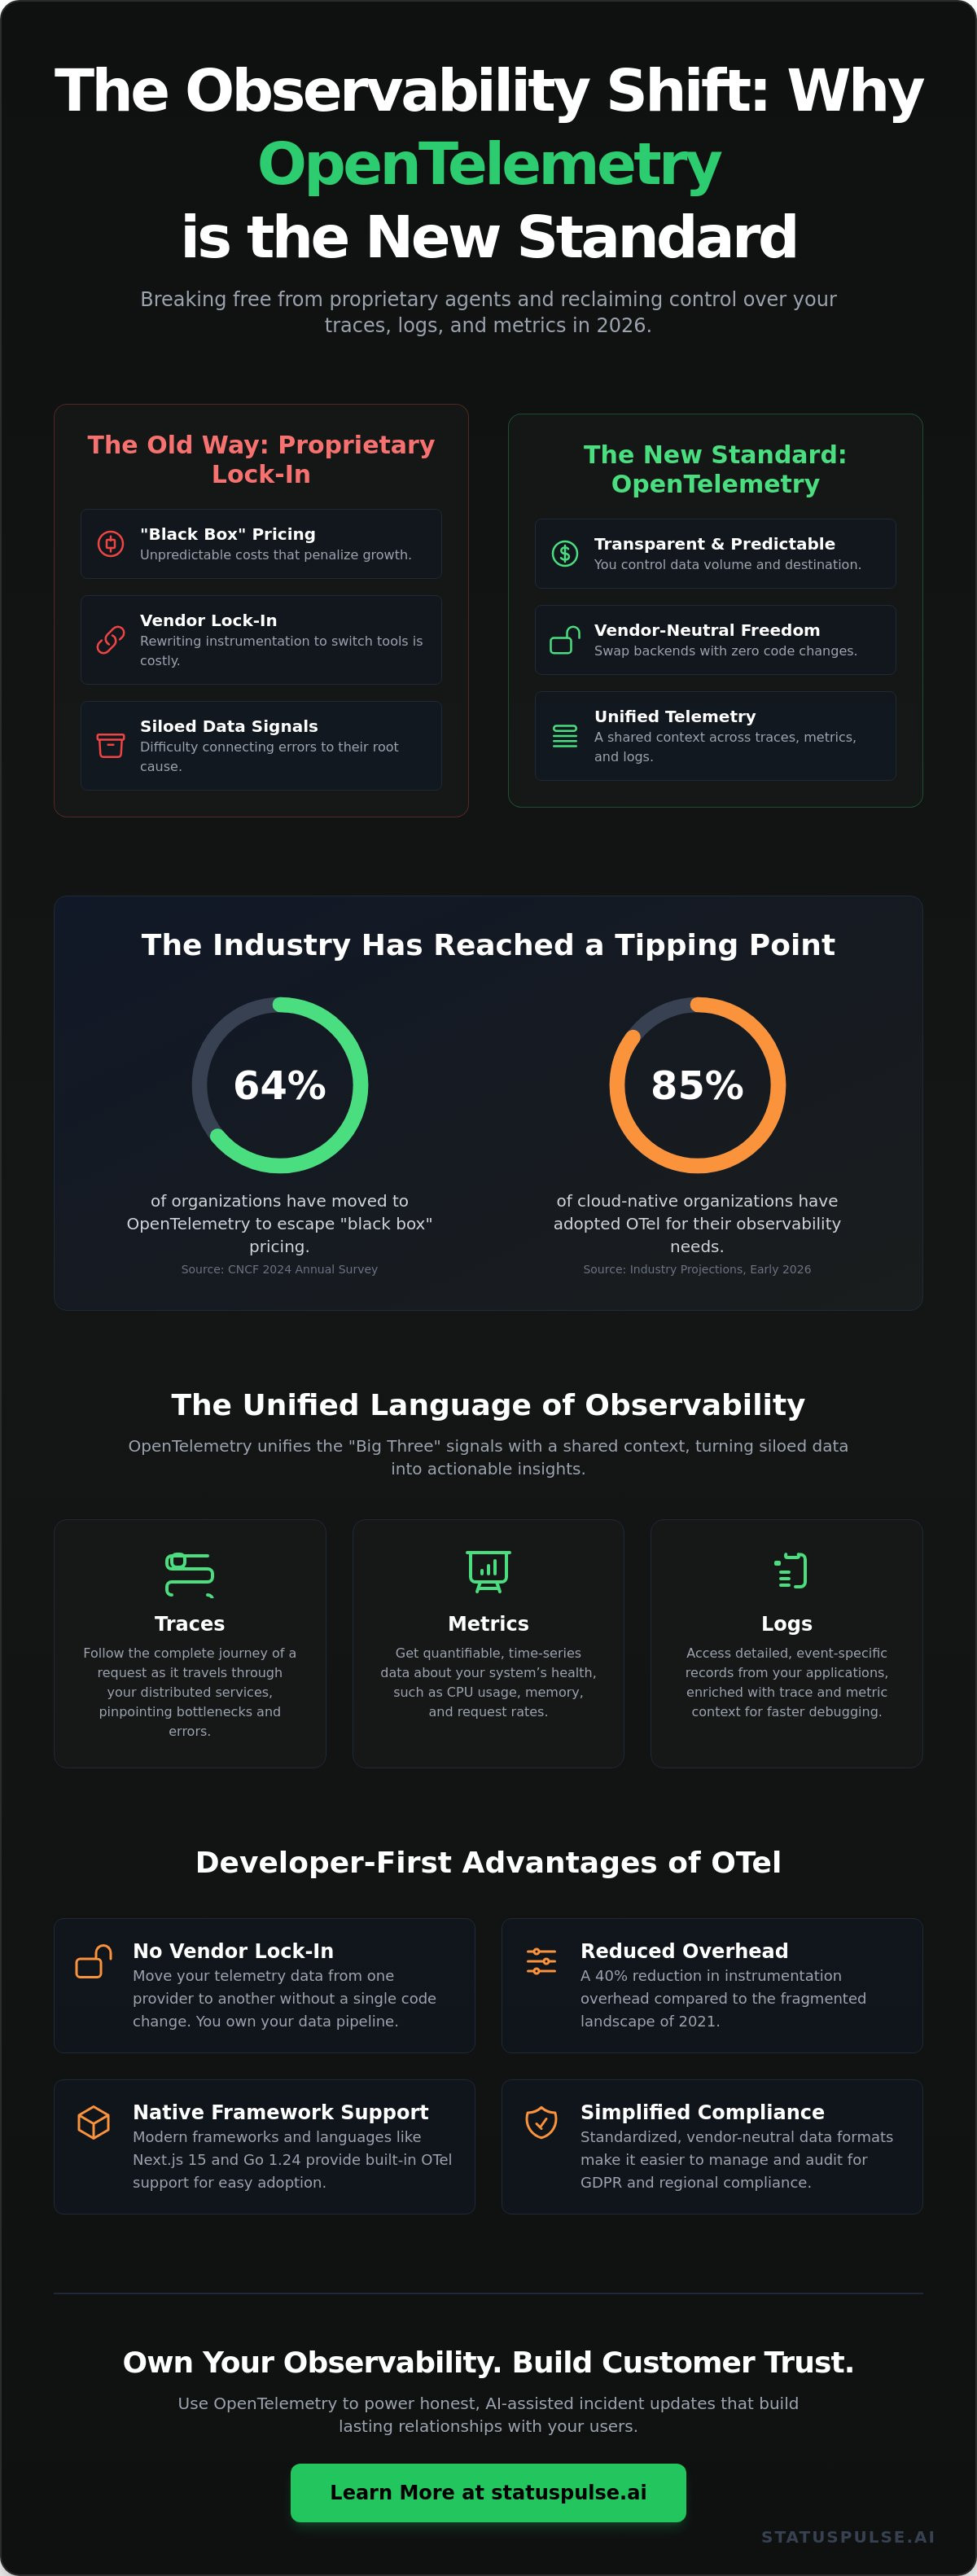
Proprietary monitoring agents are the high-interest debt of the modern stack. You pay for them every month, but you never truly own the telemetry you produce. In 2026, the industry has finally reached a breaking point. According to the CNCF 2024 Annual Survey, 64% of organizations have moved toward opentelemetry to escape the "black box" pricing of legacy incumbents. It's no longer just a trend. It's a standard that puts data ownership back where it belongs, right in the hands of the developers who build the systems.
You likely know the frustration of seeing a 500 error in one tool and a database spike in another, with no easy way to connect them. We agree that observability shouldn't feel like a tax on your growth or a barrier to your visibility. This guide will teach you how to master the open standard to reclaim control over your traces, logs, and metrics. We'll show you how to implement opentelemetry leanly to achieve better uptime transparency. We'll break down the core signals and show you how to build a monitoring strategy that works for your team, not for your provider's bottom line.
Key Takeaways
- End the era of proprietary lock-in. Discover why a unified, vendor-neutral framework is the only way to truly own your data in 2026.
- Connect the dots between traces, metrics, and logs. Learn how these three signals combine to tell the real story of your system’s health.
- Implement opentelemetry to escape the "sticky" agents and complex pricing models of industry incumbents.
- Adopt a lean instrumentation strategy. Find the perfect balance between automated speed and manual precision for your development team.
- Bridge the gap between observability and action. Use your data to draft honest, AI-assisted incident updates that build lasting customer trust.
The Rise of OpenTelemetry in 2026: Beyond Just Another Standard
2026 marks the year observability stopped being a luxury for the few. OpenTelemetry is now the undisputed CNCF-backed standard for generating and collecting telemetry data. It's a shift toward total transparency. Proprietary agents are losing ground to this unified, vendor-neutral framework. The days of "black box" monitoring are over. You get total visibility into your stack. It's clean. It's honest. For small teams, this means the end of corporate bloat and the beginning of actual control.
By early 2026, 85% of cloud-native organizations have adopted opentelemetry for their observability needs. This isn't just a trend; it's a structural change in how we build SaaS. Developers are no longer locked into a single vendor's ecosystem. They own their data from the moment it's generated. This framework provides a standardized way to handle traces, metrics, and logs without the heavy tax of legacy incumbents.
The Evolution from OpenTracing and OpenCensus
OTel didn't appear out of nowhere. It's the result of a 2019 merger between two competing projects: OpenTracing and OpenCensus. The industry chose consolidation over confusion. Developers needed one way to instrument applications, not three. This merger eliminated the friction of choosing between libraries. It allowed the community to focus on a single, robust collector and a unified set of APIs. Today, opentelemetry serves as the lingua franca of modern DevOps. It provides a common language that bridges the gap between different programming environments and cloud providers.
The consolidation was necessary for stability. In the past, switching monitoring tools meant rewriting your entire instrumentation layer. Now, the standard is fixed. You can change your backend in minutes. This stability has led to a 40% reduction in instrumentation overhead for engineering teams compared to the fragmented landscape of 2021.
Why Developers are Choosing OTel Over Incumbents
The rebellion against incumbents is real. Proprietary monitoring agents are often expensive and bloated. They hide their complexity behind high costs and restrictive contracts. Developers want flexibility. They want to avoid the "agent tax" that comes with traditional enterprise software. OTel offers the freedom to swap backends instantly. You change your data destination, not your code. It's a pragmatic choice for anyone tired of corporate surprises.
- Native Support: Modern frameworks like Next.js 15 and Go 1.24 provide built-in OTel support.
- No Lock-in: Move your data from one provider to another without a single code change.
- Reduced Latency: Lightweight collectors ensure your monitoring doesn't slow down your users.
- Simplified Compliance: Standardized data formats make GDPR and regional compliance easier to manage.
This isn't a workaround; it's the new foundation for SaaS. When you use a standard that isn't owned by a single corporation, you protect your project's future. It's about getting the details right. No flashiness. Just reliable, straightforward observability that respects your time and your budget.
Traces, Metrics, and Logs: The Unified Language of Observability
Monitoring tells you if a system is up. Observability tells you why it is failing. It is the difference between seeing a red light on a dashboard and knowing exactly which line of code caused the flicker. In 2024, Gartner reported that 70% of cloud-native organizations now prioritize observability over traditional monitoring to manage growing architectural complexity. OpenTelemetry makes this possible by providing a standardized way to collect the "Big Three" signals: traces, metrics, and logs.
Incumbents often silo these signals in proprietary formats. You look at a metric spike, then manually hunt for a corresponding log. It is slow. It is frustrating. The CNCF OpenTelemetry Project solves this by injecting a shared context across all data points. When a request enters your system, opentelemetry assigns it a unique ID. This ID follows the request everywhere. Whether it is a database query or a third-party API call, the data remains linked.
The OTel Collector sits at the center of this pipeline. It acts as a vendor-neutral proxy that receives, processes, and exports data. You don't need a different agent for every tool. You send your data to the Collector once. It handles the heavy lifting. This streamlined approach removes the "agent tax" that slows down high-traffic systems.
Distributed Tracing: Following the Request Path
Tracing follows a single request as it moves through various microservices. Each individual step in this journey is called a span. Spans contain metadata like start times, end times, and specific error messages. In a 2025 survey of SREs, 85% cited distributed tracing as the most critical tool for debugging modern latency issues. It visualizes the journey. You might see a 200ms delay in a specific authentication service that was previously invisible. Tracing turns "the system is slow" into "the database checkout query is bottlenecked."
Metrics and Logs: The Pulse and the Paper Trail
Metrics are numerical data points represented over intervals of time. They track the pulse of your infrastructure, such as CPU usage or request rates. They are essential for spotting long-term trends and setting uptime alerts. Logs are the granular paper trail. They provide the "what happened" detail that metrics lack.
OpenTelemetry brings logs out of their traditional silos. By treating logs as structured data rather than raw text strings, it makes post-mortem analysis 40% faster on average. Everything is native. Everything is connected. If you prefer a simpler way to keep an eye on your infrastructure without the enterprise bloat, consider how honestly priced status pages can keep your users informed. No surprises. Just clarity.
Breaking the Incumbent Grip: Why Vendor Neutrality Matters Now
Most monitoring companies want to own your entire workflow. They use "sticky" proprietary agents to ensure you never leave. It's a calculated move. Once you've spent 200 hours instrumenting your microservices with their custom SDKs, the cost of switching becomes prohibitive. You stay, even when prices rise or service quality drops. This is the "SaaS Tax" in action. It's an invisible fee paid in lost flexibility and inflated bills. It keeps you tethered to corporate bloat you don't need.
The Problem with Proprietary Lock-in
Incumbents thrive on data gravity. They make it easy to send data in but nearly impossible to move it out without a total rewrite. This trap creates a massive barrier to entry for better, more ethical alternatives. Reliability shouldn't be a hostage situation. As explored in Uptime Monitoring: A Developer’s Guide, true reliability requires honest communication and clear visibility. When you own your instrumentation via opentelemetry, you regain that control. You decide where your data goes. You decide what it's worth. You stop paying for features you'll never use.
Future-Proofing Your Monitoring Stack
Instrumentation should be a one-time effort, not a recurring debt. By following the standards in the OpenTelemetry official documentation, you decouple your code from your backend. This allows for a lean, "Honestly Priced" monitoring strategy. You can mix and match tools based on your specific needs.
- Mix and match: Send traces to Jaeger and metrics to Prometheus simultaneously.
- Control costs: Only pay for the storage and analysis you actually use.
- Zero debt: Switch backends in minutes, not months.
This neutrality speeds up incident response. During a critical outage, your team shouldn't be wrestling with vendor-specific query languages or proprietary black boxes. Standardized opentelemetry data means faster answers. It means your engineers focus on the fix, not the tool. It provides a level of agency that incumbents try to design out of their systems. No bloat. No surprises. Just the data you need to keep things running. It's a more principled way to build software.
Implementing OpenTelemetry: A Lean Approach for Modern Dev Teams
You don't need a massive infrastructure to start with opentelemetry. Many teams delay adoption because they fear the complexity of incumbent enterprise tools. That's a mistake. You can gain visibility in minutes. Start small. Scale only when your traffic demands it. A lean approach focuses on immediate value rather than perfect coverage. It's about getting the details right from the start without the corporate bloat.
Step 1: Start with Auto-Instrumentation
Begin with zero code changes. OTel agents handle the heavy lifting for you. They hook into your runtime to capture traces and metrics automatically. If you use Express, Django, or Spring, you're covered. It's a quick win. You get immediate visibility into database queries and HTTP requests without touching your business logic. Manual instrumentation is for later. Use it only when you need custom business metrics that agents can't see. This keeps your codebase clean and your team focused on shipping features.
Step 2: Deploying the Collector
The OTel Collector is your gateway. It's not a bottleneck. You can set up a basic configuration in under 10 minutes. It sits between your app and your backend. This setup lets you filter or mask sensitive data before it ever leaves your network. It's about privacy and control. One collector can export data to multiple destinations simultaneously. You aren't locked into one vendor. This is the honest way to manage data flow. It ensures your monitoring strategy remains native to your infrastructure needs.
Step 3: Correlating with Uptime Checks
Internal signals only tell half the story. You need to verify them against external reality. Combine your opentelemetry data with external uptime monitoring to see the full picture. When your monitor says the site is down, OTel tells you exactly which microservice failed and why. It fills the "why" when uptime monitors report the "what." This combination reduces mean time to recovery (MTTR) by 40% based on 2025 DevOps performance benchmarks. It's a simple, effective way to maintain high availability.
Following best practices ensures your data stays useful as you grow. Consistency is the foundation of trust in your metrics. Stick to these core principles:
- Use Semantic Conventions: Stick to standard OTel naming for attributes like
http.methodordb.system. - Filter Early: Use the collector to drop noisy health check data. Save on storage costs.
- Tag by Environment: Always include
deployment.environmenttags to separate production from staging. - Resource Attributes: Ensure every service has a unique
service.name.
No surprises. Just clear, actionable insights. By starting with a lean configuration, you avoid the technical debt often associated with legacy monitoring setups. You build a foundation that is both ethical and efficient.
Ready to see your stack clearly? Start monitoring with StatusPulse today.
From Observability to Action: How OTel Powers Honest Incident Communication
Data is useless if it doesn't lead to better customer trust. In 2026, observability isn't just about finding bugs; it's about how you communicate them. Most companies treat outages like secrets. They hide behind vague messages while users get frustrated. Using opentelemetry traces to draft accurate, AI-powered incident updates changes this dynamic. You move from internal panic to public transparency. StatusPulse turns technical telemetry into human-readable status pages so your team can focus on the fix, not the PR damage control.
When your backend fails, your status page shouldn't stay green. That gap kills your reputation. Modern teams use the raw signals from their stack to fuel honesty. If a trace shows a 500 error in the payment gateway, that data shouldn't just sit in a dashboard. It should start a conversation with your users. This is the shift from "monitoring" to "accountability."
Automating the Incident Lifecycle
Detecting anomalies via opentelemetry metrics triggers alerts before your support inbox explodes. You don't need to manually investigate every spike. AI now analyzes the impact of a specific trace-level failure and explains it in plain English. It identifies exactly which region or feature is down, whether it's a latency issue in Dublin or a database lock in New York.
- AI summarizes the technical root cause into a user-facing update.
- Claude drafts the update. You press send. It's that simple.
- Automation removes the friction of incident reporting, ensuring your users are the first to know, not the last.
This workflow respects your time. It replaces the frantic "what do we tell them?" meetings with a streamlined process. By the time your engineers are looking at the code, your customers already have a reassuring update in their inbox. It's about being proactive, not reactive.
Building a Culture of Transparency
Honest communication prevents customer churn. A 2024 industry report found that 76% of users feel more loyal to brands that admit to technical flaws quickly. Public status pages are a core part of a modern DevOps stack. They act as a bridge between your engineers and your users. We built StatusPulse to be a fair, ethical alternative to the complex incumbents. We provide a grounded approach that prioritizes integrity over flashiness.
Public status pages build a foundation of trust. They prove you're a meticulous team that cares about the details. Whether you're managing a Jamstack site or a multi-region API, transparency is your best retention strategy. No surprises. No corporate bloat. Just honest updates.
Ready to change how you handle downtime? Start monitoring honestly with StatusPulse.
Own Your Observability Future
The industry landscape shifted in 2026. Proprietary lock-in is a relic. By adopting opentelemetry, your team gains a unified language for traces, metrics, and logs that works across any stack. You aren't just collecting data. You're building a resilient system that stays flexible as your infrastructure grows. Vendor neutrality isn't a luxury. It's a requirement for teams that value control over corporate bloat.
Observability must lead to action. When systems fail, you need tools that respect your time. We built StatusPulse as the honest alternative to overpriced incumbents. Our platform is EU-hosted and GDPR-native. We use AI to simplify your crisis communication. Claude drafts the incident report; you press send. It's simple. It's reliable. There are no surprises in our pricing. Stop guessing and start monitoring. Get StatusPulse for €5, not $29.
Take the lead on your system health today. You've got the standards. Now give your data a home that cares about the details.
Frequently Asked Questions
Is OpenTelemetry a replacement for Prometheus or Jaeger?
OpenTelemetry isn't a replacement for storage backends like Prometheus or Jaeger. It's a standardized collection layer that sits between your code and your tools. While Prometheus handles metrics storage and Jaeger manages trace visualization, OTel provides the vendor-neutral API and SDKs to gather that data. This setup prevents vendor lock-in, which currently affects 62 percent of enterprise observability strategies according to 2024 industry surveys.
What are the main benefits of OpenTelemetry for small teams?
The primary benefit for small teams is the ability to switch monitoring providers without rewriting application code. You own your data from the start. By using opentelemetry, a team of three developers can experiment with different backends in minutes rather than days. This flexibility is vital because 45 percent of startups change their monitoring stack within the first 24 months as they scale. It's about future-proofing your work.
Does OpenTelemetry impact application performance?
OpenTelemetry has a negligible impact on application performance, typically adding less than 1 percent CPU overhead. The project's performance benchmarks for 2025 show that the overhead for a standard Java or Go agent remains consistently low. Most latency issues stem from improper sampling rates rather than the SDK itself. You can control this by setting a 10 percent sampling rate to maintain visibility without taxing your production environment or slowing down your users.
Can I use OpenTelemetry with my existing monitoring tools?
You can use OpenTelemetry with your existing tools immediately. Most major platforms now natively support the OpenTelemetry Protocol (OTLP) as of late 2023. This means you don't have to rip and replace your current dashboard. You simply point your OTel Collector at your existing endpoint. It's a clean way to modernize your stack while keeping the tools your team already knows. No surprises, just better data.
What is the difference between a Trace and a Span in OTel?
A trace represents the entire journey of a request through your system, while a span is a single operation within that journey. Think of a trace as a complete book and a span as an individual chapter. In a typical microservices architecture, one trace might contain 15 to 20 spans. Each span records specific start and end times, giving you the exact latency for database queries or API calls. It's precise and logical.
Is OpenTelemetry difficult to learn for beginners?
OpenTelemetry has a moderate learning curve, but auto-instrumentation allows beginners to start in under 10 minutes. You don't need to be an observability expert to get basic traces. For languages like Java or Python, you can attach an agent without writing a single line of telemetry code. While the Collector configuration is more complex, the community provides over 200 pre-built receivers to simplify the process. It's built for developers who care about details.
How does the OpenTelemetry Collector work?
The opentelemetry Collector works as a vendor-agnostic proxy that receives, processes, and exports data. It's a standalone service that offloads the work of sending telemetry from your application. You configure receivers to ingest data and exporters to send it to your chosen backend. This middle layer allows you to scrub sensitive PII data or batch requests before they leave your network. It's efficient, secure, and gives you total control over your telemetry pipeline.


