
The most familiar tool in your stack is often the one that creates the most friction. For many developers, uptime robot was the first monitoring service they ever configured. It is reliable for basic pings, but the technical landscape of 2026 demands more than just a binary check. You are likely dealing with fragmented tools where monitoring lives in one tab and your status page lives in another. This separation creates lag when every second of downtime costs your business mid-five figures per hour.
You need a system that respects both your budget and your data sovereignty requirements. This guide evaluates whether you should stick with the industry incumbent or move to a modern, integrated platform like StatusPulse. We will compare high-frequency monitoring, unified communication loops, and the impact of the EU Cloud and AI Development Act on your hosting choices. By the end, you will know which tool fits your specific DevOps stack and compliance needs.
Key Takeaways
- Define why 1-minute monitoring intervals are the baseline for 2026 production environments to minimize mean time to detection.
- Evaluate the technical constraints of uptime robot and how its per-monitor pricing scales within a modern DevOps stack.
- Identify the operational friction caused by fragmented tools and the financial impact of per-subscriber fees on public status pages.
- Assess your data sovereignty requirements by comparing EU and US hosting architectures to comply with regional privacy standards.
- Learn how to consolidate monitoring and incident communication into a single loop using AI to draft clear, technical updates.
Beyond the Ping: Defining Modern Uptime Monitoring
Modern uptime monitoring is a proactive reliability loop that combines sub-minute checks, deep API verification, and transparent public communication. Choosing between uptime robot and modern platforms depends on whether you need simple availability pings or an integrated stack that handles data sovereignty and incident management.
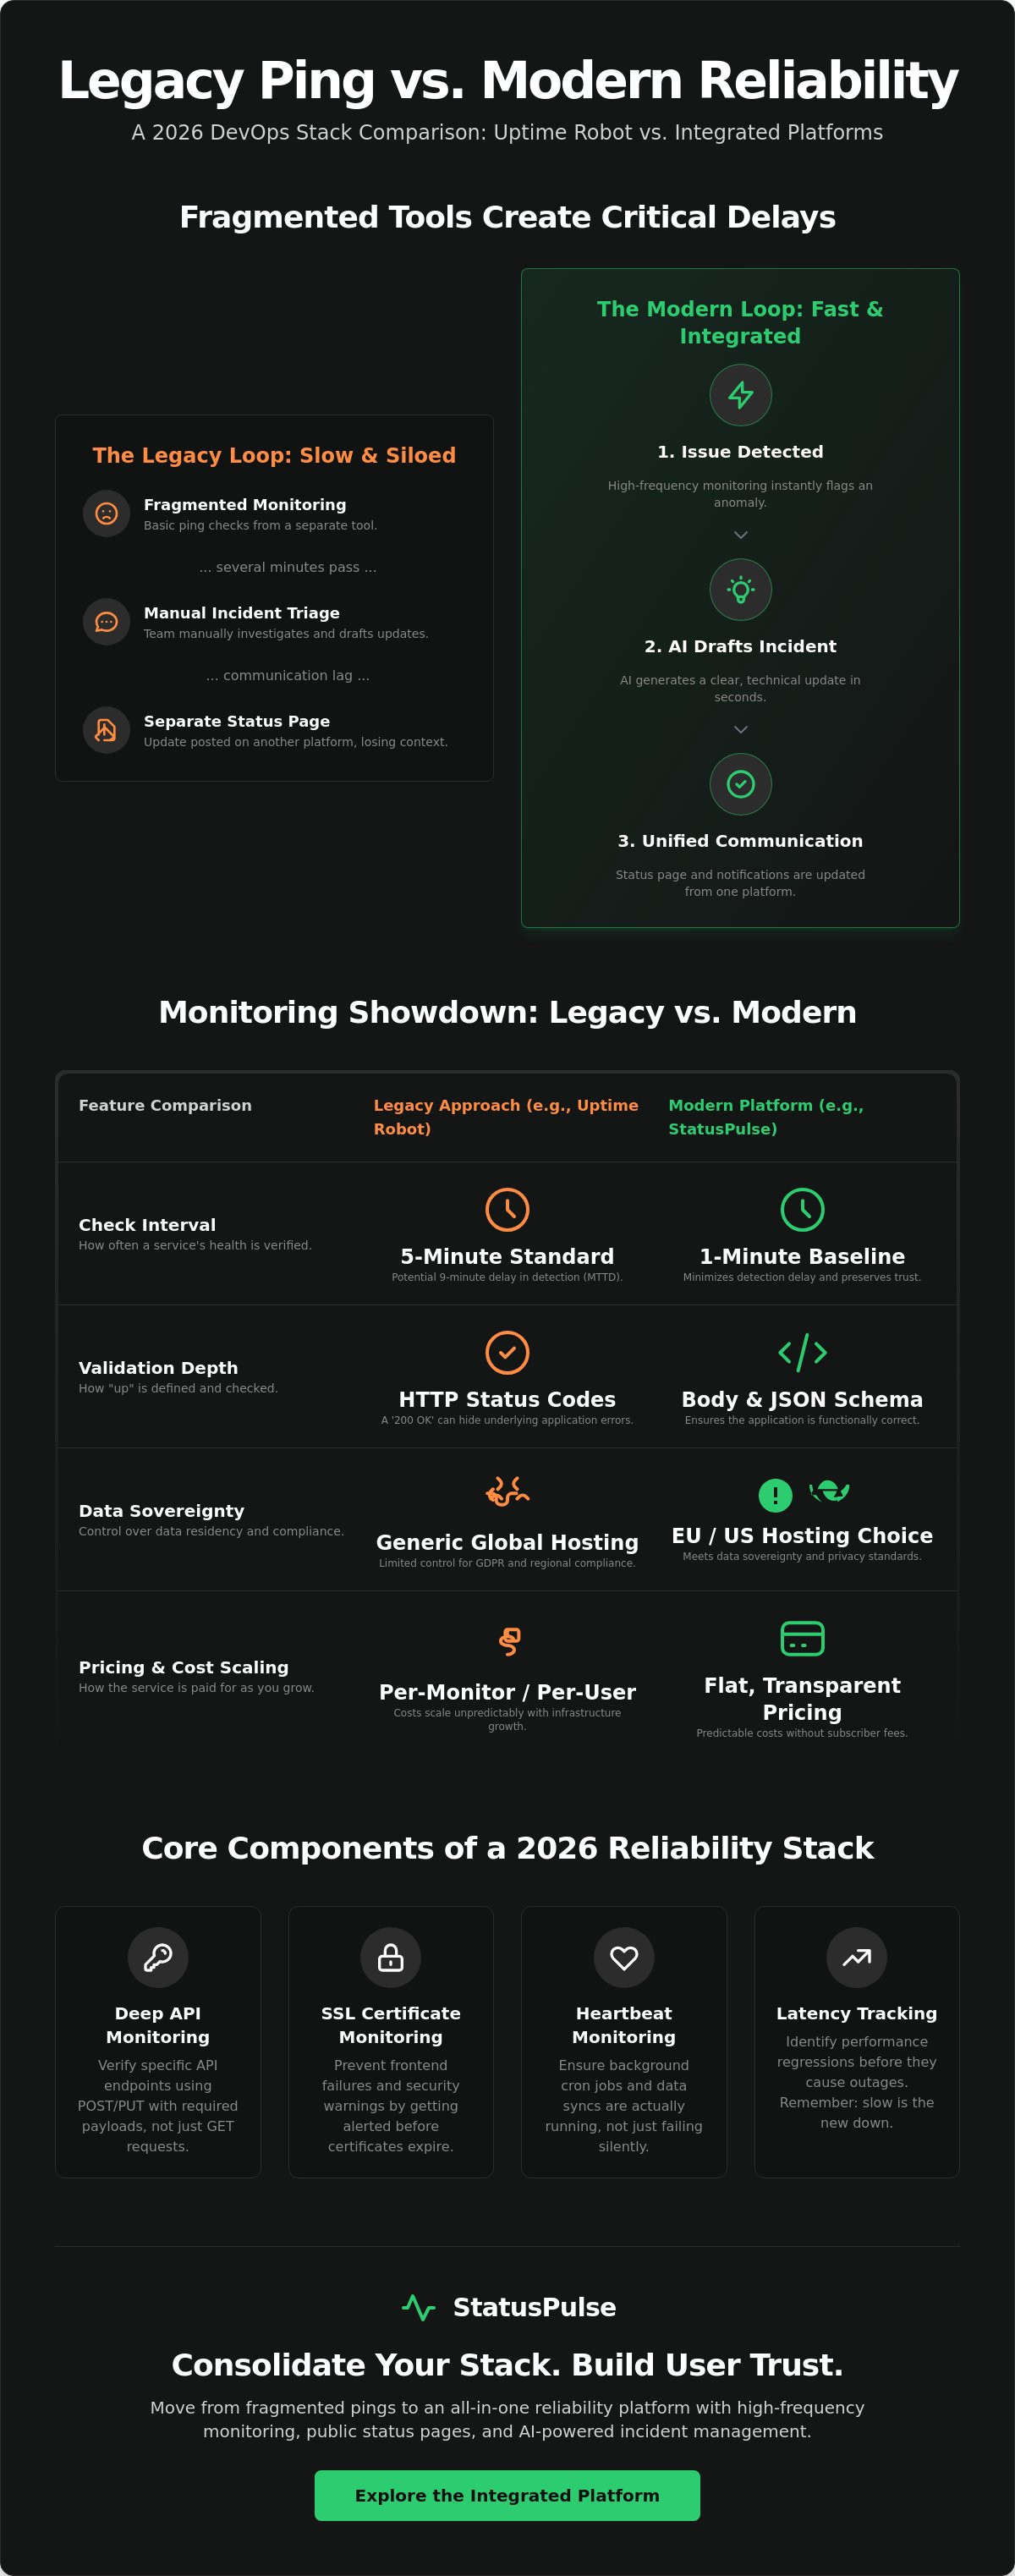
| Feature | Legacy Monitoring | Modern Reliability Stack |
|---|---|---|
| Check Interval | 5-minute standard | 1-minute baseline |
| Validation Logic | HTTP Status Codes | Body Match & JSON Schema |
| Observability | Siloed Alerts | Unified Status & Latency |
| Compliance | Generic Global Hosting | EU/US Data Sovereignty |
A basic HTTP 200 response is often a lie. Your load balancer might be healthy while your database connection has timed out. In 2026, website monitoring has evolved from a simple "is it up?" check into a comprehensive reliability loop. Legacy tools like uptime robot often focus on the "ping" to catch total outages. Modern DevOps requires a deeper look into the application layer to verify that services are actually functional. Organizations using purpose-fit tools detected outages 3.4 times faster than those using mismatched systems in 2025.
High-frequency monitoring is no longer a premium luxury. It's a requirement. If your check interval is five minutes, an outage could last nearly ten minutes before your team is even notified. For production SaaS, 1-minute intervals are the baseline. This speed allows for faster mean time to detection (MTTD) and preserves customer trust. Checking for a specific JSON key or a string of text on a page is more reliable than checking a status code. If your API returns a 200 OK but the response body is an empty array, your users are still seeing a broken experience.
The Core Components of a 2026 Monitoring Stack
A robust stack covers more than just the homepage. You need verification for specific API endpoints using POST or PUT requests with required payloads. SSL certificate monitoring is essential to prevent frontend failures before they happen. Finally, heartbeat monitoring ensures that background cron jobs and data syncs are actually running. This data shouldn't stay internal. Public status pages turn technical failures into opportunities for earned transparency. By sharing real-time reliability data through an integrated platform like StatusPulse, you build a foundation of trust with your users.
Why Latency Matters as Much as Availability
Slow is the new down. If your application takes eight seconds to load, users will treat it as an outage. Multi-region check logic helps identify if latency is a global issue or a localized routing problem. Graphing these response times over time is critical for capacity planning and identifying performance regressions before they trigger a hard down alert. You need to see the spikes before they become failures.
Evaluating Uptime Robot: Strengths and Technical Constraints
uptime robot is the industry standard for a reason. It's reliable, straightforward, and offers a generous free tier that has served the developer community for years. If you're running a personal blog or a low-traffic hobby project, it's often the most logical starting point. The platform provides a predictable experience for simple HTTP checks without any initial financial overhead.
Technical constraints emerge as you scale toward production requirements. The pricing model often follows a per-monitor structure. This can become expensive as your microservices architecture grows. While the Solo plan starts at [VERIFY: Uptime Robot Solo entry price], the cost increases as you add more monitors or require shorter check intervals. This "pay-as-you-grow" approach works for some, but it can lead to unpredictable monthly billing for teams with dynamic infrastructure.
The Free Tier Trade-off: What You Give Up
The 5-minute check interval is the primary limitation of the free plan. In a production environment, a five-minute gap between checks means an outage could persist for nearly ten minutes before an alert is triggered. Most modern DevOps teams require 1-minute or 30-second intervals to maintain SLAs. You also lose access to advanced alerting integrations like SMS or specialized webhooks. These are critical for high-stakes incident response.
Feature Analysis: Monitors, SSL, and Cron Jobs
SSL monitoring in legacy systems often acts as a standalone alert rather than an integrated part of the service health score. You get a notification when the certificate is about to expire, but it isn't always tied to the broader availability context. Similarly, "Heartbeat" monitoring for cron jobs is available but often requires moving to a higher paid tier. For teams handling sensitive metadata across borders, the EU-U.S. Data Privacy Framework governs how this monitoring data is transferred. This makes the physical location of the monitoring nodes a vital technical consideration. If you're tired of piecing together separate tools for every check type, you might consider an all-in-one platform like StatusPulse to centralize your monitoring and status pages.
| Requirement | Legacy Focus (Uptime Robot) | Modern Focus |
|---|---|---|
| Check Intervals | Tier-based (1-5 mins) | Standard 1-min or less |
| Status Pages | Basic branding | Deep white-labeling |
| SSL/Cron | Add-on features | Core integrated metrics |
The Hidden Costs of Legacy Monitoring Models
Free monitoring is often a budget illusion. While uptime robot offers a low-cost entry point for hobbyists, the true expense for a growing business lies in the fragmentation of the response stack. When a service fails, your team shouldn't be jumping between different browser tabs to update a public status page. This context-switching creates "tool fatigue" that slows down incident resolution and increases the risk of human error during high-pressure situations.
Efficient teams now follow modern observability patterns to unify their alerting and communication. Legacy models that separate monitoring from public reporting force you to manually sync data between siloed tools. This lack of integration is a technical debt that comes due during every outage. Consolidating these functions into a single platform like StatusPulse eliminates the manual bridge between detection and communication, ensuring your users receive accurate data immediately.
Communication Overhead During Incidents
Outages are high-stress events. Manually drafting status updates while trying to debug a production issue is a recipe for mistakes. Inconsistent messaging across different tools can confuse both customers and internal stakeholders. Modern platforms use AI incident management to draft technical updates directly from monitor logs. This acts as an assistant that requires only a final human review. Every second saved reduces the financial impact of downtime, which frequently reaches five figures per hour for mid-market firms. Automation allows your engineers to focus on the fix rather than the prose.
Scaling Monitoring Without Breaking the Budget
Legacy pricing models often penalize growth. Many incumbents charge per monitor or per subscriber. This creates a financial barrier to transparency. If you have 5,000 users subscribed to your status page, your monthly bill shouldn't fluctuate based on their desire for updates. Flat, transparent pricing has become the ethical standard for predictable DevOps scaling. It allows you to add monitors for every microservice without calculating the incremental cost. You should also consider the ROI of unified tools. For a detailed breakdown of these costs, read The Myth of Free Monitoring. Predictable costs allow your team to focus on reliability rather than budget management. This approach respects your time and your bottom line.
Data Sovereignty: The EU vs. US Hosting Decision
Data sovereignty is the legal principle that digital data is subject to the laws of the country where it is physically located. In the context of monitoring, this applies to your uptime logs, incident metadata, and subscriber contact lists. Legacy platforms like uptime robot typically default to a global cloud infrastructure. While they provide basic compliance, they often lack the granular control required by teams facing strict regional regulations in 2026.
EU-based SaaS providers are moving toward regionalized infrastructure to align with the Cloud and AI Development Act (CADA) proposed in June 2026. This legislation aims to reduce reliance on third-country cloud providers and strengthen digital infrastructure within the European Union. If your monitoring tool stores metadata in a jurisdiction subject to different privacy standards, you may face compliance friction under the NIS2 Directive. Choosing a provider that treats data residency as a technical configuration is essential for modern SRE teams.
Why Hosting Location Matters for Latency
Check-node proximity directly impacts the accuracy of your response time metrics. If your application is hosted in a Frankfurt data center but your monitoring service pings it from Northern Virginia, you are measuring trans-Atlantic network latency rather than true application performance. Monitoring your EU stack from EU nodes provides a cleaner data set for identifying localized routing issues. This regionalized approach is a growing trend in 2026 observability stacks. It eliminates the "noise" of global network jitter from your core availability metrics.
Compliance as a Technical Requirement
Data residency is a primary technical requirement for any service provider handling metadata. StatusPulse addresses this by offering a specific choice between EU or US hosting for your entire monitoring environment. This allows you to keep your uptime logs and status page data within the same jurisdiction as your production servers. SREs must lead the audit of these privacy credentials to ensure they meet the specific needs of their industry. Use this checklist when evaluating a monitoring provider:
- Verified Data Center Location: Can you select the specific region for data storage?
- Sub-processor Transparency: Are third-party tools used for alerting also compliant with regional laws?
- Metadata Encryption: Is data encrypted at rest and in transit using modern standards?
- Audit Logs: Does the provider offer a clear trail of who accessed the monitoring configuration?
Ensuring your monitoring stack complies with regional standards like the SECURE Data Act in the US or the NIS2 in Europe prevents legal bottlenecks. You can choose your hosting region during setup to align with your specific data sovereignty requirements.
StatusPulse: The Integrated Alternative for Modern DevOps
Choosing a monitoring tool is about finding the right fit for your current technical maturity. While uptime robot remains a practical choice for hobby projects and simple availability pings, production environments in 2026 require a more cohesive reliability loop. Fragmented tools create lag when every second counts. StatusPulse consolidates uptime monitoring, SSL verification, and incident communication into a single platform. This reduces the cognitive load on your SRE team during critical outages by eliminating the need to sync data between siloed dashboards.
AI-Assisted Incident Management in Practice
When an endpoint fails, the priority is restoration, not copywriting. StatusPulse uses AI incident management to analyze technical logs and draft human-readable updates for your status page. This assistant identifies the specific failure point, such as a 503 error or a JSON schema mismatch, and suggests an honest explanation for your users. The AI acts as a collaborator rather than an autonomous agent. It requires human final approval before any update goes live. This ensures that your technical communication remains precise and controlled. For a deeper look at these workflows, read our Uptime Monitoring: A Developer’s Guide.
Integrating SSL and API monitoring directly into the health score of your services provides a more accurate picture of uptime. You don't need separate tools for different check types. StatusPulse treats these as core components of a service's reliability. If an API returns a valid status code but the payload is malformed, the system triggers an alert. This level of detail is necessary for teams managing complex, data-driven applications where a simple "up" status can be misleading.
Transparent Infrastructure for Transparent Teams
Predictable scaling requires a pricing model that doesn't penalize your growth. StatusPulse uses flat pricing without per-subscriber fees. Whether you have ten subscribers or ten thousand, your costs remain constant. This transparency extends to your data residency. You maintain total control by choosing between EU or US hosting during the setup process. This ensures your monitoring metadata stays within your required jurisdiction, supporting your compliance with regional privacy standards without extra configuration complexity.
Teams outgrowing basic "ping" services need a tool that reflects their professional standards. Consolidation leads to faster response times and clearer communication with your stakeholders. You can build your public status page with StatusPulse today and start closing the loop between monitoring and incident response.
Consolidating Your Reliability Stack for 2026
Choosing between uptime robot and an integrated platform depends entirely on your technical maturity and compliance needs. For production SaaS, the friction of fragmented tools and per-subscriber fees represents a significant hidden cost. Modern reliability requires a unified loop where detection immediately triggers communication. This approach reduces mean time to resolution and protects customer trust during high-stakes outages.
Data sovereignty is no longer a marketing afterthought; it's a core technical requirement. You need a stack that respects regional laws while providing sub-minute check intervals. StatusPulse offers a principled alternative with flat pricing and a specific choice between EU or US hosting. Our AI incident management acts as a technical assistant to help you draft honest updates directly from your logs. It doesn't have to be complex to be effective.
Consolidating your monitoring and status pages into one platform simplifies your workflow. It allows your team to focus on the fix rather than the plumbing. Start monitoring with StatusPulse to build a more transparent and resilient infrastructure. You have the tools to turn every incident into an opportunity for earned trust.
Frequently Asked Questions
Is Uptime Robot really free for 50 monitors?
Yes, uptime robot provides a free tier with 50 monitors, but it comes with specific technical trade-offs. The primary limitation is the 5-minute check interval, which is often too slow for production environments requiring rapid detection. Advanced features like heartbeat monitoring and SSL verification are typically reserved for paid tiers starting at [VERIFY: Uptime Robot entry price].
What is the difference between uptime monitoring and observability?
Uptime monitoring is a binary check that verifies if an endpoint is reachable and functional. Observability is a broader practice of understanding a system's internal state through logs, metrics, and traces. While uptime tells you a service is down, observability helps you diagnose why it failed. Modern reliability tools bridge this gap by providing technical logs alongside availability data.
Does StatusPulse offer EU-based hosting for GDPR compliance?
StatusPulse allows you to choose between EU and US hosting during the account setup process. This ensures your monitoring metadata and subscriber lists are stored in your preferred jurisdiction. This regional choice is a core technical requirement for teams aligning with the NIS2 Directive or the Cloud and AI Development Act in Europe.
Can I migrate my monitors from Uptime Robot to StatusPulse?
You can migrate your existing configurations using our import tools or through our API. Transitioning from uptime robot typically involves exporting your monitor list and mapping HTTP/S or API endpoints to our 1-minute check intervals. This allows you to maintain your monitoring history while upgrading to a unified platform with integrated status pages.
How does AI incident management work in StatusPulse?
AI incident management acts as a technical assistant during an outage. The system analyzes monitor logs and error codes to draft a human-readable status update for your users. You review the draft and make any necessary adjustments before publishing it to your public status page. This process removes the burden of manual drafting while ensuring you maintain final human agency over the message.
Why should I pay for uptime monitoring when free tools exist?
Paying for monitoring is an investment in mean time to detection (MTTD). Free tools often limit check intervals to 5 minutes, which can result in significant revenue loss before you're even alerted. Paid platforms also consolidate fragmented tools, providing integrated SSL monitoring and public status pages that would otherwise require separate, paid subscriptions and manual synchronization.
What happens if my SSL certificate expires before the monitor checks it?
Modern monitoring prevents this by tracking the certificate's expiry date weeks in advance. Instead of waiting for a failure, the system alerts your team when the certificate has 30, 14, or 7 days remaining. This proactive approach ensures you can rotate certificates during business hours rather than responding to a frontend outage caused by a silent expiration in the middle of the night.
Does StatusPulse charge per status page subscriber?
No, StatusPulse utilizes a flat pricing model that does not include per-subscriber fees. You can scale your audience to thousands of users without worrying about fluctuating monthly costs. This predictable billing structure is designed for teams that value transparency and want to avoid the "success tax" often found in legacy monitoring models.


