

If your phone pings at 3 AM for a transient network blip that self-heals in seconds, your monitoring is a liability. Uptime monitoring for developers is a technical observability practice that uses distributed synthetic checks to validate every stage of an HTTP request, ensuring that services are not just reachable, but functional. It moves beyond basic pings to verify DNS resolution, TLS handshakes, and specific API response payloads.
You likely agree that raw telemetry is useless if it creates more noise than signal. This guide offers a technical evaluation of tools and configurations designed to integrate with developer workflows without the marketing hype. We will explore the anatomy of a robust check, frameworks for comparing providers, and how to automate the incident lifecycle using AI. By focusing on signal-to-noise ratios and data sovereignty, you can build a monitoring stack that actually assists your on-call rotation rather than exhausting it.
Key Takeaways
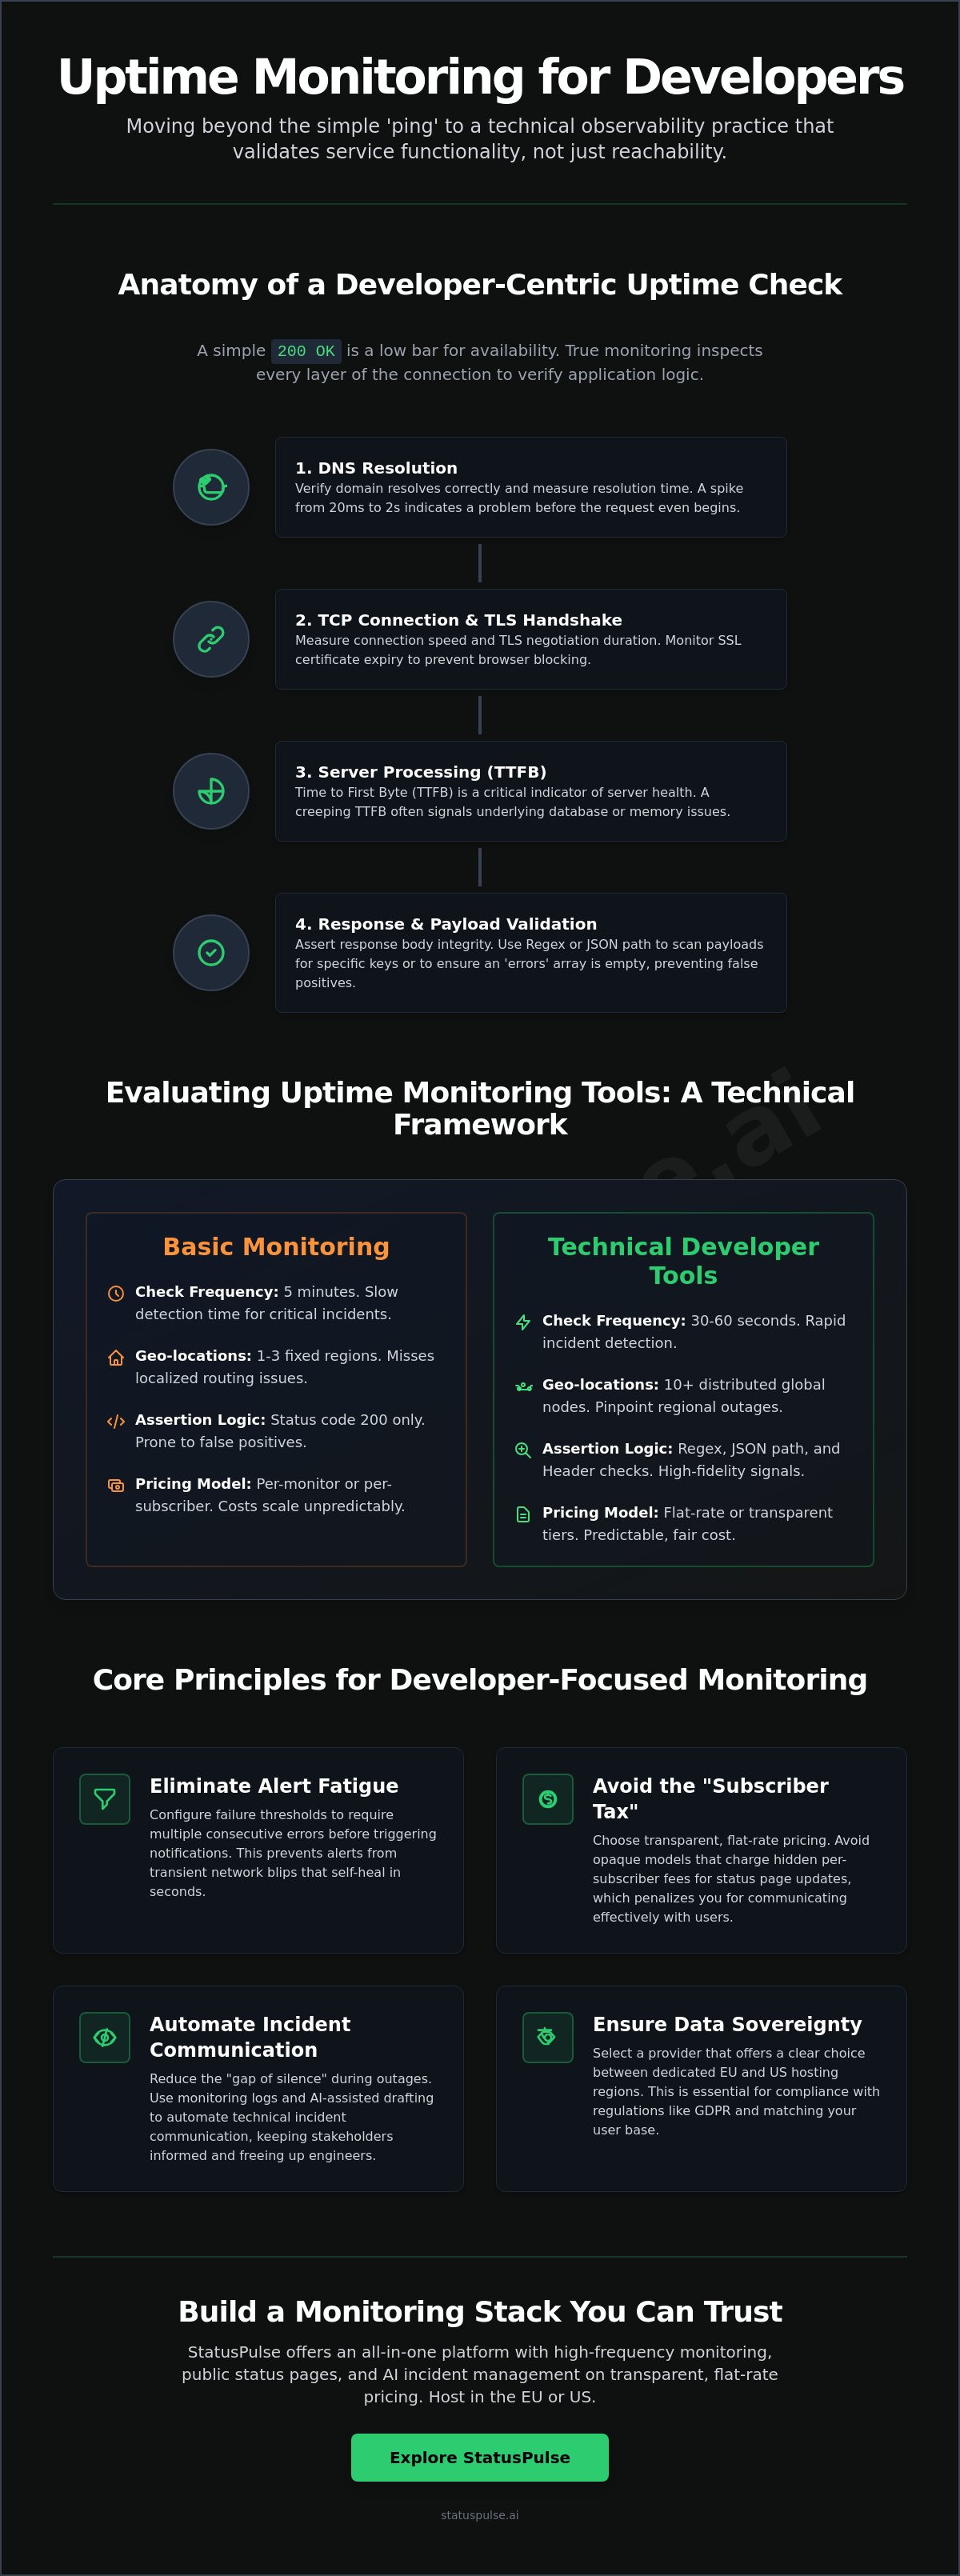
- Validate the entire request lifecycle by monitoring DNS resolution, TCP connections, and TLS handshakes rather than relying on simple status codes.
- Eliminate alert fatigue from transient network blips by configuring failure thresholds that require multiple consecutive errors before triggering notifications.
- Identify and avoid the "subscriber tax" associated with opaque pricing models that charge per-subscriber fees for status page updates.
- Reduce the "gap of silence" during outages by automating technical incident communication using logs and AI-assisted drafting.
- Select uptime monitoring developers can rely on for data sovereignty, ensuring a choice between dedicated EU and US hosting regions.
Beyond the Ping: Anatomy of a Developer-Centric Uptime Check
A simple 200 OK status is a low bar for availability. Your load balancer might report success while the underlying application is throwing a silent exception or serving a cached error page. True uptime monitoring developers can trust involves inspecting every layer of the connection. It moves past basic connectivity to verify that the application logic is actually functioning as intended.
The HTTP Request Lifecycle in Monitoring
Reliable Website monitoring requires breaking down the request into its constituent parts. A check should measure DNS resolution time, TCP connection speed, and the TLS handshake duration. If your DNS resolution spikes from 20ms to 2s, your users feel that latency even if the site is "up."
Monitoring SSL certificate expiry is just as critical as the endpoint itself. A valid endpoint is useless if the browser blocks access due to a lapsed certificate. Synthetic Monitoring is simulated user interaction for API validation. It allows you to test multi-step flows rather than single endpoints.
Time to First Byte (TTFB) is a vital indicator of server health. A creeping TTFB often signals database connection pooling issues or memory leaks before a total crash occurs. By tracking these metrics individually, you can distinguish between a network provider issue and a genuine application failure. This granularity is what separates a basic ping tool from a technical observability asset.
Custom Assertions and Header Validation
Validating the response body is the only way to ensure API integrity. You can use regex to scan JSON payloads for specific keys. For example, a GraphQL response might return a 200 OK status code even if the "errors" array is populated. Asserting that the response contains a specific data structure prevents false positives.
Configuring custom User-Agent strings is another pragmatic move. It allows you to identify monitoring traffic in your server logs. This makes it easier to filter out noise during log analysis or to bypass rate limits on specific endpoints. You can also inject custom headers to test specific cache behaviors or to bypass CDNs for direct origin monitoring.
Frequency vs. Log Noise
There is a constant trade-off between check frequency and server overhead. While 30-second checks offer faster detection, they generate significant log volume. For many production environments, a 60-second interval provides sufficient resolution without cluttering your observability stack. Tools like StatusPulse allow you to balance this precision with clear signal-to-noise ratios. The goal is to detect failures before your customers do, not to fill your disk with successful ping logs.
Evaluating Uptime Monitoring Tools: A Technical Framework
Selecting a tool requires looking past the dashboard aesthetics. For uptime monitoring developers need to trust, the evaluation must center on regional granularity and the flexibility of assertion logic. A tool that only checks from a single US-East node will miss localized routing issues affecting your European user base. You need a framework that treats monitoring as an extension of your infrastructure, not a detached third-party service.
Technical Comparison Criteria
When comparing platforms, use the following technical benchmarks to determine if a tool meets production requirements. High-frequency checks are standard, but the ability to execute complex logic at those intervals is where tools diverge.
| Feature | Basic Monitoring | Technical Developer Tools |
|---|---|---|
| Check Frequency | 5 minutes | 30-60 seconds |
| Geo-locations | 1-3 fixed regions | 10+ distributed global nodes |
| Assertion Logic | Status code 200 only | Regex, JSON path, and Header checks |
| Pricing Model | Per-monitor or per-subscriber | Flat-rate or transparent tiers |
Pricing for 1-minute checks varies wildly. While industry averages often range between [VERIFY: competitor X entry price] and [VERIFY: competitor Y entry price] per month, the real cost lies in the limitations of the entry tiers. You should evaluate "Data Sovereignty" using this checklist:
- Does the provider offer a choice between EU and US hosting regions?
- Is the data processed in compliance with local regulations like GDPR?
- Can you isolate monitoring traffic to specific geographic nodes to match your user base?
The Total Cost of Monitoring
The "subscriber tax" is a common trap in the monitoring industry. Many incumbents charge per-subscriber fees for your status pages. As your SaaS grows, you're essentially penalized for having a larger customer base. This model forces you to choose between transparent communication and budget management. You can find more on balancing these priorities in our Uptime Monitoring: A Developer’s Guide.
Hidden costs also emerge from per-notification pricing. If a major outage triggers thousands of SMS or PagerDuty alerts, a "pay-per-alert" model can lead to significant budget surprises. Pragmatic uptime monitoring developers prefer flat-rate models that allow for unlimited subscribers and predictable monthly costs. Platforms like StatusPulse offer this transparency, allowing you to scale your incident response without financial friction. This approach ensures your focus remains on resolving the incident, not calculating the cost of the next alert.
Solving the "Flapping" Problem: Signal vs. Noise
Flapping is the enemy of a peaceful on-call rotation. It occurs when a service oscillates between up and down states within a short window. This often results from transient network congestion or aggressive timeout settings rather than a total system failure. For uptime monitoring developers can actually rely on, the system must distinguish between a temporary blip and a sustained outage.
The most effective way to handle this is through "Failure Thresholds." Instead of alerting on the first failed check, configure your monitor to require multiple consecutive failures. This ensures that a single packet loss event doesn't wake up your entire SRE team at 3 AM. Simultaneously, you should implement geo-distributed verification. An outage should only be confirmed if multiple global nodes report a failure at the same time. This filters out localized ISP issues that don't reflect your global service health.
Configuring timeout values also requires a pragmatic approach based on your specific stack. If you are running serverless functions, account for cold-start times in your monitoring latency limits. A 500ms timeout might be too tight for a cold-start, leading to false positives. Match your timeouts to the 99th percentile of your expected application latency.
Configuring Robust Alert Logic
Most production Jamstack or API layers find 1-minute intervals to be the "sweet spot." This frequency provides rapid detection without the excessive log noise of 10 or 30-second checks. Below is an example of a logical configuration for a check with a 3-strike failure threshold.
check_config:
  name: "Production API"
  url: "https://api.example.com/v1/health"
  interval: 60s
  timeout: 5s
  thresholds:
failure: 3
recovery: 2
  regions:
- us-east-1
- eu-central-1
- ap-southeast-1
This setup ensures the service is truly unreachable from multiple regions before an incident is created. Multi-region latency monitoring also allows you to identify if a performance degradation is specific to a single cloud provider's region or a global routing issue.
Managing Alert Fatigue in DevOps Teams
Escalation policies are a core component of a healthy SRE workflow. Not every alert requires an immediate phone call. You can route low-priority latency warnings to a Slack or Discord channel while reserving PagerDuty for sustained outages. This tiered approach keeps the signal-to-noise ratio high and prevents developer burnout.
Maintenance windows are another essential tool. They allow you to silence alerts during scheduled deployments or database migrations. If you know the system will be cycling, there is no reason to trigger an incident. For more strategies on maintaining high-availability endpoints, see our API Monitoring: The Developer’s Guide. By treating alert logic as code, you create a predictable environment where a notification actually means something is broken. This is the foundation of uptime monitoring developers respect.
Automating the Incident Lifecycle with AI
The "Gap of Silence" is the period between when your monitoring detects a failure and when your customers are notified. During an outage, developers are often buried in terminal windows and logs. Communication becomes an afterthought. This delay erodes trust and floods your support inbox with redundant queries. For uptime monitoring developers value, the transition from detection to communication must be automated.
AI incident management can draft technical updates directly from your monitoring logs. Instead of staring at a blank text box while a production database is down, you review a pre-written draft based on the specific failure signatures. It converts a "504 Gateway Timeout" into a human-readable status update. This allows the engineering team to focus on the root cause rather than wordsmithing under pressure. It bridges the gap between raw telemetry and human understanding.
Automating the transition from a failing check to a "Degraded" status on your public page prevents the manual scramble. If a check meets the failure thresholds discussed in the previous section, the system should update the status page immediately. This ensures your customers see the problem before they report it. AI can also summarize technical root causes for non-technical stakeholders, translating complex infrastructure failures into clear business impact statements.
Reducing Communication Overhead
StatusPulse uses AI as a technical assistant. It doesn't publish updates autonomously; it requires a final human action to ensure accuracy and context. This preserves human agency while stripping away the friction of incident reporting. You get the speed of automation with the safety of human oversight. A standard developer-led update should always follow this checklist:
- Impact: Clearly state which services or regions are affected.
- Status: Detail the current stage of the investigation or fix.
- ETA: Provide a timestamp for the next scheduled update.
Public vs. Private Status Pages
Not every blip belongs on a public page. Private status pages serve internal engineering stakeholders, providing deep technical telemetry that might confuse customers. However, maintaining a transparent public page is a proven strategy for reducing churn. When customers see a proactive "Investigating" status, they feel reassured that the team is in control. You can learn more about reducing support tickets via automated status alerts to see how this impacts your bottom line.
Closing the loop between monitoring and communication is the final step in a mature observability strategy. If you're ready to eliminate manual status updates, explore how AI incident management can streamline your on-call workflow.
Why StatusPulse is the Pragmatic Choice for Developers
StatusPulse was built to solve the fragmentation of the modern observability stack. Most teams currently juggle separate tools for uptime monitoring, public status pages, and incident management. This leads to data silos and delayed communication during critical outages. For uptime monitoring developers can actually use, integration must be native rather than bolted on. By unifying these functions, you eliminate the friction between detecting a fault and updating your users.
Data sovereignty is a core virtue of the platform. Unlike many industry incumbents that default to US-based infrastructure, we provide a choice between dedicated EU and US hosting regions. This allows European teams to maintain strict regulatory compliance and data privacy standards without sacrificing monitoring performance. It is a grounded approach that recognizes the technical and ethical importance of geographic hosting in a globalized market.
The pricing model is a direct rejection of corporate bloat and opaque cost functions. We don't charge per-subscriber fees for status pages. You pay a flat, transparent rate that doesn't penalize you for growing your customer base or scaling your communication. There are no hidden "pro" features for essentials like SSL certificate monitoring or multi-region API checks. You get the technical precision you need without the traditional enterprise software tax.
The StatusPulse Advantage
Our approach is characterized by a total lack of marketing hype. We provide reliable, straightforward checks that focus on technical accuracy rather than flashy dashboards. The AI incident management tool acts as a peer for SREs, drafting technical summaries from logs for human approval. It is an assistant that requires a final human action, ensuring you stay in control of the narrative. Setup for SSL and API monitoring takes approximately five minutes, allowing you to secure your endpoints immediately.
Getting Started with StatusPulse
Onboarding is a fast-paced, logical process designed to respect your time. The flow moves you quickly from the problem to a solution. You start by adding your target URL, configuring your failure thresholds as discussed in previous sections, and connecting your status page. This creates a direct path to a fully automated incident lifecycle.
Our support model is developer-first. You speak with specialists who understand the architecture of your stack and the nuances of low-latency monitoring. If you are tired of fragmented tools and complex pricing, it is time for a more principled alternative. Build trust with StatusPulse and streamline your incident response today.
Building a Resilient Observability Strategy
Effective availability management requires moving past basic pings to a granular understanding of the request lifecycle. You've seen how failure thresholds and geo-distributed verification eliminate the noise that plagues most on-call rotations. By automating the transition from detection to incident communication, you close the "gap of silence" and maintain user trust during technical disruptions.
Selecting the right uptime monitoring developers can trust involves aligning technical precision with ethical business practices. StatusPulse provides a choice between EU and US hosting to support your data sovereignty requirements. With AI-powered incident drafting and zero per-subscriber fees, it's a platform built for scale without the bloat of industry incumbents. It's time to move from reactive firefighting to a logical, automated approach to system health.
Start monitoring your stack with StatusPulse and build a more reliable future for your users.
Frequently Asked Questions
What is the difference between uptime monitoring and synthetic monitoring?
Uptime monitoring primarily checks if a service is reachable and responding with a successful status code. Synthetic monitoring goes deeper by simulating user interactions to validate specific application logic. While uptime confirms connectivity, synthetic checks use custom headers and payloads to ensure your API or frontend is actually functional. It allows you to test multi-step flows rather than just pinging an endpoint.
How many monitoring locations are necessary for a global SaaS?
A global SaaS should monitor from at least three to five geographically distributed nodes. This prevents localized network congestion or ISP-specific routing issues from being flagged as a total system failure. For uptime monitoring developers can trust, checking from regions where your user base is concentrated is essential. It provides a realistic view of the latency and availability experienced by your actual customers.
Why should I avoid per-subscriber fees for my status page?
Per-subscriber fees act as a "success tax" that penalizes your business for growing its audience. These models make your monthly costs unpredictable and often discourage transparency when you need it most. Flat-rate pricing is a more ethical alternative. It ensures you can notify your entire customer base during an incident without worrying about the financial impact of your subscriber count.
Can uptime monitoring detect SSL certificate issues before they expire?
Yes, dedicated monitoring tools track the validity dates of your certificates and trigger alerts well before they lapse. This provides your team with a necessary buffer to handle manual renewals or verify automated ACME challenges. Beyond expiry, these checks can also identify misconfigurations in the TLS handshake. This prevents the preventable downtime caused by expired certificates or broken trust chains.
How does an AI incident manager help during a server outage?
An AI incident manager acts as a technical assistant that drafts human-readable updates based on raw monitoring logs. It reduces the "gap of silence" by translating complex failure signatures into clear status updates for stakeholders. This allows developers to remain focused on the root cause fix rather than wordsmithing under pressure. The system requires a final human approval before any update is published.
What is a failure threshold and why does it prevent alert fatigue?
A failure threshold is the number of consecutive failed checks required before an alert is triggered. It prevents alert fatigue by filtering out transient network blips that resolve themselves in seconds. Requiring two or three "strikes" ensures that your on-call rotation only responds to sustained outages. This is a fundamental setting in uptime monitoring developers use to maintain a high signal-to-noise ratio.
Is EU hosting better than US hosting for GDPR compliance?
EU hosting simplifies compliance for organizations subject to GDPR by keeping data processing within the European Economic Area. While US hosting can be compliant under specific frameworks, EU-based infrastructure reduces legal complexity and data transfer risks. Offering a choice between regions allows teams to meet their specific data sovereignty requirements. This ensures technical performance is maintained without compromising on regional privacy standards.


