

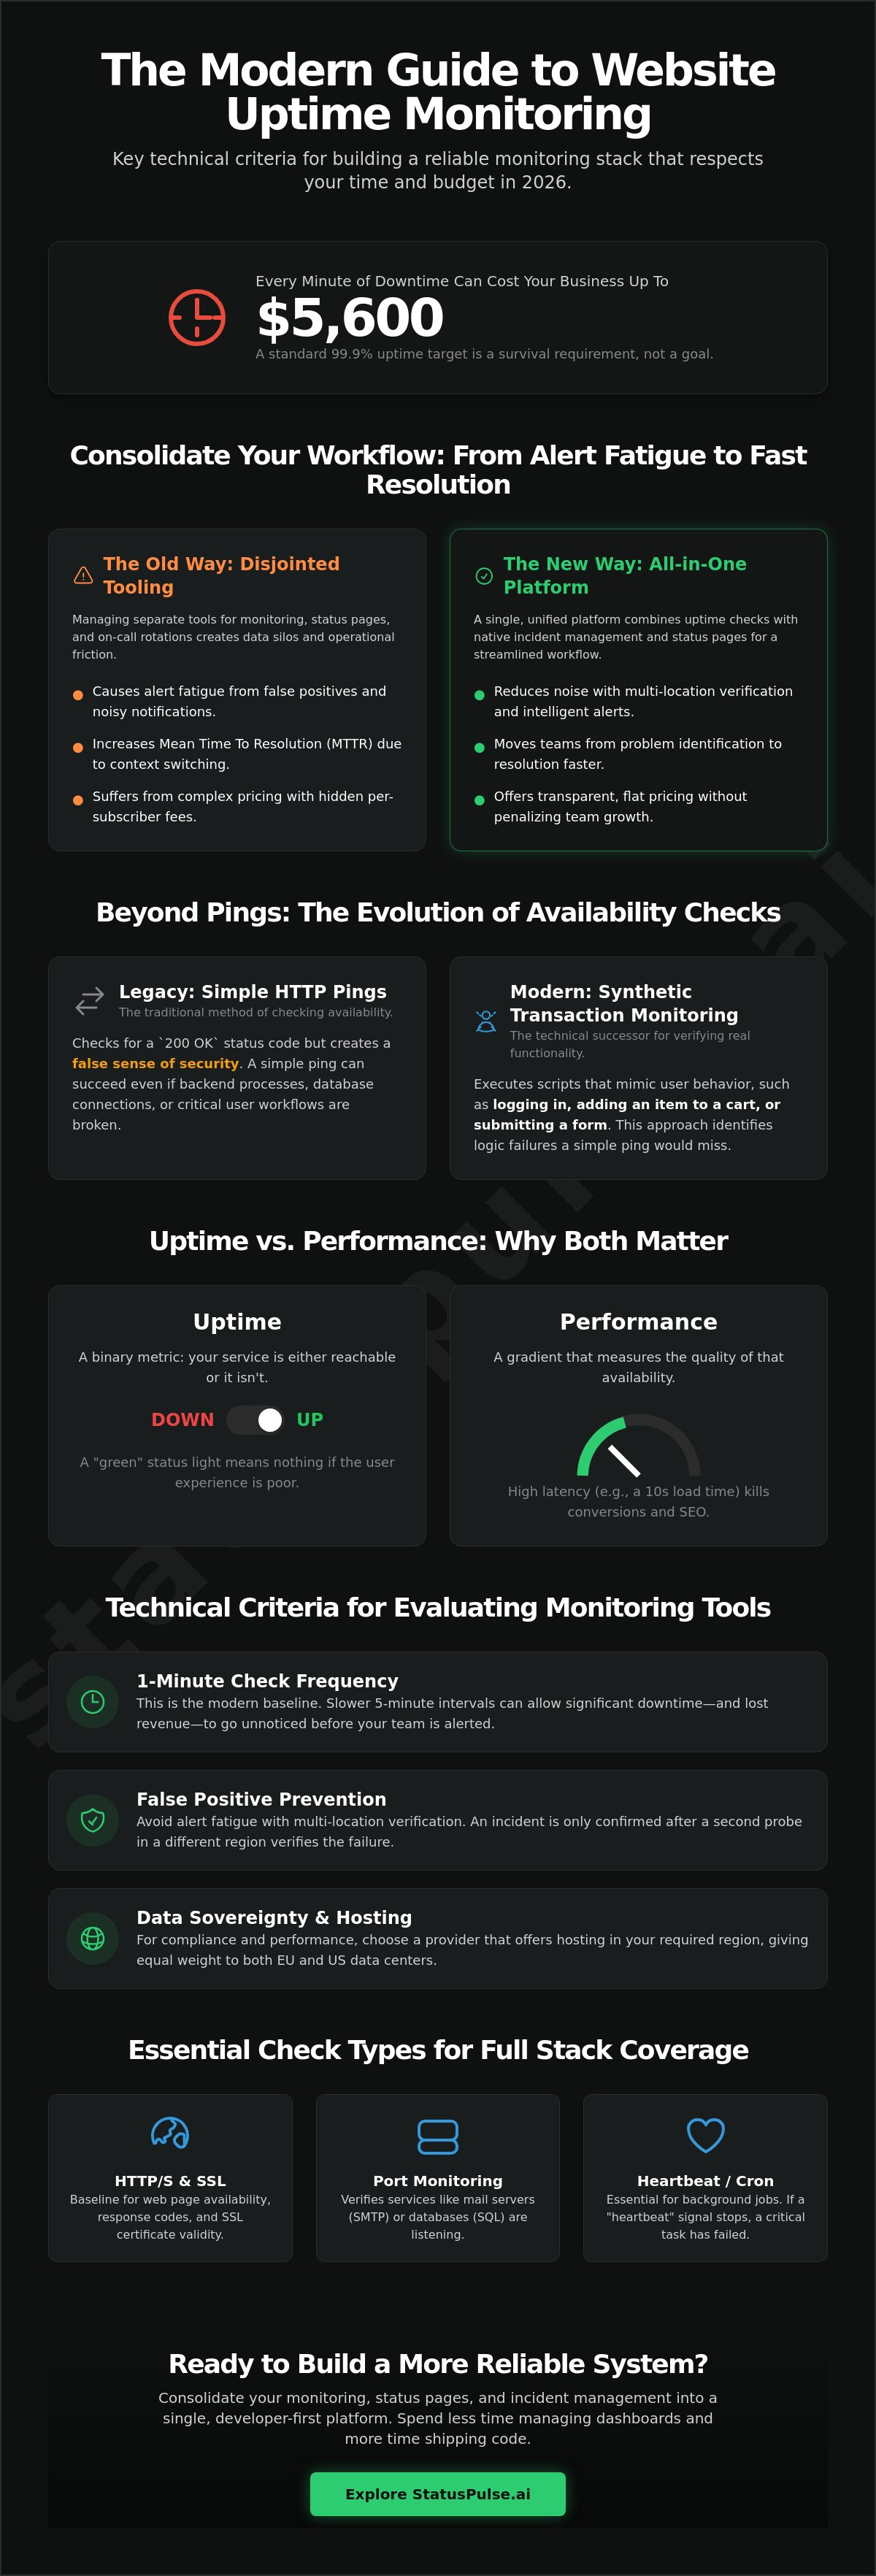
Every minute of downtime can cost your business up to $5,600. It's a staggering figure that makes the standard 99.9% uptime target feel like a survival requirement rather than a goal. Choosing the right website uptime monitoring tools is no longer just about pings; it's about avoiding the alert fatigue and hidden per-subscriber fees that turn a technical incident into a management headache. In 2026, the most reliable tools are those that consolidate monitoring, status pages, and incident management into a single, transparently priced platform.
You likely feel the frustration of managing separate tools for monitoring, status pages, and on-call rotations. This guide compares the best options for 2026 based on technical depth, regional data sovereignty, and incident communication. We'll show you how to build a reliable monitoring stack that respects your time and your budget. We'll also examine how to consolidate your workflow and move quickly from identifying problems to resolving them without the corporate bloat typical of industry incumbents.
Key Takeaways
- Understand the functional differences between simple HTTP pings and synthetic transaction monitoring for verifying site availability.
- Learn why 1-minute check intervals and multi-location verification are the baseline requirements for modern reliability.
- Evaluate the leading website uptime monitoring tools for 2026 based on regional data sovereignty and technical depth.
- Connect your monitoring stack to Slack or PagerDuty using API-driven integrations to automate infrastructure responses.
- Discover how all-in-one platforms reduce downtime by combining uptime checks with native incident management and status pages.
What are Website Performance Monitoring Tools?
To understand What are Website Performance Monitoring Tools?, you must look beyond simple availability. These systems use a network of global probes to simulate user requests from different geographic regions. They verify that your server is reachable and that the content delivered is correct. In 2026, a basic "up or down" status is no longer the standard for reliability. Modern website uptime monitoring tools must provide deep visibility into the entire stack, including the health of your SSL certificates and the responsiveness of your API endpoints.
Simple HTTP pings are the legacy method of monitoring. They check for a 200 OK status code but ignore whether the page actually rendered or if the database connection failed behind the scenes. Synthetic transaction monitoring is the technical successor. It executes scripts that mimic real human behavior, such as logging into a dashboard or adding an item to a cart. This approach identifies logic failures that a simple ping would miss. Relying solely on pings creates a false sense of security while your users encounter broken workflows.
Securing your stack requires constant vigilance over SSL and API health. An expired certificate triggers browser warnings that drive away 100% of your traffic instantly. Similarly, API monitoring ensures that the data layer powering your frontend remains performant. Without these checks, your site might be "up" while your core functionality is completely severed.
Uptime vs. Performance: Why Both Matter
Uptime is a binary metric; your site is either reachable or it isn't. Performance is a gradient that measures the quality of that availability. If your homepage takes 10 seconds to load, it's effectively down for the modern user. High latency kills conversion rates and damages your SEO standing. Search engines prioritize fast, stable sites. A "green" status light in your dashboard means nothing if the underlying latency is causing a mass exodus of users. You need to measure Time to First Byte (TTFB) and full page load times to get the complete picture.
Common Check Types in Modern Monitoring
Effective website uptime monitoring tools utilize several specialized check types to cover the entire infrastructure:
- HTTP/HTTPS Pings: The baseline for checking web page availability and response codes.
- Port Monitoring: Verifies that specific services, such as mail servers (SMTP) or databases (SQL), are listening on the correct ports.
- Heartbeat/Cron Monitoring: Essential for background jobs. Your server sends a "heartbeat" to the monitor; if the signal stops, you know a critical backup or scheduled task has failed.
By combining these methods, teams can move away from reactive firefighting. Tools like StatusPulse integrate these checks into a single view, ensuring that technical teams spend less time managing multiple dashboards and more time shipping code.
Technical Criteria for Evaluating Monitoring Software
Reliability in monitoring isn't just about how often you check a URL. It's about the quality of the data returned. When selecting Technical Criteria for Evaluating Monitoring Software, you should prioritize tools that offer a one-minute check frequency as a baseline. Anything slower, such as five-minute intervals, allows significant downtime to go unnoticed. This delay can result in thousands of dollars in lost revenue before your team even receives a notification.
Effective website uptime monitoring tools must do more than just record a timeout. They need to verify that the failure is real and not a localized network issue. This requires a robust notification stack that integrates with your existing DevOps tools. Whether you use Slack, PagerDuty, or Microsoft Teams, the alert should contain enough context to begin debugging immediately. This includes response headers, traceroute data, and the specific error code returned by the server.
The False Positive Problem: Double-Check Logic
False positives are the primary cause of alert fatigue. If your monitoring system "cries wolf" too often, your team will eventually ignore the alerts. Professional tools solve this by using multi-location verification. When a probe in London detects a failure, the system immediately triggers a second check from a different region, like Frankfurt or New York. An incident is only created if both locations agree that the site is unreachable. This logic filters out transient blips and ensures your on-call engineers are only woken up for genuine outages.
Data Sovereignty and Hosting Regions
For many developers, where the monitoring data lives is as important as the monitoring itself. EU-based companies often face strict regulatory requirements that make US-only hosting a compliance risk. You should look for website uptime monitoring tools that allow you to choose your data residency. Hosting your monitoring data in the same region as your users reduces latency in your checks and simplifies your GDPR documentation. While global coverage is important for testing reachability, regional privacy focus ensures you aren't accidentally exporting sensitive metadata across borders.
If you're looking for a platform that respects these technical requirements without the complexity of enterprise bloat, StatusPulse offers both EU and US hosting options to support your data sovereignty needs.
Top Website Uptime Monitoring Tools for 2026
The market for website uptime monitoring tools in 2026 is defined by a clear divide. Legacy providers offer massive infrastructure, while modern platforms focus on developer experience and integrated workflows. Choosing the right tool requires balancing the breadth of the probe network against the cost of managing multiple, disconnected services. Reliability now depends on how efficiently your team can transition from an alert to a resolution.
| Tool | Best For | Key Strength | Notable Weakness |
|---|---|---|---|
| Site24x7 | Broad Infrastructure | Extensive check types | Complex UI/UX |
| Pingdom | Large Enterprise | Deep RUM analytics | Fragmented pricing |
| Hyperping | Startups | Fast setup | Limited advanced alerting |
| StatusPulse | SREs & DevOps | All-in-one native incident management | Smaller probe network |
The Established Incumbents: Site24x7 and Pingdom
Site24x7 is a comprehensive option for teams managing hybrid infrastructure. Its strength lies in the variety of monitors available, ranging from basic pings to deep server metrics. However, the interface often feels cluttered and follows an older enterprise design philosophy. For teams that value speed, navigating their complex dashboard during an outage can be a significant hurdle. Pricing for their entry-level plans [VERIFY: Site24x7 entry price] can scale quickly as you add more monitors or shorter check intervals.
Pingdom remains a standard for high-traffic enterprises that require detailed Real User Monitoring (RUM). It offers a massive global network that provides highly granular latency data. The trade-off is the lack of native incident management integration. You often have to pay for separate services to handle on-call rotations or status pages. This fragmentation leads to higher total costs and slower response times when every second counts during a technical disruption.
Specialized Tools for SREs and Developers
Hyperping represents the modern shift toward simplicity. It combines monitoring, on-call scheduling, and status pages into a single subscription. This reduces tool sprawl and provides a cleaner experience for smaller teams. While it is efficient for standard web applications, it may lack the technical depth required for complex, multi-layered API monitoring. Their flat rate [VERIFY: Hyperping entry price] is attractive for startups, but larger teams might find the alerting logic less flexible than enterprise-grade alternatives.
We built StatusPulse to provide a principled alternative to these two extremes. Most website uptime monitoring tools treat incident communication as an afterthought. We integrate monitoring with AI-powered incident drafting to help you update users without the "blank page" panic. We offer a choice between EU or US hosting to support your data sovereignty. Our platform avoids per-subscriber fees on status pages, ensuring your costs remain predictable even as your user base grows.
Integrating Monitoring into Your DevOps Stack
Monitoring shouldn't exist as an isolated silo. It needs to feed directly into the platforms where your team already spends their time. Most website uptime monitoring tools provide basic webhooks, but a mature DevOps stack requires deeper bi-directional communication. You should route alerts to Slack for immediate visibility, PagerDuty for critical on-call response, or Microsoft Teams for broader organizational alignment. This ensures that the right engineer is notified based on the specific severity of the check failure.
An API-first approach allows you to treat your monitoring configuration as code. Instead of manually adding monitors in a dashboard, you can automate their creation via CI/CD pipelines. This is useful when deploying new microservices or managing ephemeral environments. OpenTelemetry has emerged as the industry standard for vendor-neutral observability data. It provides a common specification for collecting traces, metrics, and logs across different tools and providers, ensuring you aren't locked into a single ecosystem.
API and SSL Monitoring Best Practices
Monitoring authenticated endpoints presents a specific security challenge. You must verify functionality without exposing sensitive credentials in your monitoring configuration. Best practices involve using secure environment variables or vault integrations for API keys. For a deeper look at these technical requirements, read our API Monitoring Guide. It covers how to maintain high availability without compromising your security posture.
SSL certificate monitoring is equally vital for maintaining trust. A "Connection Not Private" error is often the result of simple administrative oversight. Automating these alerts to trigger 30 days before expiry gives your team enough time to rotate certificates. This prevents the sudden traffic drops associated with browser security warnings. Integrating these checks into your standard website uptime monitoring tools workflow reduces the number of disparate systems you need to track.
Leveraging OpenTelemetry for Better Visibility
Vendor lock-in is a significant risk for any long-term monitoring strategy. If your data is trapped in a proprietary format, switching to a more cost-effective provider becomes a massive migration project. OpenTelemetry standardizes how metrics and traces are exported. This allows you to swap backends without rewriting your instrumentation. You can explore how this impacts your stack in our guide to OpenTelemetry.
If you're looking to simplify your current setup, you can start monitoring with StatusPulse to unify your uptime, API, and SSL checks into a single, developer-friendly interface that respects your data sovereignty.
StatusPulse: Uptime Monitoring with Native Incident Management
The real work begins after the monitor fails. Most website uptime monitoring tools alert your team but leave you to manage the fallout manually. This creates a stressful gap between identifying a failure and communicating it to your users. We built StatusPulse to close this gap by integrating uptime monitoring with native incident management and public status pages. It's a single platform designed to handle the technical check and the human communication that follows.
Fragmentation in your DevOps stack leads to delays. When an outage occurs, your engineers shouldn't have to log into three different dashboards to update stakeholders. By consolidating these functions, we ensure that your response is as fast as your detection. This approach prioritizes developer time and reduces the cognitive load during critical incidents. It's a fair alternative to the bloated, multi-tool workflows that define the current industry landscape.
Automating Incident Communication
During an outage, your technical team should focus on the fix, not on drafting status updates. StatusPulse uses AI-driven incident drafting to generate technical summaries for your end-users. It analyzes the error codes and latency data from the failed check to suggest clear updates. This reduces the "blank page" problem that often delays communication during high-pressure situations.
Linking your monitoring directly to status page automation ensures transparency without manual intervention. When a monitor confirms an outage from multiple regions, the status page updates based on your predefined rules. This proactive approach significantly reduces support ticket volume. Users see the issue is acknowledged before they feel the need to report it themselves. It builds trust through honesty rather than hidden metrics.
Transparent Pricing and Data Sovereignty
Industry incumbents often use "per-subscriber" fees for public status pages. This model penalizes you for growing your user base or having a successful product. We believe in ethical, flat pricing. You pay for the monitoring and the page, regardless of how many people sign up for updates. It's a predictable cost structure that avoids the "success tax" found in traditional enterprise software. We don't hide our costs behind "contact sales" buttons or complex tiers.
Data residency is not a marketing afterthought. You can choose to host your monitors and data in either the EU or the US. This flexibility ensures you meet regional compliance standards without sacrificing performance. You can visit StatusPulse to see our honest pricing model and start building a more resilient communication strategy. It's straightforward software for teams that value precision and data sovereignty.
Building a Resilient Monitoring Strategy for 2026
Reliability requires more than just availability checks. It demands high-precision data, multi-region verification, and strict adherence to data sovereignty. The landscape of website uptime monitoring tools is shifting. Teams are moving away from fragmented legacy systems toward unified platforms that respect both their time and their budgets. By prioritizing OpenTelemetry standards and automated incident communication, you can significantly reduce the cognitive load on your engineers during critical outages.
Integrity in pricing and data residency should be the industry standard. We provide both EU and US hosting options alongside AI-powered incident management to ensure your technical response is as fast as your detection. Our model eliminates per-subscriber fees, allowing you to scale your communication without financial penalties. It's about providing the technical depth you need without the corporate bloat you don't.
Start monitoring with StatusPulse; no hidden fees, just reliability.
Build with confidence and keep your users informed.
Frequently Asked Questions
What is the difference between uptime and performance monitoring?
Uptime measures binary availability; your site is either reachable or it isn't. Performance monitoring tracks the quality of that connection through metrics like latency and Time to First Byte (TTFB). A site can be technically "up" while being so slow that users cannot complete a transaction. Measuring both ensures your infrastructure is reachable and responsive enough to meet modern user expectations.
How do website monitoring tools reduce false positives?
Professional website uptime monitoring tools use multi-location verification to filter out transient network blips. If a probe in London detects a failure, the system immediately triggers a second check from a different region, such as Frankfurt or New York. An alert is only sent if both locations confirm the outage. This logic prevents alert fatigue by ensuring your team only responds to genuine service disruptions.
Why should I monitor SSL certificates separately from uptime?
Uptime checks only verify the HTTP response code, while SSL monitoring tracks certificate expiration dates and chain validity. An expired certificate triggers browser security warnings that block 100% of your traffic instantly. Dedicated SSL alerts provide your team with a 30-day lead time to rotate certificates. This prevents the sudden reputation damage and traffic loss caused by simple administrative oversights.
What are the benefits of EU-based hosting for monitoring tools?
EU-based hosting ensures your metadata remains within European jurisdiction, which simplifies GDPR compliance and supports data sovereignty. It also reduces latency for checks targeting European data centers. By choosing between EU or US hosting, you can align your monitoring stack with your specific regulatory requirements. This avoids the legal complexities of exporting sensitive technical data across international borders.
How many monitoring locations do I really need for a global site?
You typically need 3 to 5 strategic monitoring locations rather than dozens of redundant probes. Covering major regions like North America, Europe, and Asia-Pacific provides a comprehensive view of global reachability. Excessive locations often create unnecessary noise and higher costs without adding actionable value. Focus your monitoring nodes where your primary user base is concentrated to ensure the most relevant performance data.
Can website monitoring tools track API endpoint performance?
Yes, modern tools track API performance by measuring response times and verifying specific JSON or XML payloads. This ensures the data layer powering your application is returning correct information. Monitoring authenticated endpoints requires secure handling of API keys to prevent exposure. This practice identifies backend failures that a standard homepage uptime check would miss, protecting your entire service architecture.
What is the cost of not having a public status page during an outage?
The primary cost is a massive spike in support tickets and a rapid loss of user trust. A public status page acts as a central source of truth that acknowledges the issue before users feel the need to report it. Without one, your engineers spend valuable time answering emails instead of fixing the root cause. Transparency during downtime demonstrates professional reliability and reduces organizational stress.
How does AI help in incident management for DevOps teams?
AI assists DevOps teams by drafting technical incident updates based on real-time data from website uptime monitoring tools. It helps overcome the "blank page" problem during high-stress outages by suggesting clear language for status pages. This allows your team to focus on the technical resolution while the AI handles the initial communication draft. It serves as a technical assistant that streamlines the transition from detection to public acknowledgment.


