

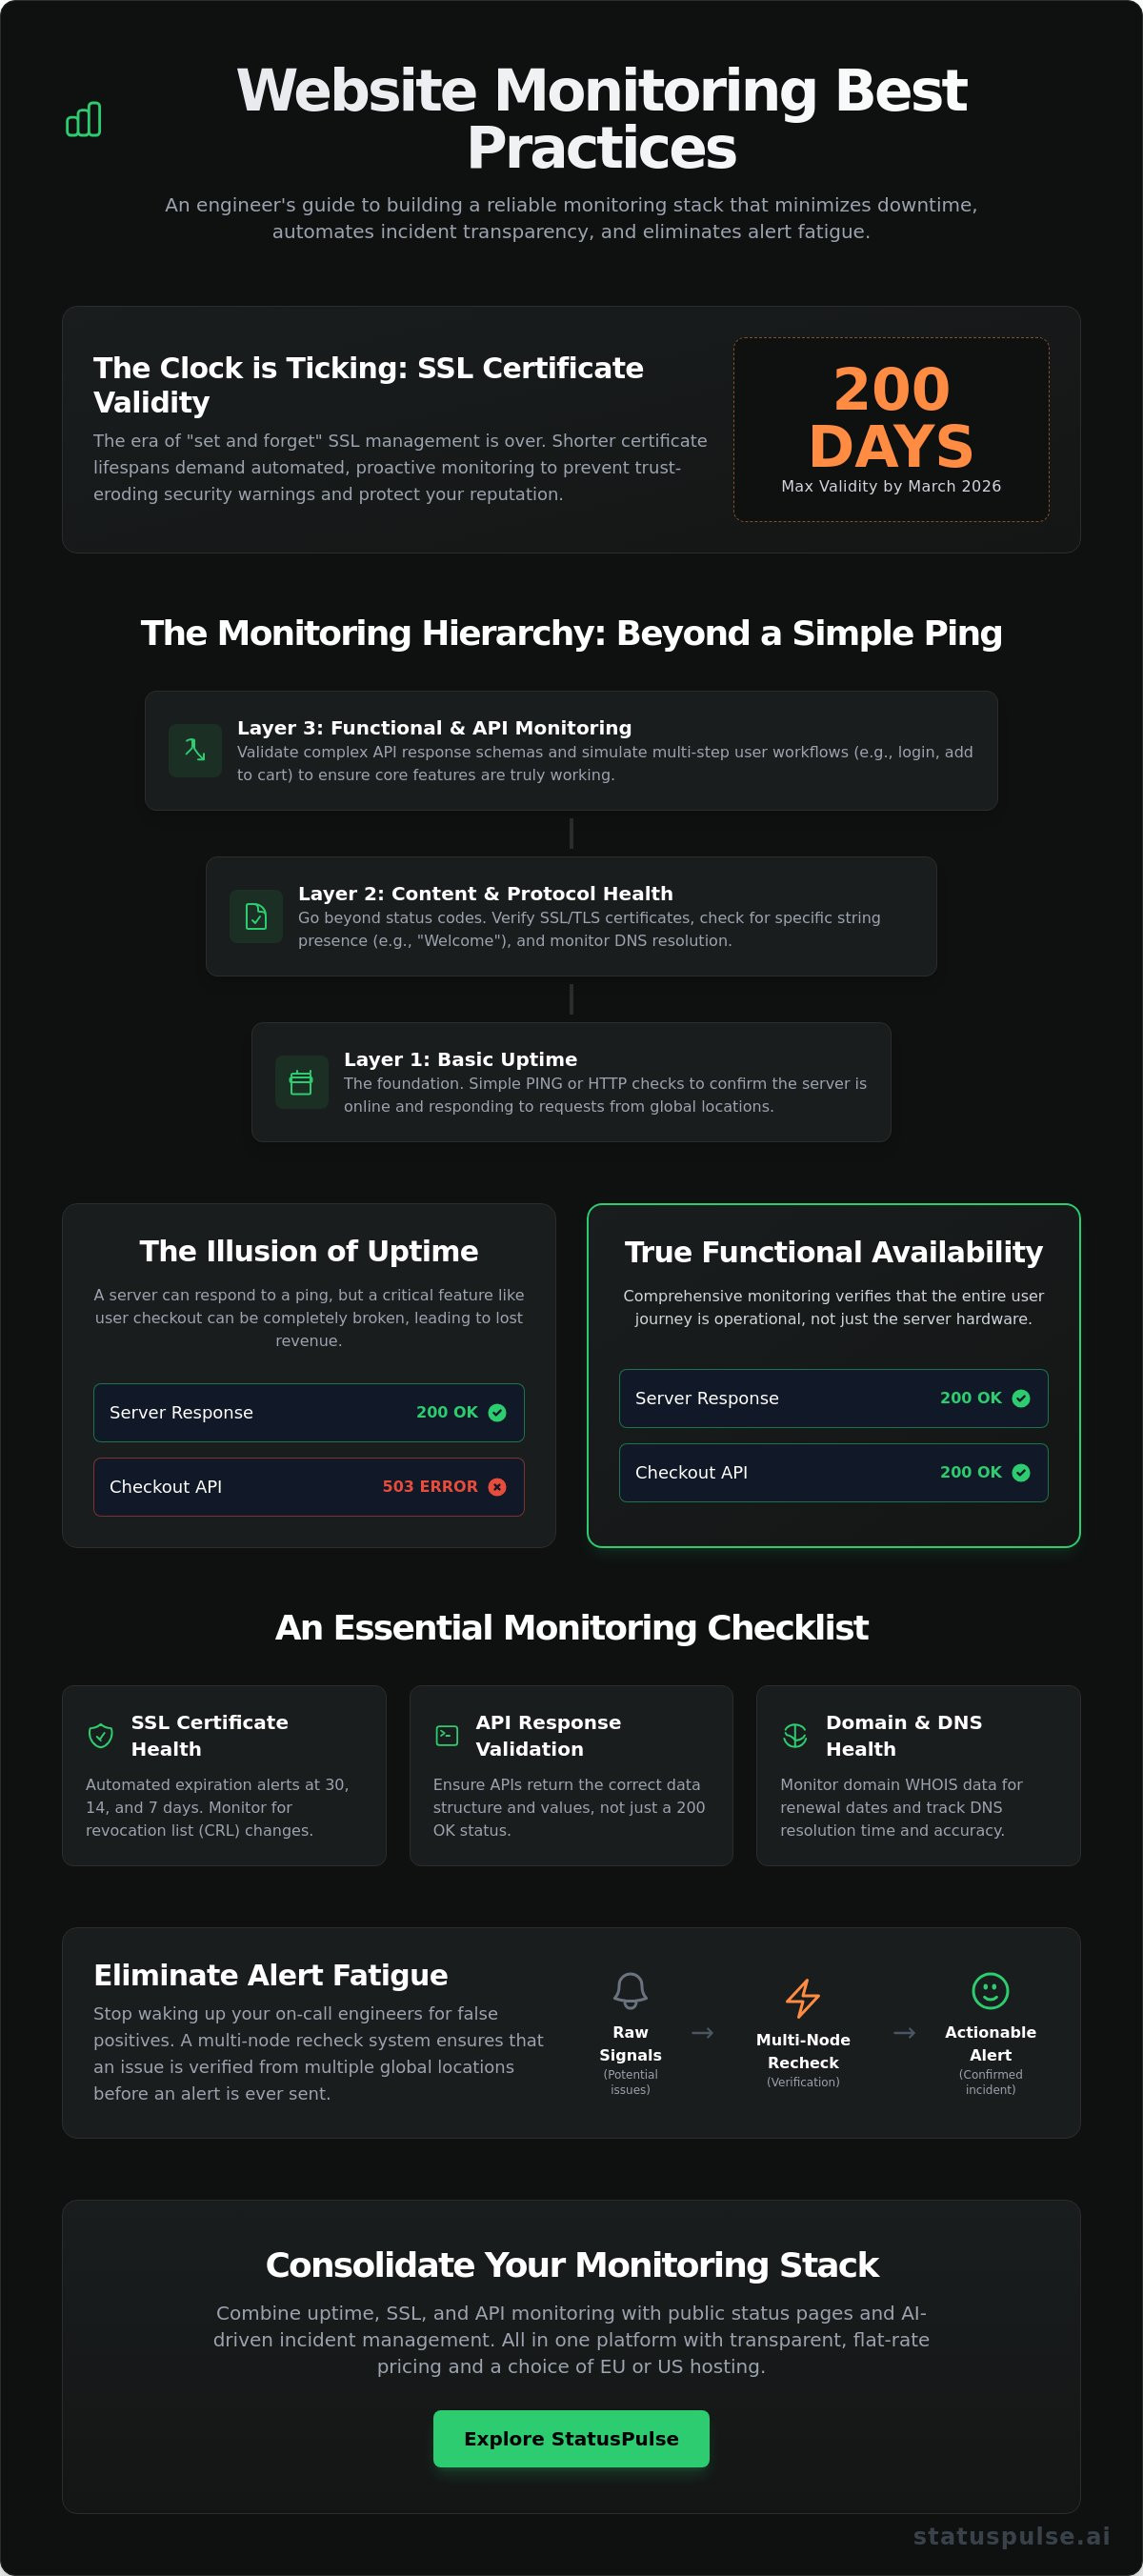
Your SSL certificate is now a ticking clock with a shorter fuse than ever. As of March 15, 2026, the maximum validity for new certificates dropped to just 200 days. This shift proves that the old ways of "set and forget" are over. Implementing website monitoring best practices is no longer optional for teams that value uptime and integrity. You need a system that works as hard as you do without the corporate bloat or noisy, useless alerts.
We know the frustration of manual status page updates during a crisis and the dread of an avoidable outage caused by a forgotten renewal. You deserve a strategy that prioritizes precision over volume. This guide provides the architectural and operational standards for uptime, API, and SSL monitoring that minimize downtime and automate incident transparency. We will walk through how to build a reliable monitoring stack that keeps your customers informed and your engineers focused on building, not firefighting.
Key Takeaways
- True uptime is more than a binary ping check. Learn to monitor functional workflows to catch broken site features before your customers do.
- Modern website monitoring best practices require a layered defense. We cover how to automate SSL expiration tracking and validate complex API response schemas.
- Eliminate alert fatigue and false positives. Use multi-node recheck logic to ensure your team only responds to verified, actionable incidents.
- Transparency builds trust and reduces support volume. Discover how public status pages automate communication during outages to keep users informed without manual effort.
- Efficiency starts with the right stack. Consolidate your monitoring into a single, straightforward system with fair and predictable costs.
The Monitoring Hierarchy: Beyond Simple Ping Checks
Website monitoring is the automated process of verifying your site's availability, performance, and security. It's the heartbeat of your digital presence. But simple uptime is just the start. Many teams fall into the trap of binary thinking. They assume that if the server responds, the site is fine. This is a dangerous mistake. A site can be "up" while the checkout button is completely broken. True reliability requires a deeper look into the stack.
Implementing website monitoring best practices means moving beyond surface-level checks. You need a layered strategy. This includes uptime checks, API validation, SSL monitoring, and domain health. Each layer protects a different part of the user journey. For modern businesses that use Ommni to manage large-scale retail operations, ensuring every layer of the digital storefront is functional is critical to success. Traditional industry giants often overcomplicate this hierarchy to justify bloated pricing. We prefer a grounded approach. You need precision, not noise. By monitoring every layer, you ensure that "online" actually means "functional."
| Feature | Synthetic Monitoring | Real User Monitoring (RUM) |
|---|---|---|
| Strategy | Proactive simulations | Passive observation |
| Best For | Establishing performance baselines | Understanding actual user experience |
| Use Case | Catching errors before users do | Analyzing device and browser performance |
| Consistency | High (fixed environment) | Low (variable user conditions) |
Synthetic Monitoring for Predictability
Synthetic checks act as your early warning system. They simulate user interactions from diverse global locations. This helps establish a solid performance baseline. You aren't just checking for a 200 OK status code. You're looking for specific string presence on the page to ensure the content actually loaded. If your database fails but your web server stays up, a basic check might pass. Looking for a "Welcome" string or a price tag ensures the page is useful. For business-critical endpoints, schedule these checks at 1-minute intervals. It's the only way to catch intermittent failures before they impact your reputation.
Uptime vs. Functional Availability
A server responding to a PING doesn't mean your application is healthy. It just means the hardware is powered on. Functional availability is what matters to your customers. True website monitoring best practices require monitoring the full request path. This includes DNS resolution and TLS handshakes. Use uptime monitoring to track global latency trends and identify regional bottlenecks. If your DNS provider has a localized outage in Europe, your US-based checks might stay green while your global traffic drops. You need to see the whole picture to maintain a truly reliable service.
Layered Observability: SSL, API, and Infrastructure
A single green light on a dashboard is often a lie. Real reliability comes from layered observability. You need to look beneath the surface of your homepage to the protocols and integrations that keep your business running. This approach is central to website monitoring best practices in a world where microservices and short-lived certificates are the norm. If your SSL expires or an API schema changes, your site is effectively down for your users; it doesn't matter what your server status says.
Data sovereignty and latency accuracy depend entirely on where your monitoring lives. Distributing nodes across both EU and US regions is critical. It ensures you respect local privacy standards while getting an honest look at regional performance. A US-based monitor might miss a routing issue that blocks your German customers. We believe in providing this geographic precision without the unnecessary complexity of corporate bloat. It's about getting the right data from the right places to protect your global reputation.
Automating SSL and Domain Health
SSL certificate monitoring is your first line of defense against "Connection Not Private" warnings. These errors kill conversion rates instantly. With certificate lifespans shrinking to 200 days as of March 2026, manual tracking is a recipe for disaster. You need a system that alerts you at 30, 14, and 7 days before expiration. This gives your team plenty of time to act. Don't just check the date. Monitor for CRL (Certificate Revocation List) changes. Verify your domain WHOIS data too. A forgotten domain renewal is a high-impact failure that's entirely preventable with a simple, automated safety net.
Synthetic API Monitoring
Your site likely relies on a dozen different APIs to function. If Stripe or Twilio fails, your checkout or notifications die. API monitoring must go beyond simple connectivity. You need to test POST and GET requests with specific payloads. Validate that the JSON schemas are correct and response times stay within your defined limits. A slow API is often worse than a dead one because it hangs your UI and frustrates users. For a deeper look at setting up these checks across different regions, refer to our API monitoring guide. It's a straightforward way to ensure your integrations remain stable assistants rather than liabilities. You can start building a more resilient stack today by exploring our uptime and API tools.
Alerting Best Practices: Reducing Noise and Fatigue
Noise kills productivity. False positives are the primary enemy of a reliable monitoring system. When your phone buzzes at 3 AM for a two second network hiccup, the system has failed you. One of the core website monitoring best practices is implementing strict recheck logic. Never alert on a single failure. A single node in Virginia might see a timeout while London and Tokyo see a perfect response. This is often a localized routing issue, not a site outage. Only trigger an incident if two or three geographically distinct nodes confirm the failure. This simple step preserves your team's sanity and ensures that every alert is real and actionable.
Integrity in monitoring means treating your engineers' time with respect. You must map every alert to a specific severity level. Not every issue is a fire. A 10% increase in latency is a Warning. A total checkout failure is Critical. By categorizing these, you prevent alert fatigue. This is a common symptom of corporate bloat where every minor blip is treated as a catastrophe. We believe in a more surgical approach. Use automation to filter the noise so you can focus on the signals that actually impact your bottom line.
Thresholds vs. Baselines
Arbitrary numbers are lazy. A 500ms response time is excellent for a complex API call but unacceptable for a static CSS file. Instead of picking round numbers, look at your historical baselines. Calculate the standard deviation from your mean response times. This allows your system to detect actual anomalies rather than just hitting a ceiling. Review these thresholds quarterly. Your application changes; your monitors should too. Adopting these website monitoring best practices ensures your alerts evolve alongside your code.
Alert Routing and Runbooks
Where an alert goes is as important as why it fired. Route critical failures to PagerDuty or a dedicated Slack channel for immediate eyes. Send minor warnings, like a certificate expiring in 30 days, to email. Every alert must be a starting point, not a dead end. Include a link to a runbook or an internal wiki page in every notification. This gives the responder a clear path to resolution without searching through old documentation. It turns a monitoring tool into a focused assistant. Avoid "all-hands" notifications for non-critical issues. It's about precision and respecting human focus.
Incident Communication: The Role of Public Status Pages
Detection is only half the battle. If your monitoring system identifies a failure but your customers are left in the dark, you've only solved a technical problem, not a business one. This is where many teams fail to follow website monitoring best practices. They focus entirely on the backend and ignore the human element. A public status page is the bridge between a system failure and customer trust. It transforms a frustrating outage into a managed event. Silence during a crisis suggests incompetence; transparency signals control.
Proactive communication pays direct dividends. Some industry professionals report that a visible status page can reduce support ticket volume by up to 50% during an active incident. Instead of overwhelming your help desk, you provide a single source of truth. You should automate the transition from "Operational" to "Investigating" on your public page. The moment your multi-node recheck confirms a failure, the page should update. This immediate response buys your engineering team time to find the root cause without the pressure of a rising ticket count.
Structuring a Public Status Page
A good status page is granular. Don't just show a single "All Systems Operational" checkmark. Breakdown your infrastructure into components like the API, web portal, and database. Show historical uptime percentages for each. This builds long-term credibility by proving your overall reliability. Always provide a clear "Subscribe to Updates" option. Perhaps most importantly, host your status page on a completely separate infrastructure. If your primary cloud provider has a regional outage, your status page must remain online to tell the story. It's a simple architectural choice that prevents total communication blackouts.
AI-Assisted Incident Management
Technical teams often struggle to find the right words during a high-pressure crisis. Log data is dense and difficult for customers to understand. AI can act as a useful assistant here by summarizing raw technical logs into human-readable updates. This ensures your communication is clear, calm, and consistent. However, human agency remains the anchor of this process. AI should draft the summaries, but a human must always provide the final approval before anything goes live. This keeps your brand voice authentic and prevents automated errors from making a bad situation worse. You can start building this level of transparency today with our automated public status pages. It's a straightforward way to turn technical disruptions into opportunities for trust.
Choosing a Monitoring Stack: StatusPulse Approach
Selecting the right tool is the final step in mastering website monitoring best practices. Most industry incumbents rely on corporate bloat and complex pricing models. They often charge a "per-subscriber" tax that punishes you for growing your audience or being transparent. We believe this is unethical. StatusPulse offers a different path. Our platform integrates uptime, SSL, and API monitoring with native status pages in one straightforward interface. It's built for teams who value precision over flashy marketing features. By unifying these layers, you bridge the gap between a technical failure and customer trust without the headache of managing multiple vendors.
Efficiency shouldn't come at the cost of control. Our AI incident management tools function as dedicated assistants rather than autonomous black boxes. They analyze your technical logs and draft human-readable summaries during a crisis. This allows your engineers to focus on the fix while the AI handles the initial communication draft. You always provide the final approval. This approach respects human agency and ensures your brand voice remains authentic even when things go wrong. It's a logical, fast-paced solution for modern technical teams.
Technical Credibility and Data Sovereignty
StatusPulse is built by specialists for specialists. We understand that where your data lives matters as much as how it's monitored. We offer dedicated hosting options in both EU and US regions to meet your specific regulatory and performance needs. For European enterprises, this means GDPR-compliant hosting is a core virtue, not an afterthought. Configuration takes minutes, not hours. The UI is clean and declarative, reflecting our promise of simplicity. We provide the high-level technical precision you need to establish professional authority without the unnecessary complexity of traditional enterprise software.
Next Steps for Reliability
Mastering website monitoring best practices requires a proactive mindset. Your first step is to audit your current coverage. Are you monitoring the full request path, or just simple pings? Ensure your SSL tracking is automated to handle the 200-day validity standards that took effect in March 2026. If you're still updating status pages manually during a crisis, it's time for a change. Implement a unified strategy that prioritizes layered checks and automated transparency. You can explore StatusPulse for unified monitoring and communication today. It's a reliable, straightforward way to protect your uptime and your reputation.
Building a Resilient Infrastructure for 2026
Reliability is a choice. It's the result of combining technical precision with honest communication. We've explored how to move beyond simple pings to a layered defense that includes API validation and automated SSL tracking. Adopting these website monitoring best practices turns technical failures into managed incidents rather than reputational disasters. You don't need complex pricing or faceless corporate tools to protect your uptime. You need a system that respects your time and your users' trust.
StatusPulse is built for teams who value integrity and simplicity. We offer flat, transparent pricing and geographic hosting in both the EU and US to meet your regulatory needs. Our integrated AI incident management acts as your assistant; it helps you maintain transparency when it matters most. It's time to move away from noisy monitors and corporate bloat. Start monitoring with StatusPulse today to build a more resilient digital presence. Your users deserve a platform that stays online and keeps them informed. You've got this.
Frequently Asked Questions
What is the difference between synthetic and real user monitoring?
Synthetic monitoring uses automated scripts to simulate user behavior from global nodes. Real user monitoring (RUM) captures data from actual visitor sessions in real time. Use synthetic checks to establish a performance baseline and catch errors before users arrive. RUM is better for understanding how specific browsers or devices behave in the wild. Both are necessary for a complete observability strategy.
How often should I check my website uptime?
You should check your website uptime every 60 seconds for all business-critical endpoints. High-frequency monitoring ensures you catch intermittent network hiccups or server flaps that 5-minute checks might miss. For marketing pages or low-traffic blogs, 5-minute intervals are usually sufficient. Consistency is key to building a reliable historical uptime record for your stakeholders and customers.
Why do I need a public status page if I have internal alerts?
Internal alerts are for your engineers; public status pages are for your customers. Providing a transparent view of your system health builds long-term credibility. It also stops your support desk from being buried under identical tickets during a crisis. Transparency is a competitive advantage that separates principled teams from faceless corporations. It turns a technical failure into a managed event.
Can AI really help in incident management?
AI helps by translating dense technical log data into clear, human-readable incident summaries. During a major outage, your engineers should focus on the fix, not on copywriting. AI acts as a communication assistant to draft updates for your status page. A human must always review and approve these drafts before they go live to maintain integrity and ensure the brand voice remains authentic.
How do I prevent false positive alerts?
Prevent false positives by implementing multi-node recheck logic. A single network glitch in one region shouldn't wake up your entire team. Only trigger a critical alert if multiple geographically distinct nodes confirm the failure. This is one of the most effective website monitoring best practices for reducing alert fatigue and preserving your team's focus for issues that actually require human intervention.
What is the cost of an SSL certificate outage?
An SSL outage kills your conversion rate by showing scary browser warnings to every visitor. These "Connection Not Private" errors destroy trust instantly. Beyond lost sales, your search engine rankings can suffer from extended downtime. Automation is the only reliable way to manage the 200-day certificate lifespans that became the standard in March 2026. Manual tracking is no longer a viable strategy.
Does website monitoring affect site performance?
Standard uptime and API monitoring do not affect your site's performance. These checks are lightweight HTTP requests that simulate a single user visit. They don't place a meaningful load on your server or slow down actual customers. Following website monitoring best practices ensures you get the data you need without impacting the very speed you are trying to measure for your end users.
Is EU or US hosting better for my monitoring nodes?
The best choice is a distributed approach using both EU and US hosting nodes. EU-based nodes are critical for GDPR compliance and testing local European latency. US nodes provide an accurate baseline for your North American traffic. Using both regions ensures you have a global perspective on your site health while respecting regional data sovereignty standards and improving latency accuracy.


