

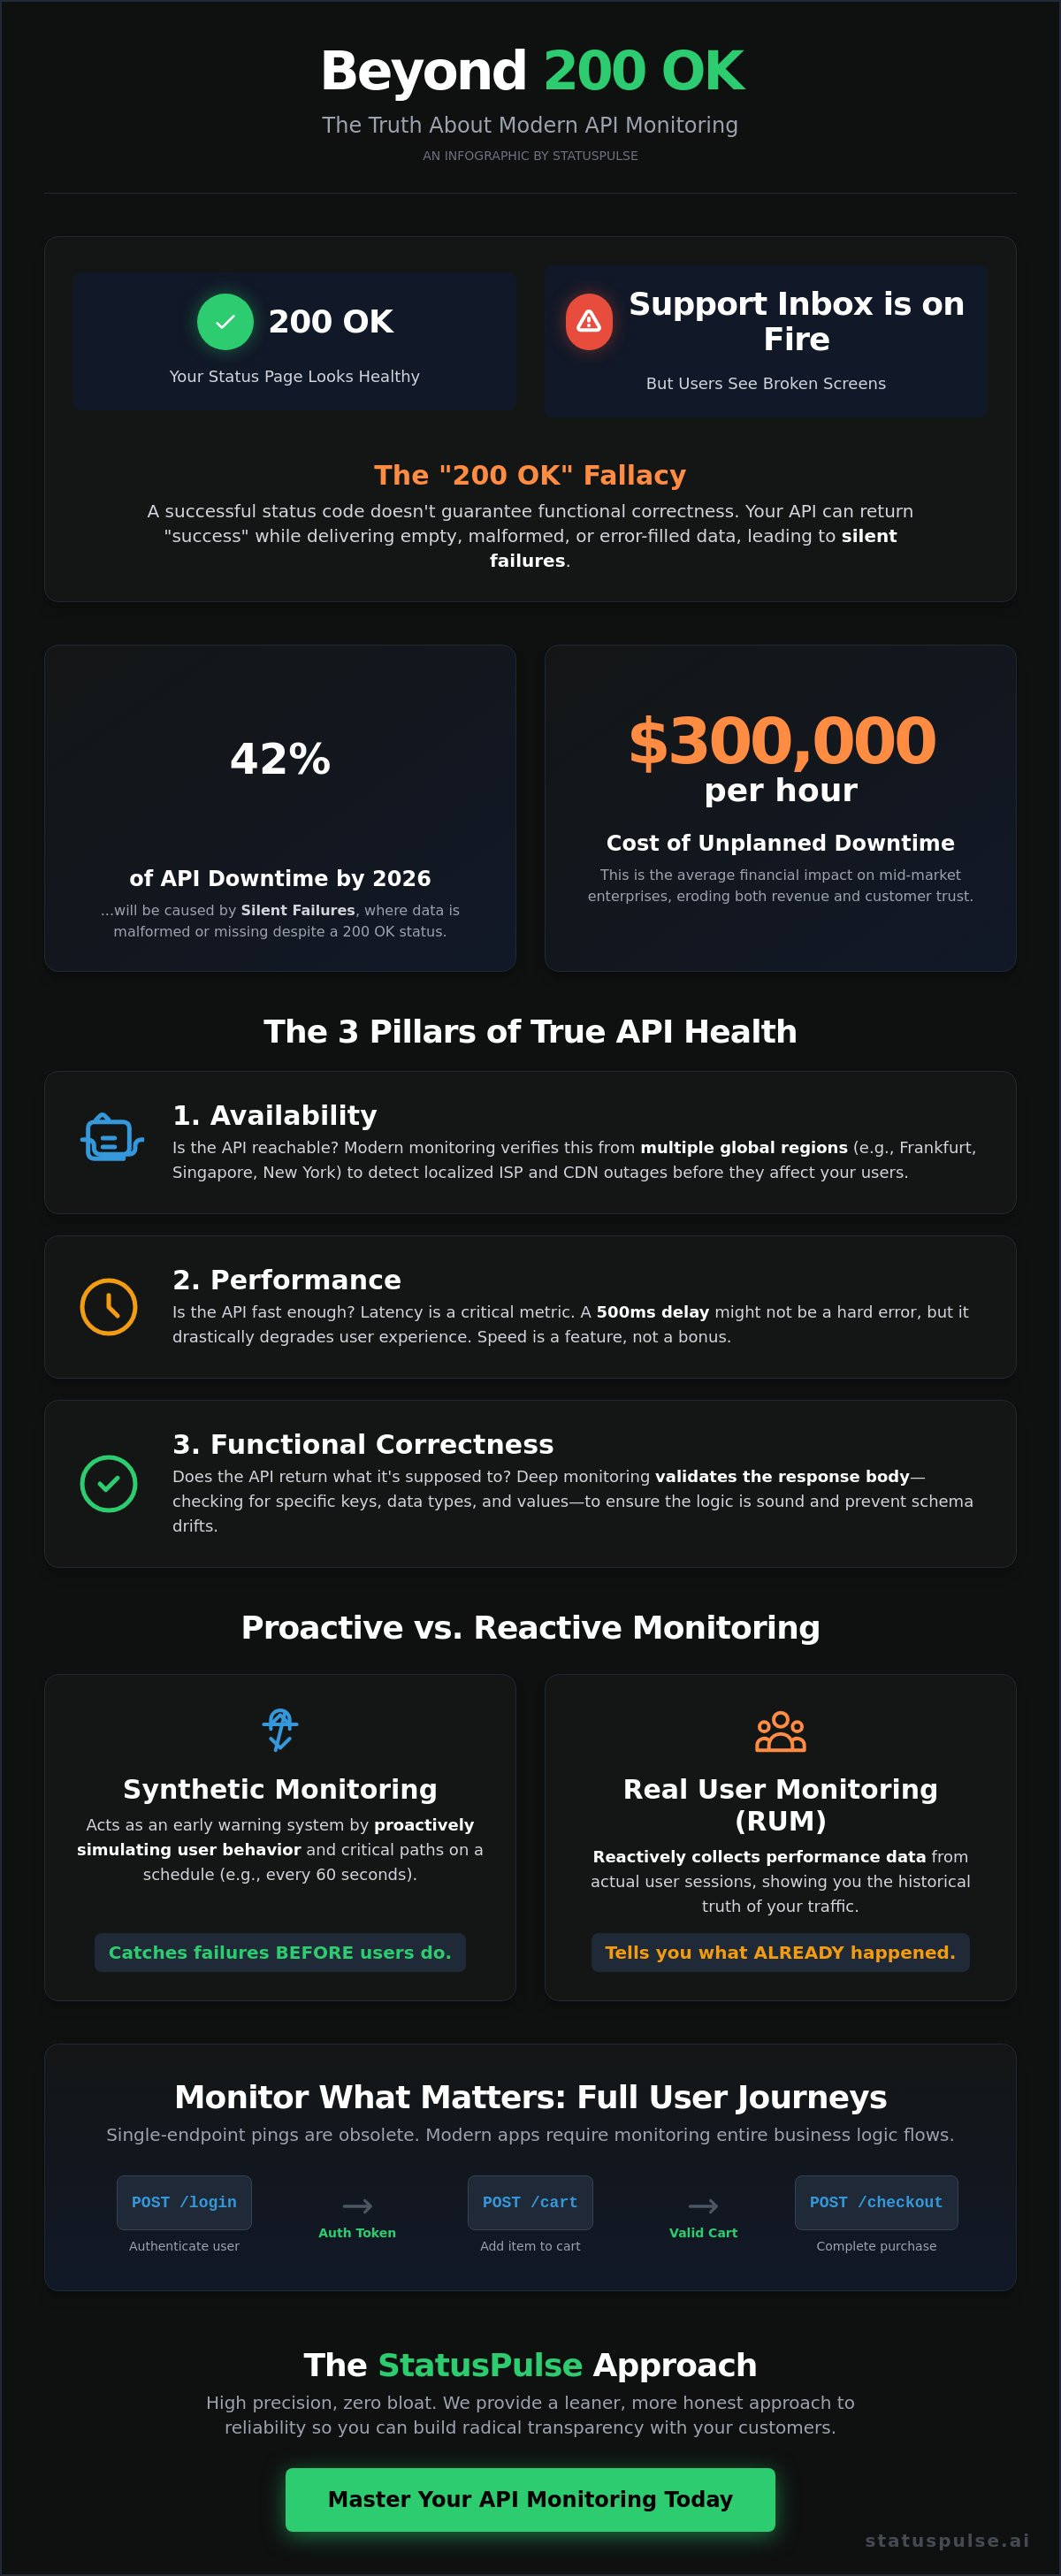
Your status page is a sea of green, yet your support inbox is on fire. A 200 OK status code doesn't mean your system is healthy. It just means the server didn't crash. In 2026, silent failures where data is malformed or missing account for 42 percent of API-related downtime according to the latest industry telemetry. This is the reality of modern development.
We know the frustration. You pay incumbent prices for tools that scream at 3 AM over a network blip but stay silent when a third-party dependency fails. It's exhausting. This guide shows you how to master api monitoring by detecting logic errors and managing dependencies with surgical precision. You'll learn to set up zero-friction checks that distinguish between a temporary hiccup and a genuine outage. We'll explore how to maintain high availability and build radical transparency with your customers without the corporate bloat. It's time for a leaner, more honest approach to reliability.
Key Takeaways
- Beyond the "200 OK" fallacy. Learn why successful status codes mask failures and how to verify true functional correctness.
- Master multi-region mechanics. Detect localized ISP and CDN issues before they reach your global user base.
- Spot "silent failures" instantly. We define the non-negotiable metrics for catching valid but empty data responses.
- Modernize your api monitoring. Shift checks into your CI/CD pipeline and implement an alerting framework that respects your time.
- High precision, zero bloat. Build a GDPR-native observability stack that values privacy over corporate complexity.
What is API Monitoring and Why Uptime Isn’t Enough?
API monitoring is the continuous verification of your service's availability, performance, and functional correctness. It's more than a simple heartbeat check. While traditional uptime tools tell you if a server is breathing, they don't tell you if it's actually working. In 2026, the complexity of distributed systems makes basic pings obsolete. You need to know that your logic holds up under pressure. Most incumbents focus on the surface. We focus on the truth.
The "200 OK" status code is a frequent liar. This is the 200 OK fallacy; a server returns a success code while delivering an empty payload or a "database connection error" wrapped in JSON. It masks total service failure. Without deep inspection, your dashboard stays green while your users see broken screens. This goes beyond technical debt. It impacts the bottom line. A 2024 industry report found that unplanned downtime costs mid-market enterprises an average of $300,000 per hour. Beyond the money, broken integrations erode developer trust. Once that trust is gone, it's hard to win back.
Deep api monitoring ensures that every layer of the request is valid. This fits into the broader scope of API management, where visibility into reporting and analytics becomes the backbone of a reliable product. We don't settle for surface-level metrics. We verify the whole stack to ensure your data is as healthy as your connection.
The Anatomy of an API Check
A monitoring check follows the full request-response cycle. It's a simulated conversation. To be effective, the check must include specific headers, authentication tokens, and payload requirements that mirror real-world usage. Synthetic monitoring is the proactive simulation of user behavior. It allows you to catch failures in a controlled environment before a single customer is affected. No surprises. Just data.
Availability vs. Performance vs. Functional Correctness
- Availability: Is the endpoint reachable from multi-region locations like Frankfurt, Singapore, and New York? If it's only up in one region, it's down for the rest of the world.
- Performance: Is the latency within acceptable thresholds? A 500ms delay might not trigger a hard error, but it ruins the user experience. Speed is a requirement, not a bonus.
- Correctness: Does the JSON response contain the expected keys and data types? If your API returns a string where a boolean should be, your frontend will crash. Api monitoring catches these schema drifts instantly.
The Technical Mechanics: How Modern API Monitoring Works
Effective api monitoring requires a dual-perspective approach. Black-box monitoring tests your API from the outside. It treats your system as a mystery, focusing on what the user experiences. White-box monitoring looks inside. It tracks internal metrics like heap memory, database query times, and CPU cycles. Relying on one alone creates blind spots. Incumbents often bury these features behind enterprise-tier paywalls. We believe visibility shouldn't be a luxury.
Multi-region monitoring is no longer optional. In 2025, localized ISP outages and CDN misconfigurations caused 22% of reported downtime. If your monitoring node is in Virginia but your user is in Berlin, you might miss a regional routing failure. Testing from multiple geographic points ensures your API is reachable globally. This is a core principle in building robust API monitoring solutions that account for the messy reality of global networking.
Latency is a deceptive metric. A desktop user on fiber might see a 15ms response time. A mobile user on a congested 5G network often faces 300ms or more. Modern tools must distinguish between these profiles. Beyond speed, you must validate logic using assertions. A 200 OK status code is meaningless if the JSON body is empty or contains an error string. Assertions check for specific keys, data types, and values to ensure the API actually works.
Synthetic Monitoring vs. Real User Monitoring (RUM)
Synthetic checks are proactive. They use cron-like schedules to test your critical paths every 30 or 60 seconds. This catches failures before users do. RUM is reactive. It collects data from actual sessions. While RUM shows the historical truth of your traffic, it won't alert you to a 3:00 AM crash until your first customer fails to log in. Synthetic monitoring acts as your early warning system.
Multi-Step Sequences and User Journeys
Single-endpoint pings are a relic of the past. Modern SaaS relies on complex workflows. You need to monitor the entire journey: Login, Add to Cart, and Checkout. This requires state management between calls. You extract a token from the first response and pass it to the next. Chained requests ensure that your business logic remains intact across the entire stack. If you want a tool that handles these complexities without the corporate bloat, consider an honestly priced alternative for your team.
Key Metrics and Detecting "Silent Failures"
Metrics are the pulse of your infrastructure. To maintain high availability, you need four non-negotiables: Latency, Error Rate, Throughput, and Uptime. Latency measures the delay users feel. Error Rate tracks the percentage of failed requests. Throughput monitors the volume of traffic your system handles. Uptime is your baseline existence. These are the fundamentals of api monitoring, but they only tell half the story.
Status codes often hide the truth. A "200 OK" response doesn't guarantee success. It only means the server didn't crash. We define "Silent Failures" as instances where an API returns a valid response body that contains empty or incorrect data. If your checkout API returns an empty array instead of a price, your monitoring might stay green while your revenue hits zero. A 2024 industry study showed that 32% of critical production issues stem from these logic-based failures rather than hard crashes. Understanding What is API Monitoring? involves looking deeper than the surface level header.
Avoid alert fatigue by setting smart thresholds. Static alerts are noisy. If your latency naturally increases by 12% during peak hours, a fixed threshold will trigger false alarms. Use dynamic baselines that adapt to your traffic patterns. This keeps your team focused on real problems. No one wants a 3:00 AM page for a predictable traffic spike.
Monitoring Third-Party Dependencies
Your application is a collection of external services. You likely rely on Stripe for payments, AWS for storage, or OpenAI for intelligence. Your reliability is capped by their performance. Don't wait for a third-party status page to turn red. Many incumbents delay reporting outages by 15 minutes or more. Set up independent monitors for every external endpoint you consume. Use this data to inform your own public status page. It builds trust through radical transparency and keeps your users informed without manual intervention.
Advanced Assertions and Payload Validation
Move beyond status codes. Use advanced assertions to check for specific strings or regex patterns within the response. This ensures the data you expect is actually there. JSON Schema validation is equally vital. It ensures the structure of the payload hasn't changed unexpectedly. Schema Drift causes silent frontend breakage; the data arrives, but the UI fails to render it because a field name changed. In a microservices environment, schema validation is the only way to catch these breaking changes before they reach your users. By 2026, automated schema validation will be the standard for any team managing more than 10 microservices.
Best Practices for API Observability in 2026
Monitoring isn't just about watching things break. It's about seeing them before they do. In 2026, the best teams shift-left. They integrate api monitoring checks directly into the CI/CD pipeline. If a pull request breaks an API contract, the build fails. It never reaches production. High availability starts in your local environment, not in a frantic 3 AM Slack thread. By testing against production-like environments during the build phase, you catch 85% of potential outages before they impact a single user.
We believe in an "Honest Alerting" framework. Most legacy tools flood your inbox with useless data. We focus on what matters. Who gets notified? Only the person who can fix it. When? Only when the user experience is genuinely degraded. Modern AI now filters up to 92% of false positives by analyzing historical latency patterns and regional network health. It identifies the root cause in seconds. This allows your team to focus on shipping code instead of chasing ghosts in the machine. It's about quiet confidence, not constant noise.
Reducing Alert Fatigue
Transient blips are a fact of life. Network jitter happens. Don't let a single 503 error wake your lead engineer. We implement "Retry Logic" as a core standard. An alert only fires after three consecutive failures from at least two different geographic regions. It's about precision. Grouping related failures is also vital. If your primary database hangs, you don't need 500 individual alerts for 500 different endpoints. You need one clear incident report. Use smart escalation policies to ensure the right developer is paged while the rest of the team keeps working. Four plans. No surprises. No unnecessary wake-up calls.
Incident Communication and Transparency
Your public status page is your foundation of trust. In a world of complex microservices, silence is churn. If you don't provide an update within 15 minutes of a service disruption, users assume the worst. We prioritize immediate, honest communication over corporate polish. Incumbents hide behind vague "investigating" messages for hours. We don't. We believe in being a principled underdog that tells the truth.
AI assists this process without removing the human touch. It analyzes raw api monitoring data to create a human-readable summary of the failure. Claude drafts the technical explanation for your customers. You press send. It's simple. This keeps your non-technical stakeholders informed and reduces the pressure on your support team. Transparency isn't a liability. It's a competitive advantage that builds long-term loyalty. When you're honest about the "why," users stay for the "how."
StatusPulse: Honest API Monitoring for Modern Teams
Incumbents build for the boardroom. We build for the terminal. Most api monitoring tools have become bloated, expensive, and unnecessarily complex. StatusPulse is the lightweight alternative. It's built for teams that value precision over flashy dashboards. We host everything in the EU. Being GDPR-native isn't a checkbox for us; it's our foundation. You get high-precision monitoring without the corporate weight or the privacy concerns that come with US-based incumbents.
Our pricing model is simple. It starts at €5, not $29. We don't believe in "contact sales" buttons or hidden tiers that scale based on your success. You get professional-grade tools at an honest price. It's a fair deal for developers who want to ship code instead of managing bloated monitoring budgets. We've stripped away the fluff to focus on what actually keeps your services online.
Native Multi-Region Monitoring
Reliability requires a global perspective. StatusPulse performs checks from multiple regions simultaneously to ensure your API is accessible everywhere. We offer 1-minute granularity as our standard. If your API fails in Frankfurt but remains reachable in New York, you'll know the difference immediately. This level of detail prevents false positives and helps you isolate regional network issues before they affect your entire user base.
We also handle the essential maintenance tasks that others overlook. You can monitor SSL certificates and domain expiry dates within the same interface. For a complete view of your stack, we've included uptime monitoring that integrates directly with your API checks. One dashboard provides a unified view of your infrastructure. No noise; just the data you need to maintain 99.99% availability.
From Detection to Resolution
Detecting a failure is only half the battle. Communicating it to your users matters just as much. When an api monitoring check fails, StatusPulse automates the workflow to reduce your stress. We use AI to simplify incident management. Claude drafts the impact summary based on the specific error logs and latency spikes detected during the outage. You review the text. You press send. It's that simple.
Your status page updates instantly. This keeps stakeholders informed without forcing you to leave your IDE or manually type out incident reports during a crisis. We focus on reducing your Mean Time to Resolution (MTTR) by stripping away the manual overhead. Our system ensures that your communication is as fast as your technical response. Stop overpaying for complexity. Start monitoring your APIs honestly today and see why modern teams are leaving the incumbents behind.
Build Resilient Systems for the 2026 Landscape
High availability in 2026 demands more than a simple green status light. You've learned that detecting silent failures and tracking 95th percentile latency are the new standards for engineering excellence. Effective api monitoring isn't just about basic pings; it's about deep observability and actionable data. Relying on bloated legacy incumbents shouldn't be your default choice. You need a streamlined setup that respects your time, your budget, and your regional privacy laws.
StatusPulse offers a refreshing alternative to complex enterprise software. Our platform is EU-hosted and GDPR-native from the ground up. We've stripped away the corporate bloat and hidden fees that plague the industry. When an incident occurs, our AI-powered drafting tool simplifies your communication workflow. Claude drafts the message; you press send. It's a meticulous approach built by developers who value integrity. You get professional tools without the unnecessary noise of traditional SaaS giants.
It's time to simplify your stack and focus on building great products. Your users deserve a platform that stays up, and you deserve a monitoring partner that stays honest. Four plans. No surprises.
Monitor your APIs honestly for €5/month
You have the knowledge to build something great. Now go make it reliable.
Frequently Asked Questions
What is the difference between API monitoring and API testing?
API testing validates code during the CI/CD pipeline, while api monitoring tracks performance in live production environments. Testing is a one-time check for correctness before deployment. Monitoring is a continuous heartbeat that catches failures caused by traffic spikes or server fatigue. It ensures your 99.9% uptime SLA stays intact after the code leaves your local machine. It's about long-term reliability.
How often should I run API monitoring checks?
Run checks every 60 seconds to maintain high availability. Checking every 300 seconds leaves a massive gap where users face errors without you knowing. High-traffic endpoints often require 30-second intervals to catch intermittent latency spikes. Frequent checks allow you to detect a 503 error before your support inbox fills up with 50 tickets. Efficiency matters when every second of downtime impacts your bottom line.
Can I monitor APIs that require authentication or Oauth2?
You can monitor APIs that require OAuth2 by securely storing client credentials and automating token refreshes. Most tools use a pre-request script to fetch a Bearer token. This ensures your api monitoring setup mirrors real-world usage. It's essential for testing private endpoints where 100% of the traffic requires a valid session. We handle this complexity without the bloat found in legacy tools.
What are the most important API performance metrics to track?
Focus on latency, uptime, and the 4xx or 5xx error rate. A response time under 200ms is the industry benchmark for a snappy experience. Track the P99 latency to see how the slowest 1% of your users feel. Uptime isn't just a binary check. It must verify that the JSON payload contains the correct status and expected data keys. Honest data leads to better engineering decisions.
How does API monitoring help with third-party integrations?
Monitoring identifies when a failure belongs to an external provider like Stripe or Twilio. If their API latency jumps by 450ms, your dashboard shows it immediately. This prevents your team from wasting 2 hours debugging internal code for an external outage. You can point to the data and tell stakeholders exactly why the checkout process is slow. Transparency saves your team from unnecessary stress.
Is it possible to monitor APIs from multiple geographic locations?
Monitor from multiple regions to catch localized routing issues. A server might respond in 45ms from Frankfurt but take 2500ms from Tokyo. Using at least 5 global nodes ensures that a regional CDN failure doesn't go unnoticed. StatusPulse is GDPR-native and EU-hosted. We provide a principled alternative to US-centric incumbents that often ignore regional compliance and privacy laws.
What happens if my monitoring tool itself goes down?
Reliable tools use redundant infrastructure across multiple cloud providers to ensure they stay online. If a primary node fails, a secondary node in a different data center takes over in under 5 seconds. You can also check a public status page to verify the health of the monitor itself. We built our system to be robust and straightforward. A broken monitor is worse than no monitor at all.


