

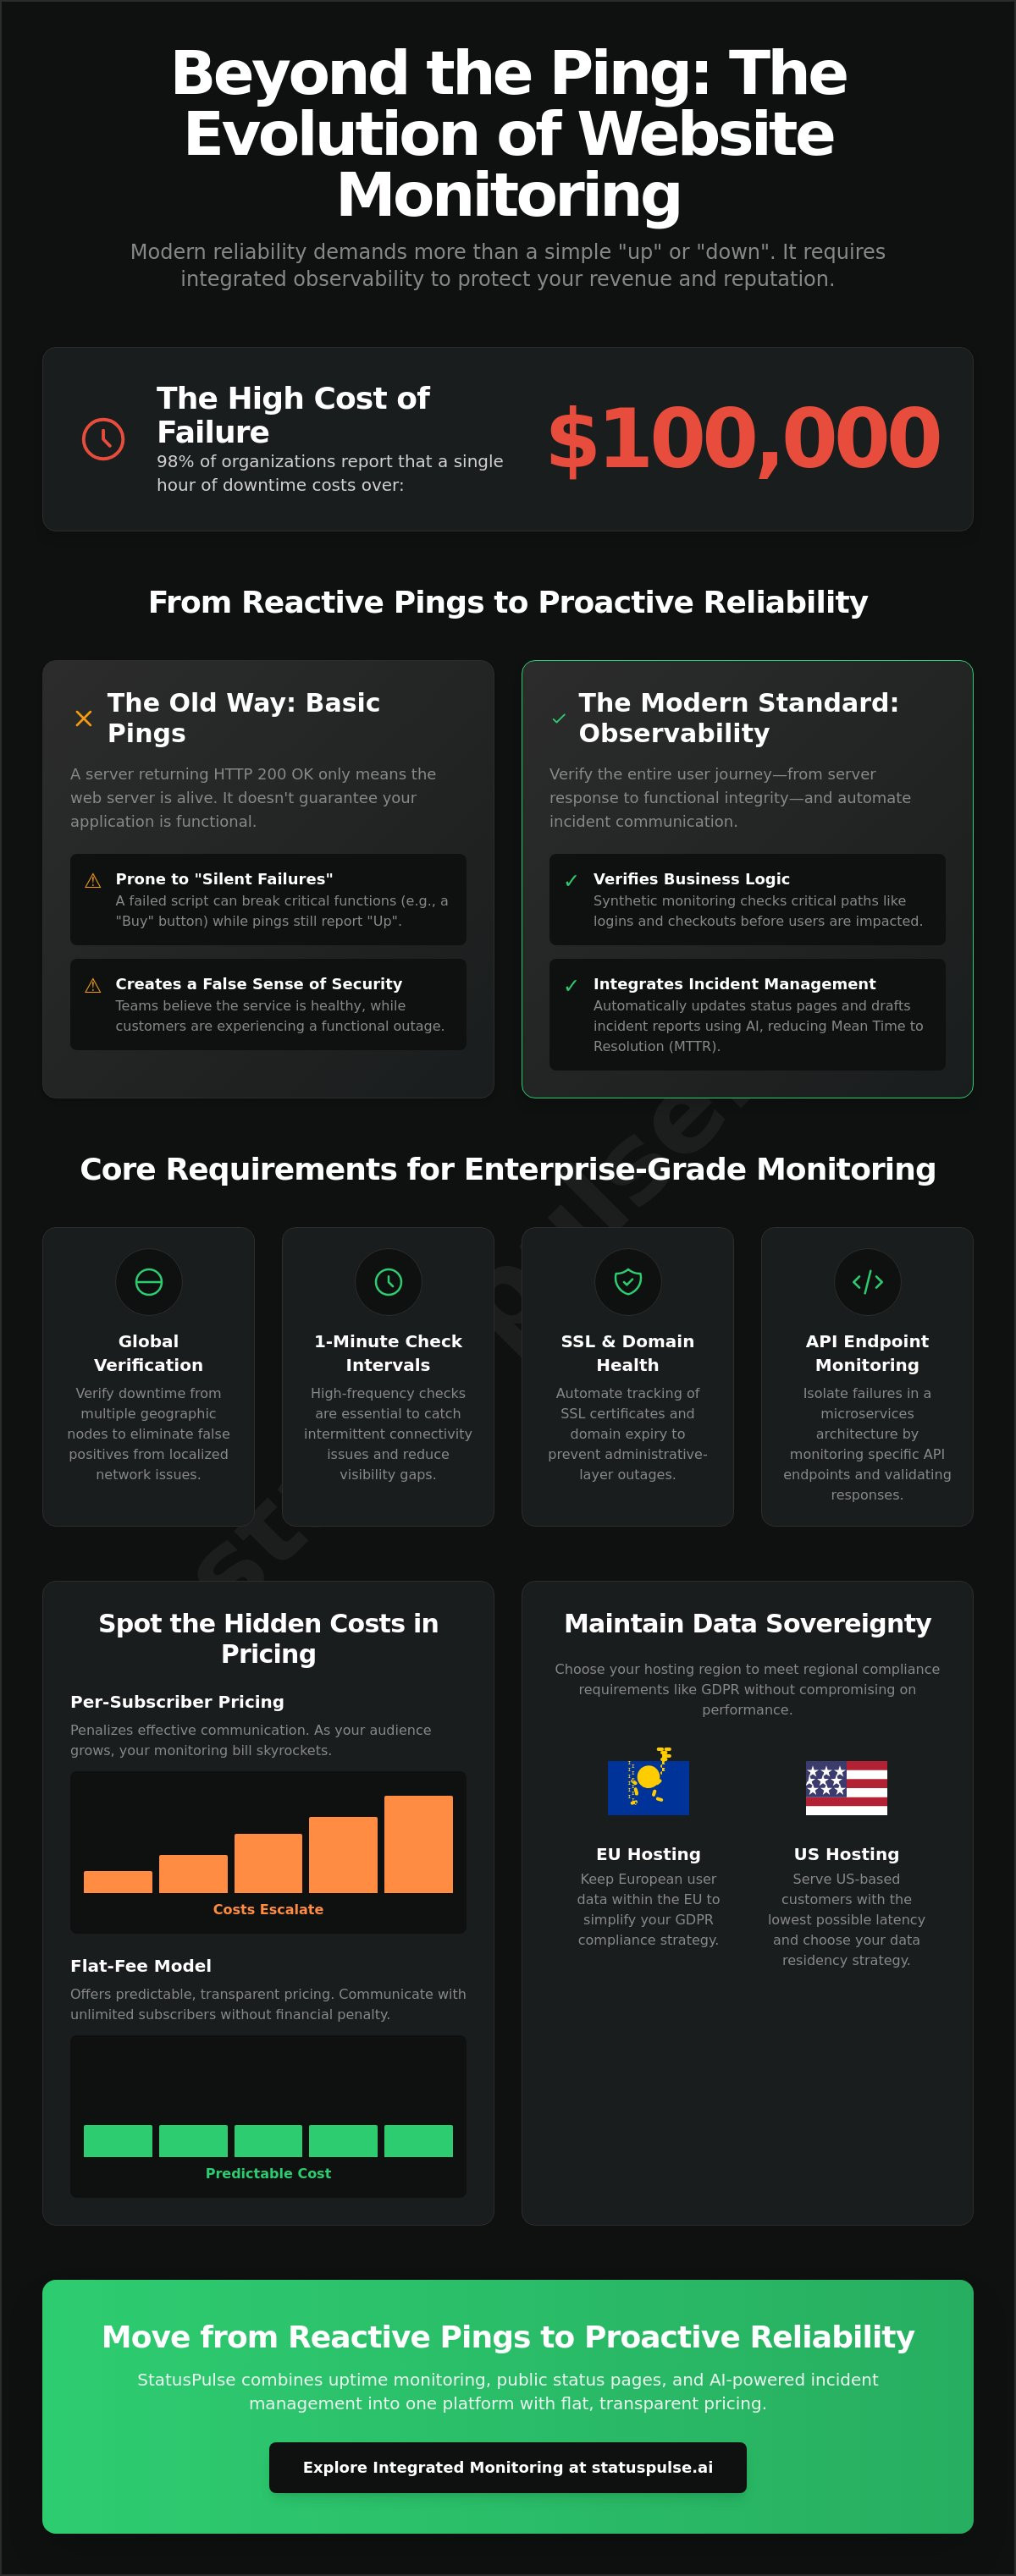
98% of organizations report that a single hour of downtime costs over $100,000. Despite these stakes, many teams still rely on a website monitor tool that generates more alert noise than actionable insights. In 2026, a website monitor tool must do more than ping an endpoint; it must integrate uptime data with automated, AI-assisted incident communication to protect your bottom line. You've likely spent frantic outages manually updating status pages while your inbox filled with customer complaints. It's an inefficient way to manage infrastructure.
We believe your monitoring stack should work for you, not the other way around. This guide evaluates the top monitoring solutions based on technical precision, data sovereignty, and the transition to integrated incident management. You'll learn how to reduce your Mean Time to Resolution by automating communication and choosing tools that respect your privacy requirements. We'll also examine how EU-based hosting can simplify your GDPR compliance strategy without the burden of per-subscriber pricing models. We provide a direct comparison of the current landscape to help you move from reactive pings to proactive reliability.
Key Takeaways
- Understand why modern reliability requires synthetic monitoring instead of basic pings to verify complex user journeys and functional uptime.
- Evaluate how a technical website monitor tool should handle global check locations and SSL tracking to eliminate false positives and certificate surprises.
- Learn to spot the hidden costs in per-subscriber pricing and how flat-fee models ensure incident communication remains ethical and affordable as your audience grows.
- Compare the technical trade-offs between EU and US hosting to maintain strict data sovereignty and meet regional GDPR compliance requirements.
- Streamline your response workflow by integrating AI-drafted incident reports and API-first management into your existing DevOps stack.
The Evolution of Website Monitor Tools: From Pings to Observability
A server returning an HTTP 200 code doesn't mean your application is functional. It just means the web server is alive. Modern website monitor tool requirements have shifted toward observability. You need to verify that your business logic is actually executing. If your checkout page loads but the "Buy" button is missing due to a failed script, a simple ping won't save you. External Website monitoring now involves verifying the integrity of the response body. This prevents "silent failures" where the infrastructure is up but the service is broken.
Beyond the HTTP 200 Status Code
Validation must go deeper than status codes. High-traffic SaaS platforms require 1-minute check intervals to catch intermittent connectivity issues. Anything slower creates blind spots. Checking specific API endpoints within a microservices architecture allows you to isolate failures. If your authentication service is down but your landing page is up, you have a partial outage. Effective monitoring identifies these nuances. At StatusPulse, we prioritize this level of detail through API monitoring that validates specific response strings. This ensures your alerts are based on actual service availability, not just a TCP handshake.
Synthetic Monitoring vs. Real User Monitoring (RUM)
Reliability teams often debate between synthetic and real user monitoring. Synthetic monitoring uses scheduled probes from global regions to provide a consistent baseline. It's the standard for uptime alerting because it removes variables like the user's local ISP or device performance. RUM captures data from actual browsers. It's excellent for identifying localized bottlenecks, but it's reactive. You can't alert on a problem until a user has already experienced it.
For most SREs, synthetic monitoring is the primary defense. It allows you to test critical paths like logins or search queries before a customer touches them. However, you must also monitor third-party dependencies. If your CDN or a third-party script is slow, your site is effectively down. Latency tracking helps you distinguish between a "degraded" state and a total outage. A 0.1-second improvement in speed can increase conversion by 8.4% according to retail data. Conversely, 53% of mobile users leave a site that takes longer than 3 seconds to load. Monitoring these shifts is the difference between simple pings and true observability.
Core Technical Requirements for Enterprise-Grade Monitoring
Reliability isn't just about knowing if a site is up. It's about knowing if it's up for everyone, everywhere. Enterprise-grade monitoring requires a website monitor tool that handles the complexities of global networking without overwhelming your team with false positives. If your on-call engineer gets woken up at 3 AM for a regional routing blip that didn't actually affect users, your monitoring strategy has failed. You need precision, not just noise.
Global Verification and False Positive Prevention
Network anomalies are common. A single probe failure doesn't always signal a crisis. You should configure your monitors to require verification from multiple geographic nodes before triggering an incident. For instance, if a London probe reports a 404 but nodes in Frankfurt and Dublin see a 200 OK, the issue is likely localized routing. Configuring smart retry logic ensures accuracy. This prevents alert flapping, which is when a service rapidly oscillates between up and down states. This cycle leads to team burnout and causes engineers to ignore critical notifications.
SSL and Domain Health Integration
Technical teams often overlook the administrative layer of uptime. Expired SSL certificates or forgotten domain renewals cause just as much downtime as a server crash. Incorporating an automated domain expiration lookup ensures you aren't blindsided by a registrar's billing failure. Beyond simple expiry, you must monitor the entire SSL chain validity. Many expert monitoring tips suggest tracking DNS record changes alongside these checks. This helps detect unauthorized modifications or hijacking attempts before they impact your brand.
Workflow and Heartbeat Monitoring
Your stack doesn't end with the web server. Background processes, like database backups and cron jobs, are critical to your operation. Heartbeat monitoring allows these services to "check-in" with your monitoring platform. If the signal stops, you get an alert immediately. These notifications must flow directly into your existing developer workflows. Whether you use Slack, PagerDuty, or custom webhooks, the data should be actionable and immediate. If you're looking for a way to consolidate these technical checks, StatusPulse uptime monitoring brings SSL, API, and heartbeat tracking into a single, straightforward dashboard.
Comparing Monitoring Architectures and Pricing Models
Selecting a website monitor tool involves more than comparing feature lists. You must evaluate the underlying architecture and the long-term cost of ownership. Many legacy vendors use "per-subscriber" pricing models for status pages. This creates a "success tax" on your communication. If your user base grows from 100 to 1,000, your monitoring bill shouldn't explode just because you're keeping them informed. We believe pricing should be flat and transparent.
| Feature | StatusPulse | Industry Standard |
|---|---|---|
| Pricing Model | Flat Monthly Fee | Per-Monitor / Per-Subscriber |
| Status Page Subscribers | Unlimited | Tiered (Costs scale with users) |
| AI Incident Drafting | Included in Pro | Often an Enterprise Add-on |
| Hosting Location | Choice of EU or US | Often US-Default |
Pricing Comparison: StatusPulse vs. Industry Standards
Procurement friction often stems from unpredictable costs. For a setup with 100 monitors and 1,000 status page subscribers, the entry price for many established platforms can quickly exceed your initial budget. Industry trends in early 2026 show a consistent reduction in free-tier limits among major providers, making it difficult for growing teams to maintain stability. At StatusPulse, we offer a straightforward path. Our pricing doesn't penalize you for having a large audience. This transparency allows engineering managers to focus on reliability instead of budget approvals.
SaaS vs. Self-Hosted Monitoring
Engineering teams often consider self-hosting tools like Prometheus and Grafana. While these are excellent for internal metrics, they present a "who monitors the monitor" problem. If your entire network goes down, your self-hosted instance likely goes down with it. You lose the external perspective needed for accurate uptime data. Managing the maintenance overhead of time-series databases also distracts from your core product.
A SaaS-based website monitor tool solves this by providing managed global infrastructure. You get out-of-the-box integrations with Slack and PagerDuty without the configuration toil. Many free or self-hosted tools lack the redundancy required for commercial SLAs. They don't offer the multi-region verification we discussed in previous sections. By choosing a managed platform, you gain a reliable assistant that handles the data collection while you focus on the final human action of resolving the incident.
Selection Criteria: Choosing the Right Tool for Your Stack
Choosing a website monitor tool is an architectural decision that impacts your regulatory standing and developer efficiency. It's easy to get distracted by flashy dashboards. However, the real value lies in how the tool integrates with your existing infrastructure and whether it respects your data residency requirements. You need a solution that acts as a technical assistant rather than another source of maintenance toil.
Data Sovereignty and Regulatory Compliance
For European organizations, data sovereignty is a critical legal hurdle. You should prioritize [VERIFY: GDPR compliant hosting] in the EU to ensure that monitoring metadata and subscriber information remain within your jurisdiction. This isn't just about paperwork; it's about technical precision. Hosting location impacts monitoring latency. Probes located in the same region as your users provide more accurate performance data and fewer trans-atlantic network blips.
Evaluate your vendor's security posture by looking for SOC2 or CCPA documentation. Data encryption at rest and in transit should be a baseline requirement. If a vendor doesn't offer regional isolation between their US and EU clusters, you risk cross-border data leakage that could complicate your compliance audits. We believe teams should have the autonomy to choose their data's home without sacrificing performance.
Developer Experience and Automation
Managing monitors through a web interface doesn't scale. If you're managing dozens of microservices, you need an API-first design. This allows you to integrate api monitoring directly into your CI/CD pipelines. Look for tools that support Terraform providers or have a robust CLI. Treating your monitoring as code ensures that every new deployment is automatically covered by your uptime checks.
- Public Status Pages: These should sync automatically with your monitor states to eliminate manual updates during an outage.
- Webhook Documentation: Check if the tool allows you to trigger custom remediation scripts or serverless functions when a check fails.
- Analytics Integrity: Ensure the monitor uses a distinct User Agent so you can filter out probe traffic from your marketing analytics.
Incident management is the natural extension of monitoring. A tool that only alerts you is only doing half the job. It should help you communicate with your users through automated updates. If you're looking for a platform that combines technical depth with a choice of EU or US hosting, explore the monitoring features at StatusPulse. We focus on providing the precision you need without the bloat of traditional enterprise software.
StatusPulse: Integrated Uptime, SSL, and AI Incident Management
Monitoring is a solved problem; communication is not. Most website monitor tool options notify your team but leave your customers in the dark. StatusPulse functions as a unified platform for website uptime monitoring tools, bridging the gap between technical detection and incident response. We provide the infrastructure to track availability and the tools to explain it to your stakeholders. This reduces the manual effort required to manage an outage.
AI-Powered Incident Communication
When a service fails, your primary goal is resolution. Writing status updates is often a secondary, stressful task. StatusPulse uses native AI tools to draft incident updates and summaries based on the specific error logs and monitor states. These drafts are technical and honest. They allow you to communicate complex downtime events to non-technical stakeholders in seconds. By providing proactive updates on your public status page, you can significantly reduce support ticket volume. Our platform includes these status pages with zero per-subscriber fees, ensuring your costs remain predictable regardless of your user base size.
Technical Reliability Without the Hype
Our architecture prioritizes precision. We offer 1-minute check intervals and multi-location verification as standard features. This ensures that when you receive an alert, it is verified and actionable. You can find the full StatusPulse technical specifications on our site. We believe in transparency regarding our capabilities. StatusPulse is built for core uptime, SSL, and API monitoring. We do not offer visual screenshot diffs or managed IT support. We focus on the fundamental metrics that define your reliability.
Data residency is a core part of our ethical framework. You can choose between EU or US hosting to meet your specific local compliance needs. This choice is presented at setup, ensuring your monitoring data lives where you want it to. By combining technical depth with a fair pricing model, we offer a straightforward alternative to bloated enterprise software. It is a tool built by specialists, for specialists, who value integrity over flashiness.
Frequently Asked Questions
- Does StatusPulse support API monitoring? Yes, we provide specific tools to monitor API endpoints and validate response bodies.
- Can I host my data in the EU? Yes, we offer a choice between EU and US data residency for all accounts.
- Are there limits on status page subscribers? No, our pricing is flat and does not include per-subscriber fees.
- What is the minimum check interval? We provide 1-minute check intervals to ensure production-grade reliability.
Building a Resilient Monitoring Strategy for 2026
Effective uptime management requires more than just a website monitor tool that alerts you when a server is unreachable. It demands a strategy that integrates technical precision with automated, honest communication. You've seen how multi-region verification reduces alert noise and how data residency choices simplify regional regulatory compliance. By removing the success tax of per-subscriber pricing, you can focus on scaling your infrastructure without worrying about escalating costs during a crisis.
Reliability is a continuous process of refinement. Your tools should act as assistants that respect your time and your users' trust. You can now bridge the gap between detection and resolution by using AI to draft technical incident updates instantly. This shift from reactive pings to proactive observability ensures your team stays focused on code, not manual status updates. It's about maintaining integrity when things go wrong.
If you are ready to simplify your stack, you can start monitoring your infrastructure with StatusPulse. Benefit from flat pricing, AI-assisted incident drafting, and your choice of EU or US data residency. Let's build a more transparent web together.
Frequently Asked Questions
What is the difference between uptime monitoring and website performance monitoring?
Uptime monitoring tracks availability by verifying binary states; performance monitoring measures the speed of those responses. A website monitor tool primarily focuses on whether the service is reachable and functional. Performance monitoring involves deeper metrics like Core Web Vitals. Both are necessary to ensure a reliable user experience across different geographic regions.
How does a website monitor tool help with GDPR compliance?
A monitoring tool aids GDPR compliance by offering regional data residency, such as EU-based hosting. This ensures that metadata and subscriber information don't leave the jurisdiction. Proper tools also minimize the collection of Personal Identifiable Information. By selecting a vendor with a clear data sovereignty policy, you reduce the legal complexity of your technical stack.
Why should I use a paid website monitor tool instead of a free one?
Paid tools offer production-grade reliability through 1-minute check intervals and multi-region verification. Free tiers often limit check frequency to 5 or 15 minutes; this creates dangerous blind spots. Additionally, paid solutions usually include unlimited status page subscribers. This prevents the success tax where costs explode as your audience grows. You pay for precision and predictable scaling.
Can I monitor internal APIs that are not publicly accessible?
Monitoring internal APIs typically requires a tool that supports IP whitelisting. If your API is behind a firewall, you must allow the monitor's specific IP addresses to bypass security layers. While some platforms offer on-premise licensing, SaaS tools are generally designed for public-facing endpoints. This provides the most accurate external perspective of your service's availability from the public internet.
What are the benefits of having an integrated public status page?
Integrated status pages eliminate the need for manual updates during an outage. When a monitor detects a failure, the status page reflects the down state automatically. This transparency builds trust with your users and reduces the volume of support tickets. It allows your engineering team to focus entirely on the resolution rather than drafting repetitive emails to customers.
How does AI incident management work in a monitoring context?
AI incident management analyzes technical logs and monitor states to draft human-readable status updates. It acts as an assistant that synthesizes complex downtime data into clear summaries for stakeholders. This reduces the cognitive load on engineers during high-pressure events. The final action remains with a human; they review and publish the draft to ensure technical accuracy.
Does StatusPulse support multi-region monitoring checks?
StatusPulse utilizes a global network of probes to perform multi-region monitoring checks. An incident is only triggered when multiple nodes verify the failure. This prevents false alarms caused by localized network congestion or regional routing issues. It ensures that your on-call team only receives notifications for genuine outages that affect a broad segment of your user base.
What happens if my SSL certificate expires before the monitor catches it?
SSL certificate monitoring is proactive; it tracks the expiration date and chain validity long before the certificate fails. You receive alerts at specific intervals, such as 60, 30, and 7 days before expiry. If a certificate expires before you act, your site will show security warnings. Using a dedicated website monitor tool ensures you have ample lead time to automate the renewal.


