

Your monitoring dashboard shows a sea of green, yet your support tickets are spiking. This is the "200 OK" lie. In the September 2025 GraphQL specification era, a successful HTTP status code doesn't guarantee your API is actually working. It only means the server received the request. For the over 60% of enterprises now using GraphQL in production, silent failures where the server returns a successful status but an "errors" array remain a primary operational pain point. Implementing effective GraphQL API health checks requires moving past simple pings toward semantic monitoring.
You know that a healthy server doesn't always mean a healthy application. When a specific resolver fails or a downstream database goes offline, generic tools often fail to notice because they can't parse GraphQL-specific POST bodies. We'll show you how to implement robust health checks that validate schema integrity and data availability. This guide covers the technical distinction between liveliness and readiness probes. You will learn to detect partial outages and reduce your mean time to detection for API regressions while maintaining transparent communication with your consumers.
Key Takeaways
- Understand why HTTP 200 OK responses often mask partial failures and how to detect errors hidden within the GraphQL response body.
- Architect robust GraphQL API health checks by separating simple liveliness pings from readiness probes that validate downstream dependencies like databases and caches.
- Implement synthetic monitoring using valid POST request bodies to simulate real user queries and confirm specific schema integrity.
- Identify performance regressions by tracking P99 latency for complex, nested queries rather than relying on generic endpoint averages.
- Verify regional latency and support data sovereignty by utilizing monitoring nodes specifically hosted in either the EU or US.
The Semantic Gap: Why HTTP 200 OK Isn’t a GraphQL Health Check
Traditional REST APIs rely on HTTP status codes to communicate health. If a resource is missing, the server returns a 404. If the database crashes, you see a 500. GraphQL breaks this convention. Because GraphQL typically operates through a single POST endpoint, the transport layer often reports success even when the application logic fails. This creates a semantic gap. The network says "yes," but the data says "no."
Relying on simple pings for GraphQL API health checks is a liability. A server can be "up" in the eyes of a load balancer while being completely unable to serve data. This discrepancy leads to silent failures that bypass traditional monitoring. You need external validation that understands the internal structure of a GraphQL response to catch these regressions before they reach your users.
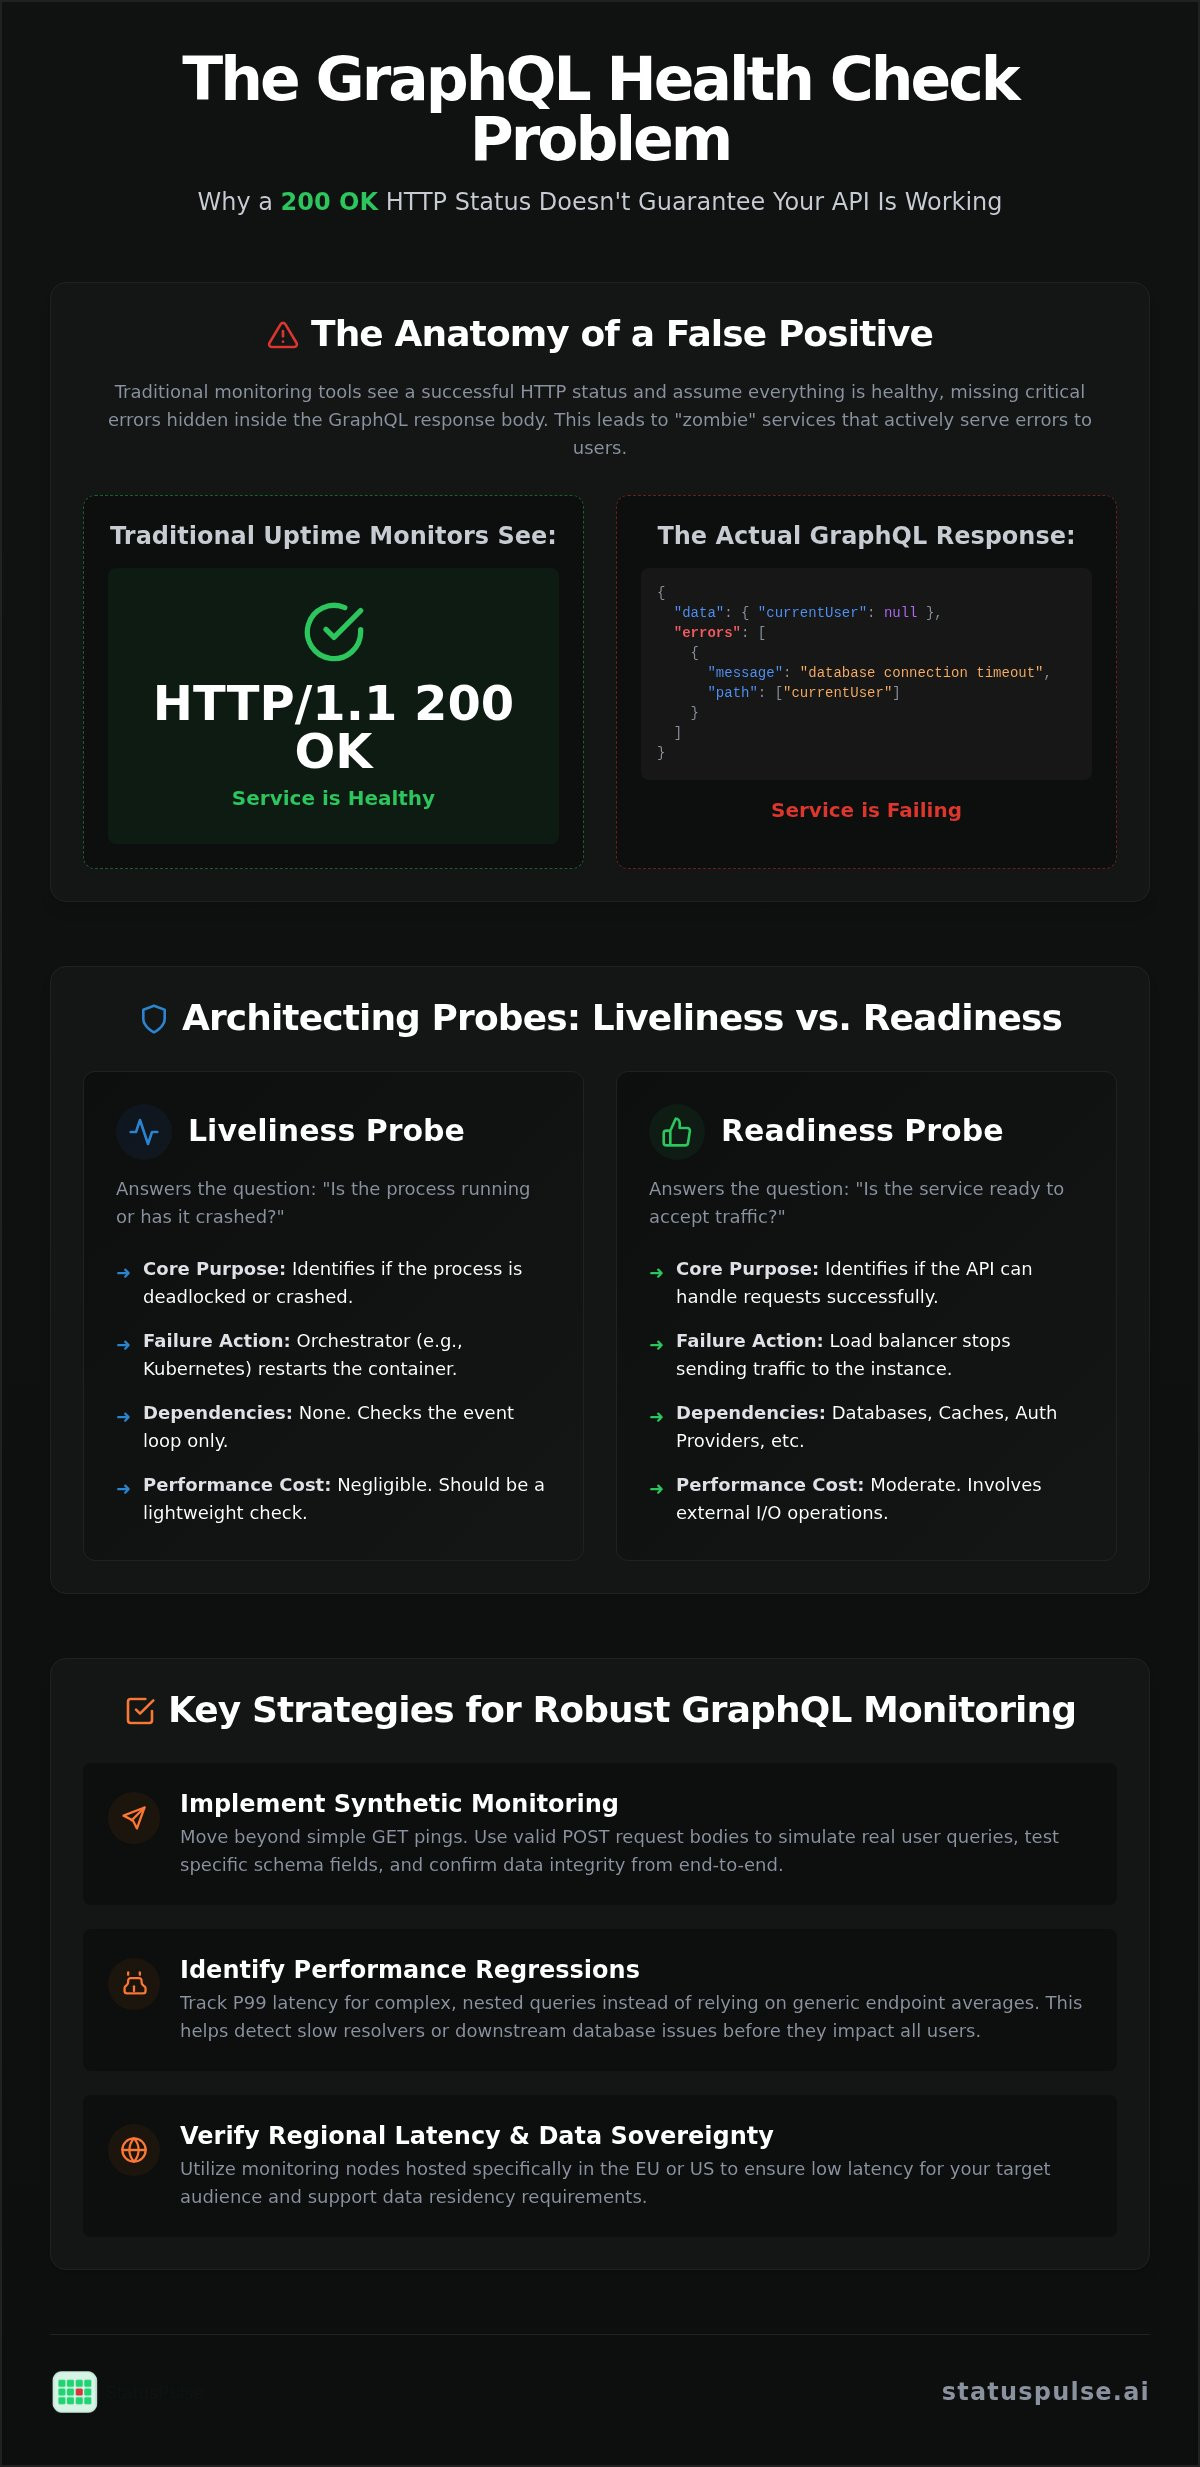
The Anatomy of a False Positive
Consider a scenario where your API server is running, but the underlying PostgreSQL database has reached its connection limit. A standard uptime monitor hits your endpoint and receives this response:
HTTP/1.1 200 OK
{
  "data": { "currentUser": null },
  "errors": [
{
"message": "Context creation failed: database connection timeout",
"locations": [{ "line": 2, "column": 3 }],
"path": ["currentUser"]
}
  ]
}
Your infrastructure sees the 200 OK status. It assumes the service is healthy. This is a "zombie" service. It remains in the load balancer rotation, actively serving error messages to your frontend. Without semantic monitoring, your mean time to detection (MTTD) depends entirely on manual bug reports rather than automated alerts.
Monitoring the Transport vs. Monitoring the Schema
Effective monitoring requires a two-tiered approach. You must distinguish between the container's ability to run and the API's ability to resolve data. Modern SRE teams categorize these as follows:
- Transport-level checks: These verify TCP connectivity and basic HTTP availability. They answer the question: "Is the server process alive?"
- Schema-level checks: These involve executing actual queries or introspection calls. They answer the question: "Are the resolvers functioning and the data sources reachable?"
A robust strategy for GraphQL API health checks combines both. Transport checks are great for Kubernetes liveliness probes to trigger restarts. However, schema-level checks are essential for readiness probes and external API monitoring. This ensures that traffic only flows to instances that can actually fulfill the data contract defined in your schema.
Liveliness vs. Readiness: Architecting GraphQL Probes
Effective GraphQL API health checks require a clear distinction between process health and service availability. In containerized environments like Kubernetes, using a single endpoint for all checks is a common mistake. If your server is running but your database is down, restarting the process won't solve the problem. You need two distinct probes to manage your API lifecycle correctly.
| Feature | Liveliness Probe | Readiness Probe |
|---|---|---|
| Core Purpose | Identifies if the process is deadlocked or crashed. | Identifies if the API is prepared to handle requests. |
| Failure Action | Orchestrator restarts the container. | Load balancer stops sending traffic to the instance. |
| Dependencies | None (Event loop only). | Databases, Redis, Auth providers. |
| Performance Cost | Negligible. | Moderate (requires external I/O). |
Liveliness tells the orchestrator if the process is stuck. Readiness tells the load balancer if the service can actually fulfill a request. Deep checks provide more data but introduce performance overhead. Executing a full database query every few seconds on every pod can create unnecessary load. We recommend keeping internal probes lightweight and using separate endpoints for internal orchestration and external monitoring.
Implementing Liveliness Probes
A liveliness probe should be the cheapest possible operation. Its only job is to confirm the event loop isn't blocked. It should never touch a database or an external cache. A simple 200 OK response is sufficient here.
// Express.js example
app.get('/health/live', (req, res) => {
  res.status(200).send('Alive');
});
This endpoint is used for pod restarts. If this fails, the system assumes the process is a "zombie" and kills it. Use this for basic uptime alerts that don't depend on your data layer's state.
Designing Readiness Checks for GraphQL
Readiness checks are more complex. They must verify that your GraphQL resolvers have access to their dependencies. This includes PostgreSQL connections, Redis clusters, and third-party authentication providers. If one of these is down, the API should stop accepting new traffic.
app.get('/health/ready', async (req, res) => {
  const dbHealthy = await checkDatabase();
  const redisHealthy = await checkRedis();

  if (dbHealthy && redisHealthy) {
res.status(200).json({ status: 'ready' });
  } else {
res.status(503).json({ status: 'unready' });
  }
});
Implementing a "Circuit Breaker" pattern here prevents cascading failures. If a non-essential dependency is slow, you might decide to remain "ready" but flag the degradation. Implementing these endpoints internally is only half the battle. Using an external uptime monitoring tool ensures your probes are actually reachable from the public internet and provides the final validation your internal checks might miss.
Implementing Synthetic GraphQL Monitors: Beyond Simple Pings
Internal readiness probes verify that your pods can talk to your database. They don't, however, verify that a user in Berlin or New York can reach your API. Synthetic monitoring bridges this gap by acting as an external consumer. It tests the entire request chain, including DNS, SSL termination, and load balancer configuration. For comprehensive GraphQL API health checks, these monitors must go beyond basic GET requests.
GraphQL requires a POST request with a specific JSON body. A standard uptime check that only looks for a 200 OK status will miss internal resolver failures. Reliable monitoring also requires testing from multiple geographic regions. If your users are global, your monitors should be too. Choosing between EU and US hosting for your monitoring nodes helps you verify regional latency while maintaining compliance with data sovereignty requirements.
Handling authentication is a critical hurdle for synthetic probes. Most production APIs require a JWT or a static API key in the Authorization header. Your monitoring tool must support custom headers and secure secret management. This allows the probe to mimic a legitimate client, ensuring your GraphQL API health checks aren't blocked by your own security middleware or rate limiters designed to stop anonymous traffic.
Selecting a "Canary" Query
A good canary query should be lightweight but representative. You want to trigger the GraphQL execution engine without taxing your database. A common approach is querying the schema's root type using { __typename }. This confirms the server is parsing queries correctly. However, many teams disable introspection in production for security reasons. This makes the __typename query less reliable as a universal health signal.
In these cases, a dedicated healthCheck resolver is more effective. This resolver can perform a simple "SELECT 1" or check a Redis heartbeat. It provides a deeper signal than a static type query. By using a specific field designed for monitoring, you can isolate the health of the API layer from the complexity of your business logic.
Validating the Response Body
The core of semantic monitoring is body assertion. Your monitor must look for the absence of the "errors" key in the JSON response. If that key exists, the check should fail even if the HTTP status is 200. You should also validate specific data paths. For example, if you query a systemStatus field, assert that it returns "OPERATIONAL" rather than a null value.
Latency is the final metric to watch. Traditional pings measure network round-trip time. Synthetic API monitoring measures the time it takes for the GraphQL engine to actually resolve the query. High latency in the execution phase often indicates unoptimized resolvers or bottlenecked downstream services. Tracking these metrics from external nodes ensures your performance data reflects the real-world experience of your consumers.
Schema-Aware Health Checks: Validating Data and Latency
Setting up semantic GraphQL API health checks is a continuous validation of your data contract. It isn't enough to know the server process is running; you must know the schema is resolving correctly. If you rename a field without a deprecation period, your internal probes might pass while your external consumers fail. A schema-aware monitor acts as a final integration test in your production environment.
Step 1: Define the Minimal Representative Query
Don't just query __typename. You need a query that exercises a real path without creating heavy load. A dedicated health resolver is the most reliable approach. It should verify that the execution engine and the primary data source are both functional. This query should be part of your standard monitoring suite.
query HealthCheck {
  systemStatus {
status
databaseConnected
  }
}
Step 2: Configure Semantic Assertions
Assertions are your defense against the "200 OK" lie. Your monitoring tool must validate the response structure. A healthy response should meet these specific criteria to be considered operational:
- HTTP Status: The response must return exactly 200.
- Errors Array: The
errorskey must be absent from the JSON response body. - Data Integrity: The value at
data.systemStatus.statusmust match your expected string, such as "ok".
Step 3: Establish Latency Baselines
Latency in GraphQL is more than just network round-trip time. It includes the execution time of your resolvers. You should track P99 latency to detect performance regressions. If a simple health check suddenly spikes from 40ms to 400ms, it often signals resource contention or N+1 issues in your resolver logic. Use these metrics to set thresholds for "Degraded" versus "Down" states, as detailed in this guide on API Monitoring: The Developer’s Guide to High Availability in 2026.
Automating these alerts ensures you catch introspection failures or schema drifts immediately. Manual testing is too slow for modern CI/CD pipelines. You can configure automated GraphQL health checks to run every minute from multiple regions. This ensures your data layer remains as responsive as your network layer, providing a reliable signal for your status page and incident management workflow.
StatusPulse: Native API Monitoring for Modern GraphQL Stacks
Monitoring a complex schema shouldn't require a complex platform. StatusPulse is designed to handle the specific requirements of GraphQL API health checks by treating POST bodies and JSON assertions as first-class citizens. Instead of forcing you to write custom scripts or manage heavy infrastructure, the platform provides a native interface for defining queries and validating the absence of error arrays. This ensures your monitoring reflects the actual data availability your users experience.
Regional latency is often the invisible killer of GraphQL performance. Because nested queries can trigger multiple downstream requests, a small increase in network latency can snowball into a significant delay for the end user. StatusPulse allows you to verify regional performance by hosting monitoring nodes in both the EU and US. This choice supports data sovereignty while providing the technical precision needed to track P99 latency across different geographic markets.
External Validation Without the Bloat
Our philosophy focuses on technical depth rather than corporate bloat. Many industry incumbents like Datadog [VERIFY: competitor Datadog entry price for API monitoring] bundle API monitoring into expensive, multi-product suites that require significant configuration. We offer a focused alternative with flat pricing and no per-subscriber fees. This makes it easier to scale your monitoring as your graph grows without worrying about unpredictable cost functions.
- 60-Second Setup: Configure a monitor by entering your endpoint, query, and expected JSON path.
- Native Assertions: Built-in logic to fail checks if the
errorskey is present, even on HTTP 200. - Integrated Status Pages: Automatically sync your monitoring results with a public status page to keep users informed.
Transparent Incident Communication
When a resolver fails, the most important action is clear communication. We believe "Honesty as a Service" is the only ethical way to manage an API. If your GraphQL API health checks detect a partial outage, StatusPulse closes the loop by turning those failures into honest status page updates. This reduces the stress on your support team and builds long-term trust with your API consumers.
Technical incidents are often difficult to explain to non-technical stakeholders. Our AI incident management assistant helps bridge this gap by summarizing the impact of specific resolver failures into plain-spoken language. It can draft technical post-mortems and status updates that respect the reader's time. For a deeper look at our approach, read about The Architecture of Incident Communication Transparency. By combining precise monitoring with human-centric communication, you can manage the complexities of GraphQL with quiet confidence.
Securing Your Data Contract with Semantic Validation
Relying on network-level signals in a GraphQL environment is an operational risk. You've seen how internal readiness probes and external synthetic monitors provide the visibility needed to catch silent failures. By moving your GraphQL API health checks from simple pings to schema-aware assertions, you ensure that "200 OK" actually means your users are receiving data. This approach reduces mean time to detection and prevents "zombie" services from lingering in your production clusters.
Effective monitoring should be straightforward and ethically priced. StatusPulse provides native support for complex POST bodies and regional latency tracking from EU or US nodes. You can manage your API lifecycle with quiet confidence by utilizing flat pricing and AI-powered incident management for faster communication. It's time to treat your graph with the technical precision it requires.
Start monitoring your GraphQL API with StatusPulse today and build a more resilient platform for your consumers.
Frequently Asked Questions
Why does my GraphQL API return 200 OK when it fails?
Your GraphQL server returns a 200 OK because the HTTP status code only represents the success of the transport layer. If the server process is running and can receive a POST request, the network layer considers it a success. However, the application layer might still fail to resolve data. You must inspect the JSON response body for an errors array to determine the true health of the service during GraphQL API health checks.
Should I use GET or POST for GraphQL health checks?
Use POST requests for semantic health checks. While GET requests are suitable for simple liveliness pings to a dedicated health route, POST requests allow you to send a valid GraphQL query. This triggers the full execution engine and validates that your resolvers are functioning. By mimicking real client traffic, you ensure that your monitoring covers the actual path your users take when interacting with your schema.
How often should I run a GraphQL health probe?
Monitoring frequency depends on your recovery targets. For external GraphQL API health checks, a 60-second interval provides a good balance between detection speed and resource consumption. Internal container probes often run every 10 seconds to trigger fast restarts. Be careful with deep queries; running complex checks too frequently can put unnecessary strain on your database or cache, potentially causing the very downtime you are trying to monitor.
Is it safe to leave introspection enabled for health checks?
Disabling introspection in production is a standard security practice to prevent unauthorized schema discovery. You don't need it enabled for monitoring. Instead, define a specific health resolver in your schema that returns a simple scalar or object. This allows your monitoring tool to verify the execution path without exposing your full API structure. It is a more secure and efficient way to handle production probes.
What is the difference between a liveliness and a readiness check in GraphQL?
A liveliness check tells your orchestrator if the process needs a restart because it has crashed or deadlocked. A readiness check determines if the service should receive traffic from the load balancer. In a GraphQL context, readiness involves verifying that your database, cache, and authentication services are reachable. If a dependency is down, the service is "alive" but not "ready," and should be temporarily removed from the rotation.
How do I monitor GraphQL latency effectively?
Effective latency monitoring requires tracking P99 execution times for representative queries. Since GraphQL allows for varying query complexity, averages are often misleading. You should measure the duration of the execution phase specifically to isolate resolver performance from network overhead. Tracking these metrics from multiple regions, such as the EU and US, helps you identify if high latency is caused by geographic distance or unoptimized internal database calls.
Can I monitor 3rd party GraphQL APIs with StatusPulse?
StatusPulse supports monitoring for any GraphQL endpoint, including those managed by third-party vendors. You can define the specific POST body and headers required for authentication. By setting custom assertions on the response body, you can detect when a vendor's API is returning errors or experiencing high latency. This allows you to stay ahead of dependency failures and communicate impact to your stakeholders through your status page.


