

Most engineering teams still treat an outage as a temporary connectivity blip. In reality, the true website downtime risks run much deeper than immediate lost revenue. An outage is a compounding breakdown of system integrity, search engine visibility, and engineering morale. You already know the exhaustion of on-call shifts, especially when up to 97% of monitoring alerts turn out to be non-actionable noise. Explaining to executive leadership why a cascading API timeout degraded the customer experience is never a simple conversation.
You don't need another theoretical lecture on high availability. You need a grounded approach to protect your infrastructure, your team, and your bottom line. In this guide, you will get a clear framework to quantify downtime costs, identify the technical mechanisms behind silent SEO decay, and cut your Mean Time to Recovery (MTTR). We'll also break down how to implement reliable synthetic monitoring that detects critical gray failures without triggering false alarms.
Key Takeaways
- Modern downtime rarely presents as a flatlined server; gray failures and latency spikes degrade user trust just as severely as complete outages.
- Evaluate hidden website downtime risks like crawl budget exhaustion and search engine de-indexing caused by unhandled 5xx response codes.
- Differentiate between MTTD and MTTR to isolate the exact bottlenecks where your incident response pipeline drains engineering hours.
- Use a five-part calculation model to measure the total financial fallout of an incident, including responder toil and contractual SLA penalties.
- Protect team health by replacing fragmented, noisy alert systems with focused multi-region monitoring and automated incident communication.
Defining Website Downtime in 2026: Beyond the 404 Error
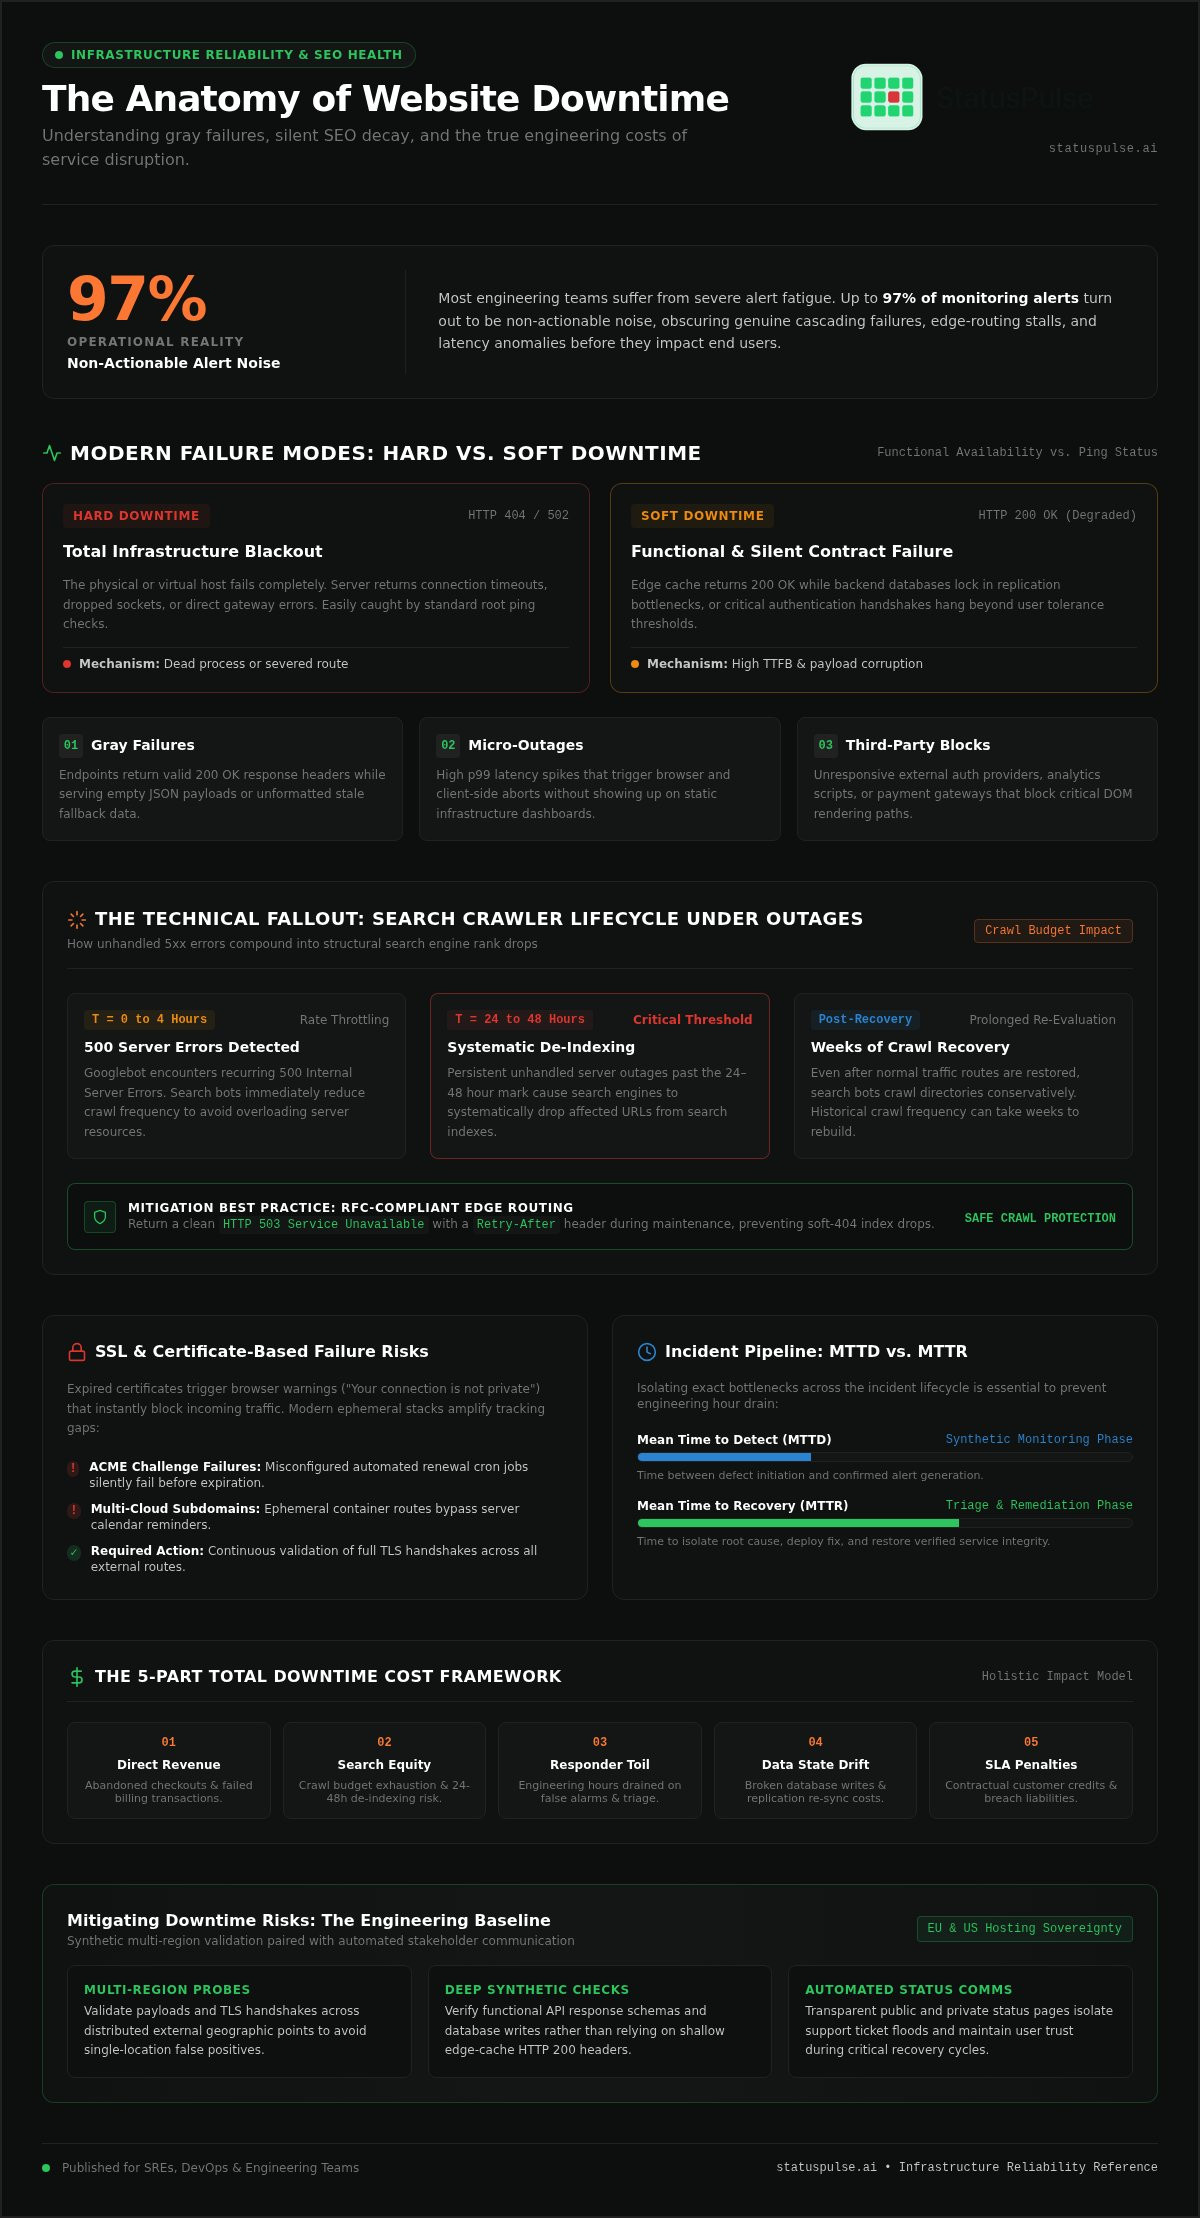
Downtime is no longer just a dead web server returning an HTTP 404 or 502 Bad Gateway. In modern architectures, downtime is any state where a system fails to meet its functional contract with the end user. If a customer cannot complete an authentication handshake, process a checkout payment, or retrieve account records within an acceptable window, the service is effectively down.
Binary availability checks misrepresent this reality. A ping check might return an HTTP 200 status code from an edge cache while the origin database is locked in a replication bottleneck. Traditional infrastructure metrics classify that page as online. The user experiencing a 30-second Time to First Byte (TTFB) classifies it as broken. Distinguishing between hard downtime (total infrastructure failure) and soft downtime (severe degradation) is critical when evaluating real-world website downtime risks. According to industry classifications of unplanned downtime, service disruption occurs whenever an application is unavailable for operational use, regardless of whether the root cause is network connectivity or application latency.
The Rise of Partial Outages and Degraded Performance
Modern web systems rely heavily on microservices and external dependencies. A failure in a single upstream API can cripple downstream services. For instance, if an address-verification endpoint hangs, your checkout flow stalls. Latency spikes act as functional failures; when page responsiveness degrades past normal thresholds, users abandon sessions long before a connection times out. Synthetic tests that only validate the root domain fail to catch these localized degradations.
- Gray failures: Endpoints return 200 OK headers while serving empty JSON payloads or stale fallback data.
- Micro-outages: High p99 latency spikes that trigger client-side aborts without showing up on static infrastructure dashboards.
- Third-party choke points: Unresponsive analytics scripts, external auth providers, or payment gateways that block DOM rendering.
SSL and Certificate-Based Risks
Few events erode user confidence as quickly as an expired SSL/TLS certificate. The resulting browser warning, such as "Your connection is not private," blocks incoming traffic completely. This represents an entirely self-inflicted category of website downtime risks.
Automated environments make certificate tracking more complex, not simpler. Ephemeral containers, subdomains provisioned across multi-cloud regions, and short certificate validity windows create tracking gaps. A misconfigured automated renewal cron job or an unhandled ACME challenge failure will silently drop an entire domain offline once the active certificate hits its expiration timestamp. Monitoring must validate the full TLS handshake across every external route, rather than relying solely on server calendar reminders.
The Technical Fallout: SEO Decay and Data Integrity Risks
When an application fails, revenue loss is immediate. The deeper engineering damage happens quietly beneath the surface. Unhandled 5xx errors corrupt search crawler relationships, while broken database writes introduce state drift that takes days to reconcile. These operational blind spots represent the most expensive website downtime risks your team will face.
Search crawlers don't wait for your on-call rotation to finish triage. When Googlebot encounters recurring 500 Internal Server Error responses, it rapidly reduces crawl rate to avoid overloading your server. As detailed in the Google Search Central documentation on HTTP status codes, persistent server outages past the 24 to 48-hour mark cause search engines to systematically drop affected URLs from search indexes. Serving a generic error or a misconfigured 200 OK soft-404 during maintenance accelerates this index decay. If your service must go down, configure edge proxies to return a clean 503 Service Unavailable header paired with an RFC-compliant Retry-After timestamp.
SEO Impact: Crawl Budget and SERP Volatility
Crawler confidence drops faster than organic rankings recover. Even after traffic routes normalize, search bots test affected directories conservatively. Recovering historical crawl frequency often requires weeks of consistent uptime. Implementing robust website uptime monitoring tools helps teams detect edge-routing failures before search crawlers encounter unhandled 5xx responses across critical landing pages.
Data and Transactional Risks
Distributed applications face severe consistency challenges during unexpected disconnections. When network partitions isolate an active primary database, split-brain scenarios can allow writes to proceed across divergent replicas. Once the cluster recovers, automated reconciliation scripts often drop conflicting transactions, resulting in silent data loss.
- Read-replica lag: Stale caches serve outdated inventory or authentication states while replicas sync.
- Thundering herd problems: Resurrected nodes trigger retry storms that crush upstream database connection pools.
- Mid-flight dropouts: Dropped socket connections during multi-step checkout processes cause orphaned payment authorizations.
Downtime also serves as an effective distraction for targeted intrusion. Adversaries frequently launch volumetric DDoS floods to mask credential stuffing or SQL injection attempts against internal management endpoints. Dedicated API monitoring validates payload integrity and response schemas directly, ensuring background microservices process state changes reliably. For teams looking to eliminate monitoring blind spots across regions, configuring a straightforward telemetry stack through StatusPulse helps isolate service degradation before data layers fall out of sync.
The Human Cost: Brand Erosion and Engineering Burnout
Technical postmortems routinely focus on database locks, network drops, and corrupted records. They almost never account for the psychological toll on responders. Beyond the immediate technical hitches, the most damaging website downtime risks accumulate within your team's culture and your customers' trust. Ignoring this reality turns every incident into an internal morale crisis.
When an outage strikes, silence is toxic. Leaving users in the dark forces them to assume the worst, whether that means a complete operational collapse or a data breach. The true cost of downtime extends past immediate revenue loss into compounding customer churn and employee attrition. Research from Catchpoint and PagerDuty indicates that 67% to 70% of Site Reliability Engineers report on-call stress and high alert volumes accelerate career burnout. Engineering leadership cannot treat responder stamina as an infinite resource.
Customer Trust and the Churn Correlation
Customers forgive technical failures far more readily than they forgive dishonesty. A public status page transforms an outage from a perceived organizational failure into a controlled maintenance process. Embracing incident communication transparency provides customers with verified status updates, keeping support queues manageable and preserving account lifetime value (LTV) during unexpected downtime.
Alert Fatigue and Team Health
Modern enterprise monitoring often generates between 500 and 1,200 alerts daily. Industry benchmarks show that only 3% of these signals require human intervention. The remaining 97% is actionable-free noise that fractures focus. Waking an on-call engineer at 3 AM for a self-healing memory blip degrades performance during real production emergencies.
- Cognitive overload: Responder fatigue increases the probability of human error during production rollback procedures.
- Engineering toil: Teams spend up to 30% of their working hours on repetitive operational firefighting rather than resilient architecture.
- Communication burden: Drafting stakeholder explanations while diagnosing root causes splits developer attention when seconds count.
Protecting developer retention requires shifting from chaotic reactive alerts to reliable, synthetic uptime monitoring. Using AI incident management to draft factual incident updates frees engineers to concentrate exclusively on remediation. When monitoring tools operate calmly, your team can resolve production incidents without unnecessary panic.
Quantifying the Risk: Calculating the True Cost of an Outage
Citing generic analyst estimates like "$5,600 per minute" rarely convinces a finance director to approve reliability infrastructure. Different architectures and traffic profiles carry vastly different exposures. To evaluate real website downtime risks, engineering leadership must model the technical, human, and contractual fallout using an objective calculation.
A realistic baseline models total incident cost across five distinct variables:
Total Cost = Direct Lost Revenue + Productivity Loss + Recovery Labor + SLA Penalties + Post-Outage Churn
Direct revenue loss represents the hourly gross run-rate scaled by the percentage of affected routes. Operational recovery labor equals responding engineers multiplied by their loaded hourly rate across the active incident window. If an outage breaches customer agreements, contractual service credits apply immediately. When unhandled outages persist, the downstream churn significantly outweighs the initial technical loss.
The Downtime Cost Matrix
The financial impact of degraded performance varies across business models:
| Business Model | Primary Failure Bottleneck | Direct Financial Impact | Hidden Operational Tax |
|---|---|---|---|
| SaaS Platforms | Authentication & API Gateways | Breached customer SLAs; credit payouts | Account renewals stall; customer success queues swamp |
| E-commerce | Cart & Checkout Services | Immediate cart abandonment; lost sales | Paid ad spend wasted on non-converting traffic |
| FinTech / APIs | Data Ingestion & Transaction Pipelines | Transaction timeouts; regulatory scrutiny | Manual ledger reconciliation; audit compliance fines |
The gap between availability tiers illustrates the financial stakes. Operating at "Three Nines" (99.9% uptime) permits roughly 8.76 hours of downtime per year. Moving to "Five Nines" (99.999% uptime) restricts total yearly downtime to approximately 5.26 minutes. Bridging that gap requires significant architectural investment, but unmanaged downtime carries an even heavier opportunity cost: product teams freeze feature roadmaps to rebuild broken data pipelines.
Measuring MTTR and Response Efficiency
Financial exposure during an incident is directly governed by your response pipeline. Teams frequently confuse Mean Time to Detect (MTTD) with Mean Time to Recovery (MTTR). MTTD represents the lag between a production failure and an engineer confirming the issue. MTTR measures the total time required to triage, patch, and verify the service.
Automated checks compress MTTD from hours to seconds. However, MTTR often stretches when engineers waste critical minutes fielding internal panic and drafting customer updates. Foundation-level website availability monitoring eliminates discovery lag. Pairing accurate synthetic detection with an AI incident assistant lets machines draft initial incident reports, freeing engineers to focus entirely on recovery. To protect your SLA commitments without adding notification overhead, create an account with StatusPulse to unify your monitoring and status communication.
Mitigating Website Downtime Risks with StatusPulse
Tool sprawl creates blind spots. When teams stitch together disconnected tools for ping tests, endpoint checks, certificate alerts, and incident communication, critical alerts slip through the cracks. Unifying these functions into a single system reduces operational friction and mitigates website downtime risks before degraded components impact production workloads.
StatusPulse approaches monitoring with straightforward mechanics and transparent operations. It replaces bloated enterprise software with clean, purpose-built tooling designed for developers, DevOps teams, and SREs who value reliability over marketing fluff.
Consolidating Your Monitoring Stack
Managing separate vendors for uptime checks, SSL monitoring, and public status pages introduces unnecessary overhead. StatusPulse brings HTTP availability, synthetic API multi-step checks, and TLS certificate tracking into one focused dashboard. Alerts dispatch instantly through webhook integrations, Slack, or Discord channels so your on-call team can isolate failures immediately.
- Quiet alerts: Intelligent thresholds prevent non-actionable ping drops from waking up engineers.
- Integrated status pages: Public and private status pages keep users informed without requiring manual HTML editing during an incident.
- AI Incident Management: Built-in AI drafts technical, factual incident summaries from system telemetry, leaving the engineer with a simple review-and-publish action.
Unlike legacy incumbents that attach punitive per-subscriber fees to status updates, StatusPulse offers flat, transparent pricing. You can communicate with your entire user base during an outage without calculating notification overage bills.
EU-Based Reliability for Global Teams
Regulatory mandates like NIS2 and DORA have turned telemetry handling into a strict legal requirement. Cross-border metadata transfers present compliance risks for engineering teams operating under GDPR. StatusPulse supports data sovereignty by giving teams the flexibility to select either EU or US hosting for their monitoring data, status pages, and subscriber lists.
You don't need complex enterprise tiers to achieve reliable high availability. You need precise synthetic testing, automated incident drafting, and clear public communication. Start monitoring with StatusPulse to give your infrastructure the quiet, dependable oversight it needs.
Taking Control of Your Reliability Architecture
System availability is fundamentally about protecting trust. Unplanned disruptions do far more than halt web traffic; they drain responder morale, degrade search visibility, and break user confidence. Actively managing website downtime risks lets you replace panic-driven firefighting with predictable, structured resilience.
You don't need complex enterprise contracts or punitive notification surcharges to keep stakeholders informed. StatusPulse pairs targeted synthetic checks with flat, transparent pricing and zero per-subscriber penalties. With dedicated EU and US hosting options to maintain strict data sovereignty, alongside AI-powered incident drafting that cuts reporting friction during active triage, your team stays in control.
Reliable infrastructure starts with honest communication. Give your engineers the breathing room they need to solve problems rather than field status queries. Build trust with StatusPulse: Start your status page today.
Frequently Asked Questions
What is the most common cause of website downtime?
Human error and configuration mistakes account for the vast majority of outages, easily surpassing physical hardware failures. In distributed cloud environments, unhandled DNS changes, bad production deployments, and expired SSL certificates trigger immediate disruptions. Upstream microservice timeouts and database deadlocks also cause severe partial failures. Testing configuration scripts in staging environments and monitoring end-to-end user paths helps teams catch these issues before they hit production routes.
How much does a typical website outage cost a small business?
While enterprise outages command major headlines, smaller organizations face severe financial strain when services fail. Industry research from ITIC indicates that revenue-critical outages for businesses with fewer than 25 employees average approximately $1,670 per minute. That baseline compounds rapidly once you calculate abandoned transactions, engineer remediation wages, customer support ticket spikes, and the long-term cost of account churn.
Can downtime affect my website’s SEO rankings permanently?
Prolonged or recurring downtime can inflict lasting damage on your search visibility. Googlebot tolerates brief connectivity hitches, but unhandled 5xx server errors lasting past 24 to 48 hours prompt search engines to drop affected URLs from search indexes. Crawl rates also drop sharply. Mitigating these website downtime risks requires configuring edge proxies to return a clean HTTP 503 response paired with a Retry-After header during maintenance windows.
What is the difference between uptime monitoring and status pages?
Uptime monitoring is the internal telemetry engine that runs automated synthetic checks against your endpoints, APIs, and SSL certificates to detect disruptions. A status page is an external communication tool that translates that telemetry into public or private service health updates for users and stakeholders. Synthetic monitors alert your on-call responders, while status pages deflect support ticket surges and build customer trust through open incident updates.
Is it possible to achieve 100% uptime?
Over a long operational lifespan, 100% availability is statistically impossible. Third-party cloud providers, internet transit routes, and software patches inevitably introduce variables outside your direct control. Most teams target high-availability thresholds like "Four Nines" (99.99%) or "Three Nines" (99.9%), balancing uptime commitments against the capital cost of distributed infrastructure. Focus on minimizing your Mean Time to Recovery (MTTR) rather than chasing theoretical perfection.
How do I reduce alert fatigue for my DevOps team?
Reduce alert fatigue by adjusting threshold rules, eliminating non-actionable checks, and suppressing transient network hiccups. Up to 97% of enterprise monitoring notifications represent operational noise that doesn't need immediate human intervention. Consolidate your synthetic checks into a single system that validates errors from multiple global locations before waking an engineer. Utilizing AI incident management to draft preliminary incident reports also reduces cognitive pressure during active triage.
Does hosting location (EU vs US) matter for monitoring tools?
Hosting location directly affects regulatory compliance and data sovereignty. Under European standards like GDPR, DORA, and NIS2, system telemetry, incident records, and subscriber notification lists are subject to strict data handling requirements. Choosing a monitoring provider that offers dedicated EU or US hosting options ensures your operational metadata complies with regional data residency mandates without compromising your observability pipeline.
What should be included in a technical incident report?
A technical incident report should document the event timeline, root cause, total outage duration, and affected systems. It must detail operational response metrics like Mean Time to Detect (MTTD) and Mean Time to Recovery (MTTR), followed by actionable architectural changes designed to prevent recurrence. Documenting failures methodically allows engineering teams to resolve underlying vulnerabilities while managing website downtime risks across future production deployments.


