

What if your 99.9% uptime claim is technically inaccurate because your current monitoring tool ignores the micro-outages that frustrate your users? SLA monitoring tools are specialized platforms that execute synthetic checks from multiple global regions to verify contractual uptime commitments and generate audit-ready compliance reports. They provide the defensible telemetry needed to manage error budgets and meet regulatory requirements like DORA or NIS2.
Manual reporting is a significant drain on engineering time. You've likely felt the stress of missing a "three nines" target because of a configuration error or a generic monitor that missed a service flap. It's a common frustration in a market dominated by overpriced, bloated platforms that value flash over integrity. We'll show you how to evaluate tools that provide high-frequency monitoring and automate customer reports without corporate bloat. You'll learn to reduce overhead using AI-assisted incident updates and integrated status pages. This guide focuses on technical precision and transparency. We'll help you maintain compliance while choosing between EU or US hosting for data sovereignty.
Key Takeaways
- Distinguish between internal objectives and contractual agreements to ensure your engineering team has a buffer before financial penalties apply.
- Evaluate sla monitoring tools based on their ability to execute synthetic checks from global regions that mirror your actual user distribution.
- Prioritize long-term data retention to provide audit-ready evidence for regulatory compliance under frameworks like DORA and NIS2.
- Automate incident communication using AI-drafted summaries to reduce manual overhead and maintain transparency during service disruptions.
- Select platforms that offer dedicated EU or US hosting to meet data sovereignty requirements while avoiding the subscriber-based pricing models of legacy tools.
Beyond Uptime: Defining SLA Monitoring for Modern SaaS
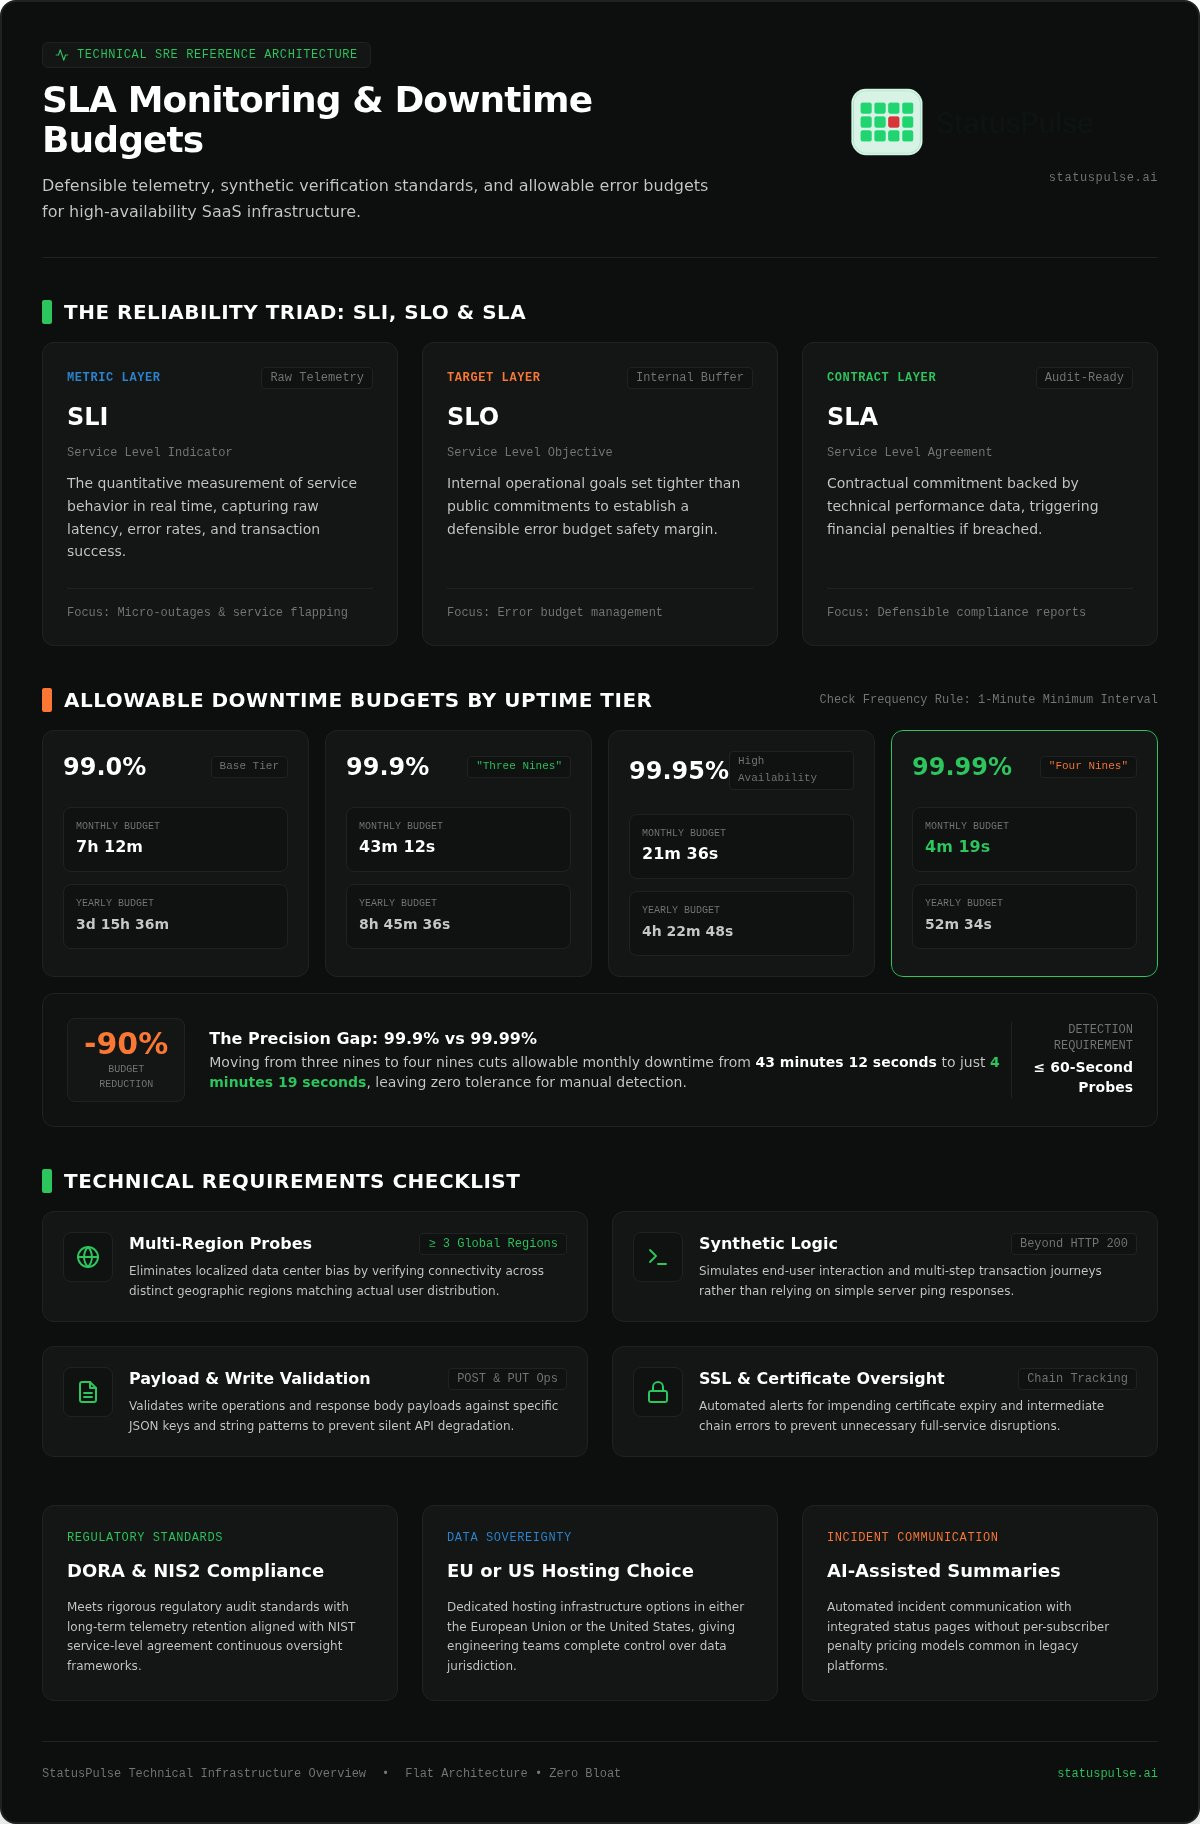
A simple HTTP 200 check isn't an SLA strategy. While basic uptime monitors tell you if a server is responding, sla monitoring tools must provide a defensible audit trail that holds up during a contract dispute. An SLA is a contractual commitment backed by technical performance data. To build this, you need a clear view of your allowable downtime budgets across different service tiers.
| Uptime SLA | Monthly Downtime Budget | Yearly Downtime Budget |
|---|---|---|
| 99.0% | 7 hours, 12 minutes | 3 days, 15 hours, 36 minutes |
| 99.9% ("Three Nines") | 43 minutes, 12 seconds | 8 hours, 45 minutes, 36 seconds |
| 99.95% | 21 minutes, 36 seconds | 4 hours, 22 minutes, 48 seconds |
| 99.99% ("Four Nines") | 4 minutes, 19 seconds | 52 minutes, 34 seconds |
The technical foundation of these budgets relies on three pillars. Service Level Indicators (SLIs) are the raw metrics, such as request latency or error rates. Service Level Objectives (SLOs) are the internal targets your team aims for. Finally, the Service Level Agreement (SLA) is the external promise made to your customers. Understanding these service-level agreement principles is vital for any SRE team. Most teams set their SLOs tighter than their SLAs to create a safety margin, or "error budget," before financial penalties apply.
The Math of Downtime: 99.9% vs 99.99%
The difference between "three nines" and "four nines" is massive. As shown in the table, a 99.9% target allows for over 43 minutes of downtime per month. If you move to 99.99%, that budget shrinks to just 4 minutes and 19 seconds. This 90% reduction in allowable error leaves zero room for manual detection. Micro-outages and service "flapping" often go unnoticed by generic monitors but quickly drain these budgets. To track a 99.9% SLA accurately, 1-minute check intervals are the absolute minimum requirement. Anything slower is risky. You'll miss short bursts of packet loss that technically violate your contract.
SLIs vs SLOs: Building a Defensible Framework
Effective monitoring requires choosing the right SLIs. Raw availability is a start, but latency and successful transaction rates provide a clearer picture of user experience. Your framework must also account for planned maintenance. A robust uptime monitoring strategy differentiates between a scheduled window and an unexpected infrastructure failure. Internal dashboards should show real-time SLI fluctuations, while external reports provide the high-level compliance data your customers expect. This distinction prevents corporate bloat in your communication while maintaining technical depth for your engineers.
Technical Requirements for SLA Monitoring Tools
Monitoring from a single data center is a technical liability. If your primary probe is in the same cloud region as your infrastructure, you'll miss localized routing issues that affect users in other geographies. Professional sla monitoring tools solve this by utilizing a distributed network of probes. This ensures your uptime data reflects the actual connectivity of your global user base, not just your internal network status.
This level of rigor aligns with NIST service level agreement standards, which require providers to maintain continuous oversight of service commitments. To ensure your monitoring provides defensible data, evaluate your stack against this technical checklist:
- Multi-Region Probes: Execution of checks from at least three distinct geographic regions.
- Synthetic Logic: Transactions that simulate user behavior, rather than simple pings.
- Payload Validation: Checking for specific JSON keys or strings in the response body.
- SSL Oversight: Automated alerts for certificate expiry and chain errors.
Basic uptime checks often ignore the health of write operations. Your monitoring should validate POST and PUT requests by checking for specific payload responses. An expired SSL certificate causes an immediate service interruption that is entirely preventable. If you need to track these metrics with precision, you can configure specialized API and uptime monitoring that targets these specific failure points.
Synthetic Monitoring: The Gold Standard for SLAs
Synthetic monitoring is the only way to generate consistent data for an audit trail. Unlike Real User Monitoring (RUM), which depends on active traffic, synthetic checks run at fixed intervals. This provides the "heartbeat" required for compliance. A robust synthetic check should look like this configuration example:
{
  "check_name": "API Order Transaction",
  "method": "POST",
  "url": "https://api.yourdomain.com/v1/checkout",
  "assertions": [
{ "type": "status_code", "equals": 201 },
{ "type": "json_body", "property": "order_id", "exists": true }
  ],
  "timeout_ms": 2000,
  "frequency_seconds": 60
}
Set timeout thresholds that match your latency SLOs. If a request takes 10 seconds to complete, it might technically be "up," but it likely violates your performance agreement.
Global Probe Networks and Latency Tracking
Regional latency varies based on ISP peering and local infrastructure health. Monitoring from multiple global regions prevents false positives and helps identify "silent" SLA breaks that only affect specific cohorts. For a deeper dive into maintaining uptime for complex environments, see our guide on API Monitoring: The Developer’s Guide to High Availability in 2026. By distributing your checks, you gain the transparency needed to manage global service levels effectively.
Evaluating SLA Monitoring Tools: Selection Criteria
Selecting sla monitoring tools requires looking beyond a simple dashboard. You need a platform that provides audit-ready proof for contract renewals and legal reviews. Data retention is a primary hurdle. If a tool only stores logs for 30 days, you cannot prove compliance for a yearly contract. Look for providers that offer at least 12 months of raw data storage to support long-term transparency.
Data sovereignty is another critical requirement for European teams. Many providers default to US-based hosting, which complicates GDPR compliance. A specialized tool should allow you to choose between EU or US hosting to ensure your telemetry data stays within the correct jurisdiction. This choice is a core part of Google's Site Reliability Engineering framework, which emphasizes that reliability and compliance are inseparable.
Audit-Ready Reporting and Data Integrity
Raw data exports are essential for enterprise audits. Your monitoring must be independent of your primary hosting provider; monitoring your infrastructure from the same cloud region is a conflict of interest. If your cloud provider experiences a regional outage, your sla monitoring tools might fail alongside your service. A robust system also needs a way to handle false positives during maintenance. You should be able to flag scheduled windows so they don't count against your uptime percentage.
The "Tax of Complexity" in Enterprise Tools
Avoid corporate bloat. Many enterprise platforms include modules for legacy infrastructure that modern SaaS teams never use. You often end up paying a "complexity tax" for features that slow down your configuration. For instance, legacy all-in-one platforms often demand a significant enterprise investment compared to more focused alternatives that prioritize developer experience.
StatusPulse is designed as a technical peer for DevOps teams. We provide flat pricing without per-subscriber fees. This ensures that communicating an incident to 5,000 customers costs the same as communicating to 50. We believe transparency shouldn't be a line item that punishes your growth. By choosing a tool that focuses on precision rather than feature-creep, you reduce the overhead of managing your service levels.
Implementation: Building an Automated SLA Workflow
Manual workflows fail when systems go down. If your team spends the first twenty minutes of an outage manually updating spreadsheets or Slack channels, you've already lost the battle for transparency. Modern sla monitoring tools must bridge the gap between technical detection and stakeholder communication. Automation ensures that your uptime data flows directly into your reporting stack without human intervention.
Bridging the Gap: Monitoring to Communication
Uptime data without a public status page is only half a solution. Your customers don't care about your internal Grafana dashboards; they need a clear, accessible signal that you're aware of the issue. By connecting your monitoring alerts to a status page, you establish a definitive "Source of Truth." This reduces the volume of support tickets and keeps your engineering team focused on the fix. For a deeper look at this strategy, see The Architecture of Incident Communication Transparency.
Integration with your existing stack is vital. Your monitoring should trigger webhooks that alert PagerDuty or push updates to specific Slack channels. This creates a unified environment where every alert is actionable. It also ensures that the data used for your monthly SLA reports is pulled directly from the source, eliminating the risk of human error in uptime calculations. Automating these reports saves hours of manual labor and provides your clients with audit-ready documentation.
AI-Assisted Incident Management
Writing technical updates during a high-pressure outage is difficult. Engineers often struggle to find the right words while they're debugging a production database. AI-assisted tools can ingest monitoring logs and draft honest, technical summaries for your status page. This isn't about replacing human judgment. It's about providing a technical draft that an engineer can approve or edit in seconds. The AI functions as a technical assistant, allowing the human to maintain final agency over the message.
This approach handles the "stress of the blank page" and ensures consistency across your communication. The AI can also summarize the impact for non-technical stakeholders, translating complex error rates into plain language. If you're looking to automate these workflows, you can start using StatusPulse for AI-powered incident management and integrated status pages. This setup ensures that your communication is as precise as your monitoring without adding corporate bloat to your stack.
StatusPulse: Technical SLA Monitoring Without the Bloat
StatusPulse provides a focused alternative to legacy sla monitoring tools. We don't believe in corporate bloat or hidden fees. Instead, we offer a high-frequency monitoring platform with integrated public status pages. Our system is built for specialists who value technical integrity over flashy marketing. You get the precision you need without the "complexity tax" of enterprise software.
We use a flat pricing model. You won't face a subscriber tax just because your customer base grows. We also respect data sovereignty. You can choose to host your telemetry data in either the EU or the US. This ensures you meet regional regulatory requirements like DORA or GDPR without sacrificing performance. It's a straightforward approach to a complex technical problem.
Monitoring Built for SREs and Developers
Precision is our priority. We offer 1-minute check intervals across our uptime, API, and SSL monitoring services. This frequency allows you to catch failures before they drain your monthly SLA budget. For more on optimizing your stack, read our Website Uptime Monitoring Tools: A Developer’s Guide to 2026 Reliability. We focus on the features that matter to engineers, not the ones that look good on a procurement slide.
Our API-first design means you can integrate StatusPulse into your existing CI/CD pipelines. We provide specialized monitoring for SSL certificates and complex API sequences. These tools act as a fail-safe against preventable downtime. We aren't a managed IT support provider; we're a technical peer providing the data you need to maintain high availability.
Transparent Incident Communication
Closing the loop between detection and communication shouldn't be a manual chore. Our native status pages update automatically when a monitor fails. We've also integrated AI incident management to help you draft technical updates quickly. The tool suggests a summary based on the monitoring logs. You approve the final version. It's a technical assistant that keeps you fast and honest during a crisis.
This all-in-one approach reduces tool sprawl and ensures your customers always have a source of truth. You don't have to sync data between a monitoring tool and a separate status page provider. Everything is integrated, transparent, and built for speed. Ready to simplify your stack? Build your first status page with StatusPulse today.
Future-Proofing Your Reliability Stack
Reliability is a technical commitment. It requires more than a green dashboard; it demands audit-ready data and honest communication. By prioritizing synthetic checks and distributed probe networks, you ensure your sla monitoring tools provide a defensible record of performance. Choosing a platform that respects data sovereignty with EU or US hosting options is no longer optional for modern compliance. It's about building trust through technical integrity.
Transparency should be simple. You shouldn't pay more just because you communicate with more customers. StatusPulse eliminates corporate bloat with flat, transparent pricing and AI-powered incident drafting. It's a tool built by specialists who value precision over marketing hype. You can maintain high availability while keeping your stack lean and your reports accurate. It's time to move away from complex enterprise modules and return to straightforward, reliable monitoring. Your engineering team deserves a tool that speaks their language.
Monitor your SLAs with StatusPulse and start building a more transparent relationship with your users today. You have the technical framework; now you just need the right partner to execute it. Stay focused on your code and let your monitoring handle the rest.
Frequently Asked Questions
What is the difference between uptime monitoring and SLA monitoring?
Uptime monitoring provides a basic signal of whether a service is reachable. In contrast, SLA monitoring is a contractual commitment that requires defensible, long-term data for compliance audits. While a standard monitor might just ping an endpoint, specialized sla monitoring tools track performance over time, accounting for maintenance windows and regional variability. This audit-ready reporting is essential for SaaS providers who'll need to prove they met specific availability targets to their customers.
How often should an SLA monitoring tool check my services?
High-frequency checks are necessary to catch micro-outages that drain your error budget. For a 99.9% uptime target, 1-minute check intervals are the industry minimum. If you use 5-minute intervals, you risk missing short bursts of downtime that technically violate your agreement. StatusPulse supports 1-minute check intervals to ensure your uptime calculations reflect the actual user experience. Slower monitoring leads to inaccurate data and potentially hidden breaches of contract.
Can I use internal monitoring tools like Prometheus for client SLAs?
Internal tools like Prometheus are excellent for debugging, but they shouldn't be the source of truth for customer SLAs. Monitoring your infrastructure from within the same network creates a conflict of interest and misses external routing issues. If your entire data center goes dark, your internal monitor fails with it. External sla monitoring tools provide an independent, third-party verification of your availability that enterprise clients and auditors require for transparency.
What are the most important metrics to track for a SaaS SLA?
Beyond raw availability, you should track request latency and success rates. These are your Service Level Indicators (SLIs). For APIs, validating the response payload is just as important as the HTTP status code. StatusPulse provides these specialized checks, though it's a telemetry platform rather than a managed IT support provider. Tracking these metrics ensures that "slow" states are counted against your SLA, providing a more honest representation of your service's health.
How do I handle planned maintenance in my SLA reports?
Most service level agreements include clauses that exclude pre-scheduled maintenance from downtime calculations. Your monitoring platform should allow you to flag these windows in advance so they don't count against your uptime percentage. This ensures your compliance reports remain accurate and fair. Without this feature, your team faces unnecessary stress from "false" breaches caused by essential infrastructure updates or database migrations that were communicated to your users in advance.
Why is multi-region monitoring critical for SLA compliance?
Users access your SaaS from different global locations, and localized ISP or routing issues can cause regional outages. Monitoring from a single data center might show a "green" status while your customers in another continent see a "red" status. Multi-region monitoring captures these discrepancies, ensuring your SLA data reflects the global reality. It prevents "silent" failures where a significant portion of your user base is unable to reach your services despite your internal servers being healthy.
Do I need a separate status page for my SLA monitoring?
While you can use separate tools, an integrated approach reduces tool sprawl and communication latency. When your monitors detect a failure, your status page should update automatically to maintain transparency. StatusPulse combines uptime monitoring with public status pages and AI-powered incident management. This integration ensures that your customers always have a reliable source of truth during disruptions without requiring your engineers to manually sync data between different platforms during a high-pressure crisis.
How does EU vs US hosting impact my monitoring compliance?
Data sovereignty is a major requirement for European enterprises under regulations like GDPR and DORA. If your monitoring data is stored in the US, you may face compliance hurdles regarding cross-border data transfers. StatusPulse offers a choice between EU or US hosting to ensure your telemetry data resides in the correct jurisdiction. This allows you to meet strict regional regulatory standards while maintaining the high-frequency monitoring needed to prove your service level commitments.


