

A deployment passes its health probe, yet users still encounter errors on a critical route. The endpoint may check a different path or capability from the one users rely on. Health check endpoint monitoring works best when its signal matches the operational decision it is meant to support.
A health endpoint gives automation a concise result about an application’s condition. Its value depends on checks that reflect the service’s real dependencies and disclose only the information needed to interpret the result.
This guide explains what to monitor, how application and dependency signals work together, and how to implement and validate endpoint checks. It also covers common failure modes, so teams can build checks that help diagnose incidents rather than obscure them.
Key Takeaways
- Separate liveness from readiness so a responsive process isn’t mistaken for an application that can safely receive traffic.
- Track application and dependency latency, including P50, P95, and P99, to spot slowdowns that a simple up-or-down response can miss.
- Set bounded dependency checks and define what happens when a check times out, so a slow database doesn’t stall the health response.
- Test how unhealthy nodes affect routing, recovery, capacity, and errors, not just whether the endpoint returns the expected status.
- Use external uptime and API monitoring alongside internal checks to see whether the service is reachable from outside its own environment.
What is Health EndPoint Monitoring Pattern?
A health endpoint gives automation a focused status signal about an application. A load balancer, orchestrator, or external monitor requests it and uses the response to decide whether the service can receive traffic.
Monitoring Tools and Check Frequency
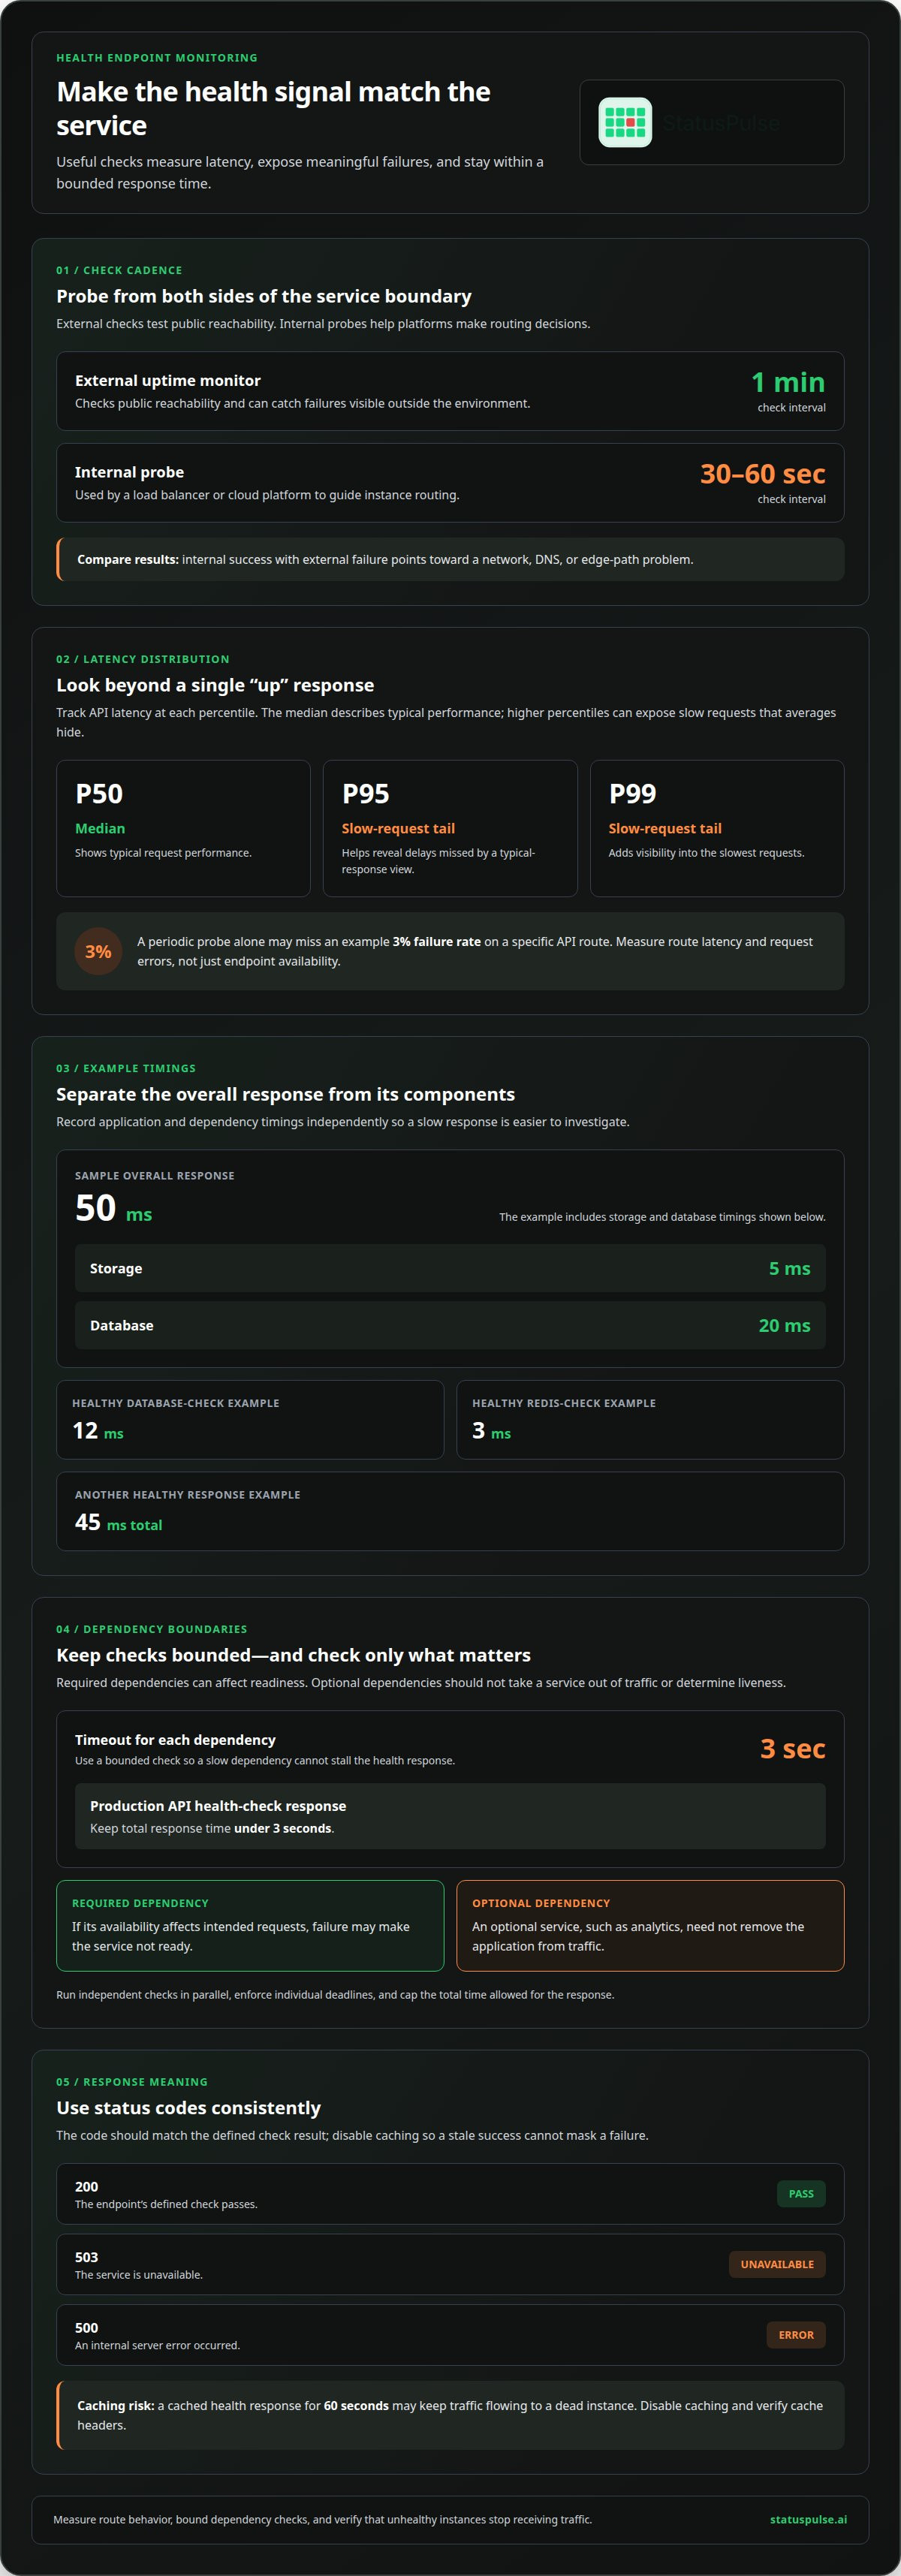
Monitoring tools differ by where they probe: an external uptime monitor tests reachability, while a load balancer or cloud platform checks instances from inside its environment. Use an external check every 1 minute to catch public failures, and internal probes every 30-60 seconds to guide routing. Compare results: an internal success with an external failure points toward network, DNS, or edge-path problems.
Cloud Platform Health-Check Practices
Kubernetes, AWS, and other cloud platforms use health probes to inform restart and traffic-routing decisions. Keep liveness focused on whether the process responds, and use readiness to indicate whether it can safely serve requests. Set the balancer’s threshold and failure response to match the service’s recovery behavior, then test node changes and traffic routing. Avoid letting optional dependencies determine liveness, since an outage could trigger unnecessary restarts.
Keep the response minimal. A public endpoint usually needs a status and, if useful, a brief component label such as database: unavailable. Don’t return connection strings, hostnames, stack traces, build details, user data, or dependency credentials. Such details can help attackers map internal systems. Put deeper diagnostics in separate, access-controlled tools, not the public health path.
Use HTTP status codes consistently: return 200 when the endpoint’s defined check passes, 503 when the service is unavailable, and 500 for an internal server error. A reverse proxy or CDN can undermine that signal by caching a successful response; a cached health response for 60 seconds may keep traffic flowing to a dead instance. Disable caching for health responses and verify the cache headers.
Audit exposure by requesting the endpoint as an unauthenticated public user, then reviewing its status code, headers, and body. Repeat the test through the same path used by the balancer, including HTTP port 80 or HTTPS port 443 where applicable. Check that unauthorized requests reveal no extra fields, and that logs record the probe without storing secrets. This makes the observable response part of the security review.
Validate behavior, not just endpoint availability. Simulate a failed required check and confirm that the endpoint returns 503, the balancer stops routing traffic to that instance, and recovery restores eligibility. Also test whether a stale cached 200 masks the failure. A response schema, expected status, and routing result together show whether the health signal works as intended.
Limit health check endpoints to the minimum status information automation needs. They should not disclose internal state or sensitive details; put diagnostics elsewhere. This boundary gives automation a useful signal without making the health path a window into the application’s internals.
Keep the endpoint separate from administrator access, too. Health check endpoints should not share authenticated paths with administrators or expose the same data as a privileged console. When reviewing access and responses, preserve the distinction: the endpoint reports service health, not an administrative view or additional operational details.
Application and dependency health metrics
A useful health signal combines application performance with the state of required dependencies. Track response latency, dependency-check latency, and failures separately. This helps pinpoint whether a slowdown originates in the application, its database, or another upstream node.
Measure API latency at P50, P95, and P99 for each endpoint. The median shows typical performance; higher percentiles expose slow requests that averages can hide. A route can have a healthy median while a smaller set of requests fails or stalls. A periodic probe alone may miss an example 3% failure rate on a specific API route.
Record checks independently, then compare them with the overall result. A sample response can report 50 milliseconds overall, including 5 milliseconds for storage and 20 milliseconds for the database. Another healthy response example reports 45 milliseconds total. These component timings help separate application processing from dependency latency.
- Application: Track endpoint latency, request errors, and whether the process responds. A liveness check can return HTTP 200 without querying downstream dependencies.
- Database: Record connection success, query completion, and elapsed time. A healthy example reports a database-check latency of 12 milliseconds.
- Cache: Measure whether the cache answers a bounded test operation. A healthy Redis-check example reports 3 milliseconds.
- Capacity: Observe resource pressure alongside latency. The implementation section can use heap or system memory thresholds to define a failure condition.
Check upstream nodes only when their availability affects the application’s ability to serve intended requests. For example, a service that requires database reads may fail readiness if the database is unreachable. An optional analytics service need not take the application out of traffic. This distinction prevents a nonessential dependency failure from causing wider disruption.
Bound every dependency check. Example implementations use a 3-second timeout for each dependency, while a production API health check should keep total response time under 3 seconds. If checks run sequentially, multiple slow dependencies can push the endpoint beyond that limit. Run independent checks in parallel, enforce individual deadlines, and cap the total time allowed for the response.
Report each dependency’s result and latency, but keep the response concise. A database timeout after 3001 milliseconds can produce a total health-check latency of 3004 milliseconds. That difference shows why teams need both component timings and an overall timeout outcome.
Health probes commonly run every 30-60 seconds, but they don’t replace request-level telemetry. Pair endpoint results with route latency and error data to catch failures between probes. When an incident needs a clear customer-facing update, a public status page can communicate service impact without exposing internal dependency details.
Definition and purpose of health check endpoints
A health check endpoint is a machine-readable interface that reports whether an application meets a defined operating condition. Another system uses the result to take a specific action, such as keeping an instance in rotation or marking it unavailable. Treat it as a control signal, not a complete account of system state. Its usefulness depends on whether it matches the decision its consumer needs to make.
Different consumers act on the result in different ways. A load balancer may stop sending new requests to an instance, while an external monitor can report that a public route is failing. An API gateway can use active probes, which generate dedicated probe traffic, or passive checks, which infer health from real traffic to a node. These approaches address related but distinct operational questions.
Choose the endpoint’s purpose by starting with the action. If a gateway should remove a node from routing, define the condition that warrants the change. If an external monitor should alert on a customer-facing outage, test a route that reflects the user’s actual path. A probe that checks only an internal process may succeed while the public route remains inaccessible.
Health-check criteria should reflect technical and business goals. For example, a payment API may need to signal trouble when its payment path cannot accept transactions. A reporting service may still provide value when a nonessential data source is unavailable. The right result depends on the service’s purpose and the consequences of letting requests continue.
Keep the endpoint’s contract stable as the application changes. Define what success means, which consumers use the result, and what action follows each outcome. For example, document whether an unavailable node should leave rotation immediately or trigger an alert for investigation. A clear contract helps teams interpret probe behavior consistently across deployments and incidents.
The endpoint should not replace broader operational review. Health-result history can show when a service changed state, while application logs and metrics provide context for diagnosis. NIST SP 800-53 Rev 5 control AU-6 concerns audit review, analysis, and reporting; operational teams can use health events as one input to review. They still need separate telemetry to understand causes and user impact.
Review the design when routing, dependencies, or service objectives change. Adding a fallback path, for example, may change which failures should affect the endpoint’s result. Revisit the consumer, expected response, and resulting action together. This keeps health check endpoint monitoring useful as the architecture evolves, without turning one route into a substitute for comprehensive monitoring and diagnostics.
Effective routing decisions depend on clear boundaries. Keep liveness, which indicates whether a process is responsive, separate from readiness, which indicates whether a service can safely receive traffic. Each supports a distinct operational decision for your StatusPulse infrastructure.
Health check implementation workflow
Implement a health route, define its expected response, then test how monitoring and alerting handle failure and recovery. Health check endpoint monitoring is useful only when the probe result leads to the intended operational action.
Common Implementation Mistakes
A common mistake is building checks that consume significant resources or depend on unrelated application work. Keep the handler independent of page rendering, user sessions, and expensive data queries. For example, register an Express route before broad catch-all handlers so requests reach the health handler directly.
Framework implementations need to handle errors deliberately. In FastAPI, catch exceptions from asynchronous dependency checks and return a controlled unhealthy result. In Next.js, keep the route handler separate from page components and authentication redirects. Example Node.js and FastAPI memory checks mark the service unhealthy when usage exceeds 90% of the relevant heap or system memory.
Another mistake is returning success when a required check fails. Define the required conditions first, then make the handler return HTTP 503 when those conditions aren’t met. Keep exception text and internal connection details out of the response. Test the deployed route through its actual proxy path, since middleware can change status codes or redirect requests.
Uptime Alerts Setup
Uptime alerts turn probe failures into notifications for the responsible team. Configure an external monitor with the endpoint’s expected status code and a timeout suited to the route. Set alert conditions to distinguish failure from recovery, and direct notifications to the service owner rather than a general channel.
How do I set up health endpoint monitoring with uptime alerts? Configure an external monitor to request the public route, define which response counts as failure, and connect the result to an alert channel. Then simulate a required-check failure and verify that the monitor detects it and notifies the right team.
Test recovery, too. Restore the failed dependency and confirm that the monitor records the endpoint returning to a healthy state. Correlate probe events with request performance and application logs to distinguish an endpoint-specific problem from broader user impact. Health check endpoint monitoring should support diagnosis, not generate alerts without an actionable owner.
Keep alert content focused on the affected route, result, and time of failure. Don’t include secrets or detailed internal diagnostics in notifications. Uptime monitoring can add an external availability view alongside probes running within the application platform.
Database, cache, and external service checks
A dependency check should test the capability your application actually needs. A database connection alone doesn’t prove that required reads work, and a cache connection doesn’t prove that expected keys can be retrieved. Keep each check small, bounded, and representative of how the application depends on that component.
For a database, use a lightweight read against a known health value or a minimal query. Avoid writes that change business data or need cleanup. Record connection failures separately from query failures, since they point to different sources of trouble. A successful connection with a slow query can still degrade application performance.
For a cache such as Redis, check that the client can reach the service and perform the operation the application relies on. If the application uses cache reads but can fall back to a database, cache failure may mean degraded performance rather than total unavailability. Reflect that distinction in the readiness result instead of treating every dependency failure alike.
Apply the same decision logic to external services. A payment gateway may be essential to checkout, while an analytics API may be optional for serving requests. Probe only dependency behavior that affects the service’s ability to operate. Avoid calling costly or state-changing endpoints just to produce a health result.
- Classify: Mark each dependency as required, optional, or degradable for the application’s current function.
- Bound: Apply a timeout to each internal and external request so a stalled dependency cannot hold the health response open.
- Report: Capture dependency name, outcome, and latency in internal telemetry, while keeping public responses minimal.
- Alert: Track dependency failures alongside application error rate, then alert on signals that affect users.
Configuration matters. Use the same connection settings and network route as the running application, but never expose credentials in response bodies or logs. A probe with separate credentials or a different network path can report success while production requests fail. Keep secrets in the application’s normal secret-management path.
Interpret results in context. If database checks fail while application requests still succeed, the service may be serving cached data or using a fallback. If both the dependency probe and relevant API requests fail, the evidence points more directly to an incident. Correlate health results with request latency and error rate instead of relying on a single signal.
Test failure and recovery deliberately. Simulate a database timeout, confirm the check ends within its configured limit, and verify that monitoring records the component-level result. Restore connectivity and confirm the recovery signal appears. For customer-facing impact, connect operational findings with service status reporting, keeping internal diagnostics separate from public updates.
StatusPulse: Uptime Monitoring
StatusPulse offers Uptime Monitoring for teams that need an external view of service availability. It can complement internal health probes by monitoring whether endpoints respond from outside the application environment.
For broader operational visibility, StatusPulse also offers API Monitoring and SSL Certificate Monitoring. Public Status Pages give teams a place to share service updates when an incident affects users. These offerings suit teams seeking endpoint availability checks and customer-facing status communication alongside their own application-level diagnostics.
If this monitoring setup fits your needs, contact StatusPulse to discuss the next step.
Make health signals part of operational ownership
Treat health check endpoint monitoring as an operational contract between an application and the systems that act on its responses. Define which failures should remove an instance from traffic, trigger an alert, or lead to a customer-facing update. Keep that contract aligned with the service as dependencies and deployment architecture change.
Assign an owner to each signal. Application teams can review whether the endpoint still reflects real user impact, while operations teams can confirm that alerts prompt the intended response. Revisit those decisions when a dependency becomes optional, a fallback changes, or a new route enters production. Clear ownership keeps a health signal useful beyond its initial implementation.
StatusPulse offers monitoring and status communication tools for teams that want to connect availability signals with user updates. Talk with StatusPulse about your monitoring setup and decide what fits your operational workflow. A clear, maintained health contract gives your team a practical foundation to build on.
Frequently Asked Questions
What is a health check endpoint and what should it test?
A health check endpoint is an HTTP route that returns a machine-readable signal about an application’s condition. Its checks should match the decision a consumer needs to make. For example, an instance starting up may be alive but not ready until it loads configuration and initializes required clients. Keep startup readiness separate from process liveness so deployment automation can distinguish initialization from failure.
How should health check endpoints be designed for security and reliability?
Design the endpoint to expose only a stable status result, not operational secrets. Use a separate route from administrator functions, and test its response through the same proxy or gateway used by real probes. Reliability also depends on avoiding cascading checks: if the endpoint depends on an optional service, that service’s outage could incorrectly remove healthy application instances from traffic.
What HTTP status codes and response formats should a health endpoint return?
Return HTTP 200 when the check passes, HTTP 503 when the service cannot accept requests, and HTTP 500 for an internal server error. Keep the body small and consistent, such as a JSON object with an overall status and concise component results. Monitoring should evaluate both the status code and response time; a valid body alone shouldn’t override an unavailable response.
What are common health check monitoring failures and false positives?
False positives often occur when a probe runs during startup, a deployment transition, or a temporary dependency slowdown. A check may also fail because the monitor follows a different network path from users, or because a proxy serves stale success data. Compare probe timestamps with deployment events and request errors. If only one dependency fails, check whether it is essential to the affected operation.


