

A green synthetic check doesn’t always mean the whole user journey works. Synthetic monitoring runs automated scripts to simulate user actions and test an application’s availability and performance. An unstable synthetic status means the checks are producing inconsistent results or repeated failures. It’s a signal to investigate, not proof that every user is affected.
That uncertainty can make an alert hard to act on. A service outage may cause the test to fail, but script changes, access restrictions, or inconsistent test conditions can also disrupt results.
This guide explains what synthetic monitoring measures and how to interpret an unstable status. You’ll learn how to analyze failure details, compare results across locations and runs, and use historical trends to distinguish a brief fluctuation from a recurring problem. It also covers the limits of synthetic tests, so you can understand what the signal tells you and what it can’t.
Key Takeaways
- Read failed runs alongside their locations, error details, and history to separate recurring problems from isolated fluctuations.
- Find out where an unstable signal appears and what that status view can, and cannot, tell you about user impact.
- Trace inconsistent results to likely causes, including test-script changes, access restrictions, or variable environments.
- Use repeat runs and historical patterns to judge whether a result is stable before treating it as an application incident.
- See how uptime, API, and SSL monitoring can complement public status pages when you need to track service health and communicate disruptions.
Failure analysis and historical trends
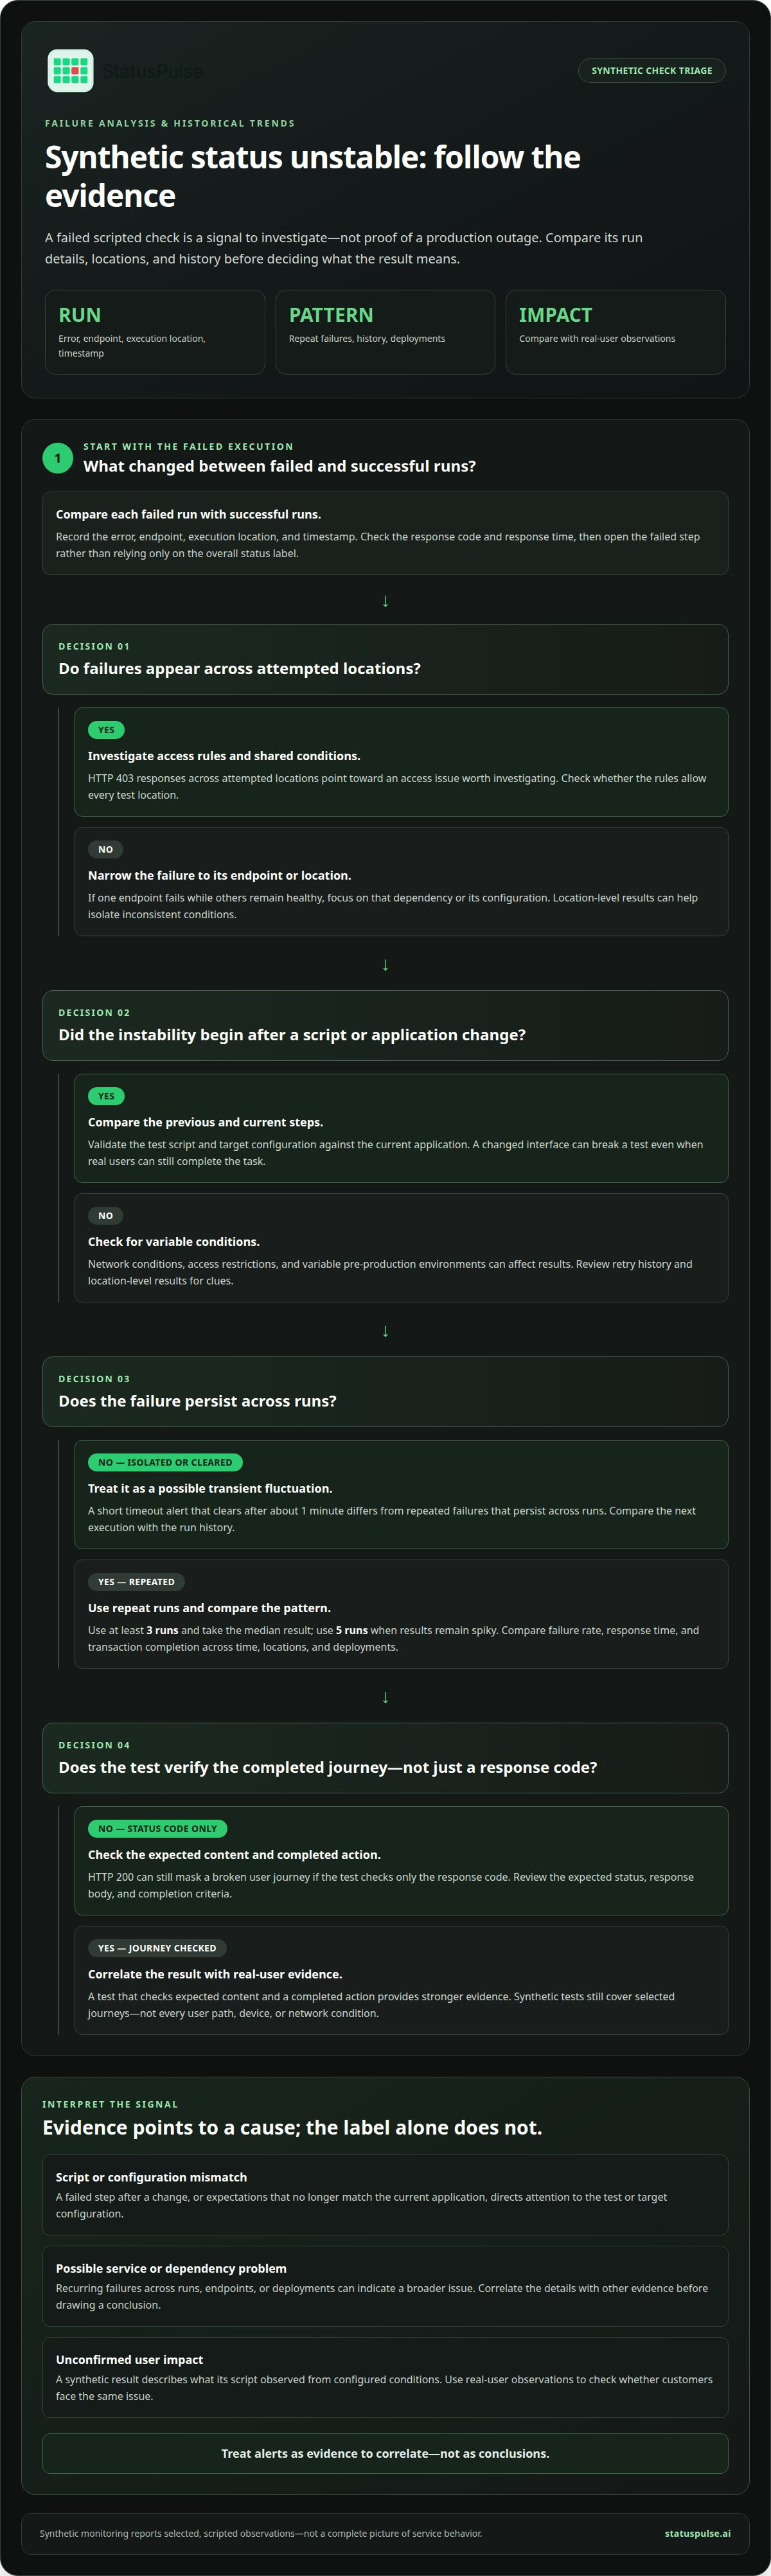
An unstable synthetic result is a signal to investigate, not proof of a production outage. Compare failed executions with earlier runs, locations, and real user evidence to determine whether the cause is the service, test, or configuration.
Causes of Status Instability
Status instability occurs when scripted checks alternate between success and failure or report inconsistent performance. A changed interface can break a test even when real users can still complete the task. Network conditions, access restrictions, and variable pre-production environments can also affect results. Identifying the cause matters: an inaccurate test can waste check capacity and create blind spots.
Persistent Instability Troubleshooting
If the synthetic status is unstable, compare each failed run’s error, endpoint, execution location, and timestamp with successful runs. Then validate the test script and target configuration against the current application, and review whether access rules allow every test location. Platform-specific steps vary, but execution traces, retry history, and location-level results can help isolate failures.
There is no single resolution time: it depends on the cause and when the monitor runs again. A script correction can be assessed on a fresh execution; an access or service configuration change needs the relevant fix before retesting. Use at least 3 runs and take the median result; use 5 runs when results remain spiky.
Errors and Service Outages
Instability can accompany application errors or an outage, but it doesn’t cause one by itself. A monitor’s scripted requests provide observations of the service, rather than a complete picture of its behavior. For example, failed executions returning HTTP 403 across attempted locations point toward an access issue worth investigating. Conversely, HTTP 200 can still mask a broken user journey if the test checks only the response code.
Historical trends make these individual results easier to interpret. Compare failure rate, response time, and transaction completion across time, locations, and deployments. A short timeout alert that clears after about 1 minute differs from repeated failures that persist across several runs. The pattern helps distinguish a transient network event from a regression introduced during deployment.
Group results by endpoint and test version. If one endpoint fails while others remain healthy, focus on that dependency or its configuration. If failures begin after a scripted test or application change, compare the previous and current steps. Synthetic tests simulate selected journeys, not every user path, device, or network condition, so use real user observations to check whether customers face the same issue.
Finally, treat alerts as evidence to correlate, not conclusions. Review the test’s expected status, response body, and completion criteria alongside its run history. A successful status code alone may not validate the transaction; a test that checks the expected content and completed action provides stronger evidence. This proactive failure analysis helps teams target fixes and keep monitoring useful.
Where does the “synthetic status unstable” message appear?
The wording usually appears in the monitoring interface that reports a scripted check’s state. Start with the monitor summary, then open the affected execution to see its result, timestamp, and diagnostic details. A status label is a starting point, not the full failure context.
Monitoring tools can present synthetic results in several views. The exact label and layout depend on the platform, so trace the result back to its individual test instead of treating a banner as a complete diagnosis.
- Monitor overview: A summary can show which check has an unstable state among other monitored tests. Use the check name to identify the endpoint or user journey involved.
- Execution history: Individual runs reveal whether failures are isolated or recurring. Compare the timestamp, location, response code, and measured response time.
- Alert notification: An alert can surface a failed check through the notification channel configured for that monitor. Open the linked result, if available, to inspect the execution rather than relying only on alert text.
- Test configuration: The monitor’s settings show what the scripted check expects. A request expecting HTTP 200, for example, can fail if the endpoint returns a different code.
These views answer different questions. A summary shows which monitor needs attention; execution details show what happened during a particular run. Configuration explains what the test was designed to validate. Separating these layers helps distinguish an application failure from an expectation that no longer matches the endpoint.
For example, an API check might show a failure in its overview while the execution record contains a timeout or unexpected response. A browser test could fail at the login step even though the landing page loads. In both cases, the failed step matters more than the overall label because it points to the affected part of the scripted journey.
Keep the monitoring result separate from customer-facing service communication. A synthetic check reports what its script observed from its configured location and conditions. It does not, on its own, establish how many real users are affected. If investigation confirms an incident, a public status page gives teams a place to communicate service information clearly.
When the wording appears without useful error details, inspect the test’s execution record and configuration together. Confirm which endpoint or browser step failed, what response the script expected, and whether the result repeats across locations. This turns a vague status label into evidence for investigating the affected service or test.
Check whether the recorded result differs from the test’s expectation. Also consider what the check can and cannot establish: synthetic monitoring does not measure subjective aspects of user experience, such as satisfaction or visual design appeal. Its result reflects the scripted checks and conditions, so it is not a complete account of how people experience the site.
Include the configured test location in your assessment. Synthetic test locations should align with the geographic regions where a site’s actual visitors come from. If they don’t, the results may be less relevant to those visitors’ experience. The execution record, test configuration, and location together provide a clearer basis for interpreting the status.
What causes synthetic status to become unstable?
An unstable synthetic result can originate in dependencies or infrastructure beneath the tested page, not just in the application’s visible interface. Examine DNS resolution, certificate validation, API dependencies, and load-related performance separately to identify which layer changes between successful and failed runs. Each layer requires different evidence and investigation.
DNS resolution: A DNS check can fail if a domain’s records contain a configuration error or resolution becomes inconsistent. The browser test may then fail before reaching the application. Compare the recorded lookup result with the destination the check expected. If DNS resolution is the failing layer, application logs may show no corresponding request because traffic never reached the service.
Certificate validation: SSL checks can report a problem when a certificate is invalid or fails the monitor’s validation. A site may still respond over HTTP while secure access fails. Inspect the certificate result separately from page availability. This helps pinpoint a problem in the connection’s security layer instead of treating every failed secure check as an application outage.
API dependencies: An endpoint may rely on another service for data or processing. If that dependency responds slowly or returns an error, the monitored API can become unreliable even while its host remains reachable. Trace the request path and compare the endpoint’s output with the dependency’s behavior. Monitoring third-party performance can also help teams assess service-provider availability against their agreements.
Variable load: Response times can change as demand shifts, especially when an application or its infrastructure approaches a capacity limit. A check may pass under lighter load but exceed its configured performance threshold during a busier period. Compare response-time trends with load conditions and deployment activity. Persistent degradation under comparable conditions can indicate when added resources or infrastructure upgrades may be needed.
Test conditions: A synthetic request runs from selected locations, devices, and network conditions. If these differ from the environment relevant to the check, the result may not represent the experience the team intends to observe. Review the configured execution conditions and the test’s purpose. Synthetic monitoring can establish baselines across times and locations, but its view is limited by those choices.
These causes can overlap. For example, a slow dependency can affect API response time while DNS or certificate validation creates a separate connection failure. Identify the first failing layer in the request path, then compare it with its own evidence. That keeps diagnosis focused on the component producing the inconsistent result.
How can I check whether a synthetic status is unstable
Start by checking whether the monitor measures the user path you care about. A status can look inconsistent when the test scope, execution conditions, or performance threshold don’t match the intended service objective. Review the monitor definition before interpreting the result as evidence of changing application health.
- Match the test to the service objective. For a checkout flow, confirm the script reaches the payment step rather than stopping at the product page. For an API objective, check that the monitored endpoint represents the operation users depend on.
- Review the threshold against a baseline. Compare response time and page-load measurements with expected performance for the same endpoint and location. A threshold set below the service’s ordinary baseline can produce repeated warnings without a corresponding change in user impact.
- Inspect test conditions. Confirm that the selected browser, device profile, network conditions, and location reflect the audience or scenario being tested. A mobile journey and a desktop journey can produce different performance results.
- Check the test’s content assumptions. If the page loads third-party scripts only after cookie consent, make the synthetic journey accept consent. Otherwise, the test may measure a different page from the one users encounter.
Then compare the monitor definition with the relevant service objective. If the objective concerns successful transactions, a page-load check alone is too narrow. A browser test should include the meaningful action, such as submitting a form, while an API test should represent the endpoint’s intended operation. This alignment makes the status more useful for operational decisions.
Check test changes alongside deployment records. Running a synthetic test in a CI/CD pipeline can help validate a release and expose regressions before they become part of the normal production baseline. Compare the pipeline’s test definition with the scheduled production check; different environments or assertions can explain diverging results.
Coverage matters too. Test each distinct page type, not just the home page. A successful landing-page check says little about a search page or account workflow. Choose locations that represent where visitors come from, then compare measurements within each location rather than blending different conditions.
Record the monitor’s objective, threshold, environment, and test version together. For example, note whether a result came from a production checkout journey or a pre-release API validation. This context helps the team judge whether a status change reflects the service objective or a mismatch in how the check was defined.
Distinguish the type of check when interpreting a changing status. Browser synthetic tests check whether users can complete important transactions, while API tests monitor endpoints at different network layers. HTTP synthetic tests can check application availability, response to requests, page-load times, status codes, and header or body content. SSL synthetic tests can validate website certificates to check that users can access a website securely.
Synthetic monitoring can help organizations check whether applications meet service-level objectives and track how much error budget remains. Teams are advised to use 80-90% of their purchased synthetic check volume. Check for failed or broken tests, since they can waste check budget and create monitoring blind spots.
How do I fix or stabilize a synthetic status?
Stabilize the signal by tuning how the check measures service health and how its alerts reach the team. A monitor can be technically accurate yet noisy if its threshold, schedule, or alert policy doesn’t match the service objective. Treat these settings as part of the monitoring design, not as evidence that the application itself needs a change.
- Set thresholds from service objectives. Choose response-time and availability thresholds that reflect the impact users can tolerate. If a marketing page has a looser performance objective than a payment API, applying one threshold to both can create noise or hide a meaningful slowdown. Tie each threshold to the endpoint’s role.
- Use a schedule that fits the risk. Revenue-critical APIs and checkout flows may need checks every 1-5 minutes, while less critical pages or internal tools can use 15-30 minutes. A schedule should provide useful detection without consuming check volume on low-impact paths.
- Control alert noise. Group related alerts around the same service or incident, and route them according to operational ownership. If an alert fires on a brief metric spike, a configured threshold and sensible notification policy help distinguish actionable degradation from routine variation.
- Validate changes through delivery. Run synthetic tests in CI/CD to catch regressions before deployment, then compare production measurements after release. Pipeline checks can increase check volume by 50-100%, so account for that growth when planning coverage and reserving capacity for new or ad-hoc tests.
Focus coverage on user journeys with the greatest operational impact. If one monitor combines unrelated endpoints, split the checks so each result maps to a clear service objective. This makes alert ownership easier and helps the team identify which part of the system needs attention without adding unrelated checks.
Review the signal after changing a threshold or schedule. Compare alert frequency and observed service behavior with the objective the monitor is meant to protect. If the check becomes quieter but no longer detects meaningful degradation, the adjustment has hidden risk rather than stabilized monitoring.
Monitoring can identify a service issue, but users also need a clear update when the team confirms an incident. A public status page gives teams a place to communicate service information while investigation and recovery continue.
StatusPulse: Public Status Pages
StatusPulse helps teams pair service monitoring with clear updates when an incident affects users. Public Status Pages give teams a place to communicate service information, while Uptime Monitoring tracks availability. SSL Certificate Monitoring and API Monitoring add visibility into certificate health and API endpoints.
Use these tools when you need to distinguish an unstable synthetic test from a confirmed service issue or keep users informed during an investigation. Monitoring results help technical teams assess service signals; a public status page communicates relevant updates without treating every failed check as a confirmed outage.
Contact StatusPulse to discuss how public status pages and monitoring can support your incident communication.
Make the next signal easier to act on
When a synthetic status remains unstable, use the uncertainty to improve how your team separates test behavior from service impact. Keep the test aligned with the user journey it represents, and ensure the result leads to a clear operational decision. A useful monitoring setup helps teams investigate, then communicate what they know without overstating what a single check proves.
StatusPulse brings service visibility and incident communication together through Public Status Pages, Uptime Monitoring, and SSL Certificate Monitoring. These tools help teams track availability, monitor certificate health, and share service updates when users need them. Choose the monitoring and communication approach that fits your application and incident process.
Contact StatusPulse to discuss monitoring support. A clearer signal is a practical starting point for better incident decisions.
Frequently Asked Questions
What does “synthetic status unstable” mean?
A synthetic status marked unstable means an automated check is producing inconsistent results or failing its configured test. It describes the monitor’s observations, not necessarily every real user’s experience. For example, a check may fail because its expected response content changed even though the endpoint still responds. Interpret the status in light of the test’s assertions and intended user journey.


