

Revenue loss is only one part of an outage’s cost. Calculating revenue lost from an outage starts with the sales you would reasonably expect during the affected period, minus completed sales, then adjusts for purchases made later. Use contribution margin where possible, and add response labor, recovery work, refunds, service credits, and other direct costs to estimate the total impact.
It’s tempting to multiply average hourly revenue by the time a service was down. But that can overlook the difference between a peak sales period and a quiet one, or count purchases customers simply made later. A useful estimate makes its assumptions visible instead of hiding them inside a single benchmark.
This guide explains how to estimate direct revenue loss, account for operational and customer-related costs, and build low, expected, and high scenarios. You’ll see which inputs matter, how to avoid double-counting recovered sales, and how to present an estimate that helps teams make practical decisions about outage response and resilience.
Key Takeaways
- Estimate missed sales against comparable periods, then account for transactions customers complete later.
- Use contribution margin where possible to avoid treating every dollar of gross sales as a loss.
- Build the full outage picture by including response work, recovery expenses, contractual impacts, and customer effects.
- Separate low, expected, and high estimates, and make the assumptions behind each scenario clear.
- Use outage evidence to identify which services and recovery steps have the greatest impact on business continuity.
What are the 4 main types of downtime costs?
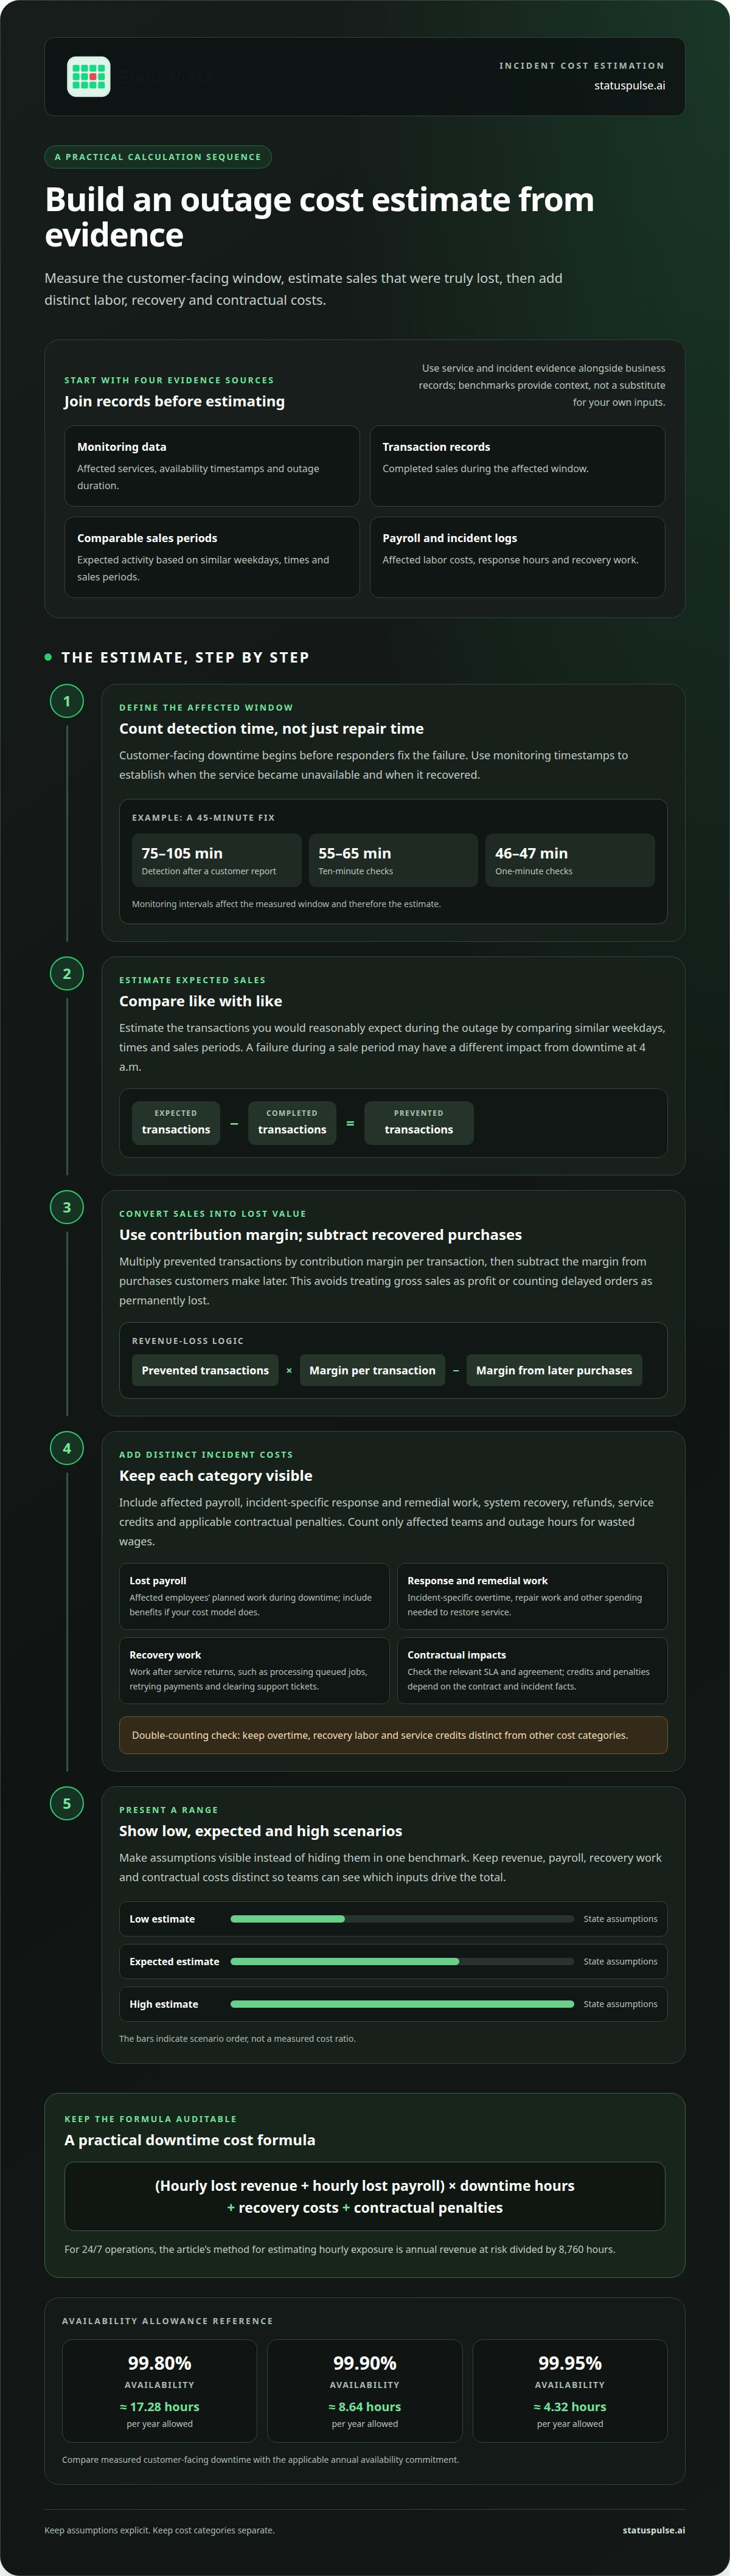
Four cost groups matter: lost revenue, wasted employee time, recovery and remedial work, and indirect business losses. For seasonality, compare the outage with similar weekdays, times, and sales periods; a sale-period failure can cost more than downtime at 4 a.m.
Benchmarks show why company size and industry matter, but they cannot replace company-specific estimates. These ranges reflect different operating models, not a universal rate.
Industry exposure varies sharply. Map the failed service to the revenue or operation it supports instead of applying a sector-wide figure without context.
Wasted wages are the payroll cost of employees unable to perform planned work during downtime. Include only affected teams and outage hours, and account for benefits if your cost model includes them. Remedial costs are different: they cover incident-specific overtime, repair work, and other spending needed to restore service.
Intangible Losses and Business Context
Intangible losses are business effects that do not appear as immediate repair invoices, such as reduced customer trust or future sales. Their impact depends on the company’s size, industry, and the role of the failed service. A payment failure can interrupt a retailer’s checkout, while a media outage can block access to published content. Track these effects separately from booked revenue to avoid counting the same loss twice.
Combining Costs Into a Total
A total outage estimate combines direct revenue loss, wasted payroll, remedial work, system recovery, and indirect impacts. Recovery can continue after service returns, as teams process queued jobs, retry payments, and clear support tickets. Add incident-specific costs to outage-period losses, keeping each category distinct. This makes estimates useful for comparing incidents and identifying which recovery work drives the total.
How Do You Calculate the Cost of Downtime?
Estimate downtime cost by combining lost revenue and payroll during customer-facing downtime, then adding recovery expenses and contractual penalties. For calculating revenue lost from an outage, use transaction records and comparable sales periods alongside monitoring timestamps.
Downtime Cost Formula
A downtime cost formula combines hourly business impact with outage duration, then adds incident-specific expenses. A practical version is: (hourly lost revenue + hourly lost payroll) × downtime hours + recovery costs + contractual penalties. Keep each category distinct so finance and engineering teams can see which inputs drive the figure and avoid counting overtime, recovery labor, or credits twice.
Measuring Customer-Facing Downtime
Customer-facing downtime includes the period before detection, not just the time responders spend fixing the failure. With a 45-minute fix, detection after a customer report can mean 75-105 minutes of total impact. Ten-minute checks can mean 55-65 minutes; one-minute checks can mean 46-47 minutes. Monitoring intervals affect the measured window and therefore the estimate.
Uptime monitoring can provide timestamps for service availability; uptime monitoring is relevant when teams need to track those events. Compare customer-facing downtime with annual availability commitments: 99.90% allows approximately 8.64 hours of downtime per year. At 99.95%, the allowance is approximately 4.32 hours, while 99.80% allows approximately 17.28 hours.
Revenue Loss Data and Tools
A defensible estimate joins service telemetry with sales, payroll, and incident records. Monitoring data identifies affected services and outage duration. Transaction records show completed sales, while comparable periods help estimate expected activity. Payroll records support affected labor costs, and incident logs capture response hours and recovery work. For 24/7 operations, divide annual revenue at risk by 8,760 hours to estimate hourly exposure.
Calculating Lost Revenue During an Outage
For calculating revenue lost from an outage, compare expected transactions with successful transactions during the affected window. Multiply prevented transactions by contribution margin per transaction, then subtract the margin from later purchases. This separates permanently lost sales from delayed orders and avoids treating gross sales as profit.
Annual downtime exposure equals cost per incident multiplied by incidents per year. The Uptime Institute’s 2025 Annual Downtime Analysis found that 57% of organizations reported their latest major outage cost more than $100,000. Use benchmarks for context, then base the estimate on your service, sales, and recovery records.
Assessing service-level credits, penalties, and churn exposure
An outage can cause losses beyond missed sales, including contractual credits, penalties, emergency response work, and customer churn. Assess each category separately. A payment-processing incident, for example, may trigger an SLA review while also putting customer accounts at risk. Keeping these effects distinct makes the total clearer and reduces double-counting.
Start with the relevant service-level agreement (SLA). Identify the covered service, availability measure, qualifying outage, exclusions, claim process, and credit calculation. Service credits generally refund only a fraction of the monthly fee, not the entire payment. Record potential credits as contractual costs, separate from lost revenue and recovery labor.
Penalties depend on the contract and the incident’s documented effects. Check whether a missed delivery window, service commitment, or other agreed obligation applies. Treat the amount as a scenario input, not a standard penalty: the actual figure depends on the relevant agreement and facts.
Assess regulatory exposure separately, using evidence. Identify the affected system, data, business process, and jurisdiction, then distinguish possible exposure from a confirmed payable fine. Do not automatically add a maximum penalty to every outage estimate. For example, a service interruption without an identified regulatory breach should not be costed as though a fine has already been imposed.
Estimate churn exposure using at-risk accounts, churn probability, and each account’s remaining contribution margin: at-risk accounts × churn probability × remaining contribution margin. Segment customers by service impact and renewal status. A four-hour credit-card-processing outage could affect customers differently from a brief issue in a supporting function, so apply assumptions to the affected group rather than the entire customer base.
For an annual view, combine incident-level credits, penalties, and expected churn costs across incidents, while keeping each category visible. Use billing records for credits, contract terms for penalties, and account and margin data for churn. Label each input as observed, contract-based, or estimated. This helps finance teams compare expected losses with emergency spending on infrastructure and recovery.
Before reporting the total, check for overlap. If an SLA credit already compensates for part of the same customer impact, do not count that amount again as a separate refund. Likewise, separate a lost account’s future contribution margin from revenue already counted during downtime. Reviewing each category turns a rough incident estimate into a traceable cost model.
Customer churn and reputational losses
An outage can affect customers after uptime returns, so measure the customer-impact window through service restoration and any unresolved consequences. For a payment failure, that may include customers who abandoned checkout, delayed purchases, or needed support afterward. Separate immediate lost sales from later churn and reputation damage to avoid counting one customer impact several times.
Start by identifying which customer groups experienced the failure and what they could not do. A card-processing outage directly affects checkout; a failure in an internal reporting tool may affect employees without blocking customer transactions. Record the affected service, disrupted customer actions, and any recovery steps that continued after service returned. These distinctions help explain why the same uptime event creates different business losses.
Estimate customer churn using account-level evidence, not assumptions about the entire customer base. Compare affected accounts with similar unaffected accounts, then examine cancellations, renewals, complaints, and reduced usage after the incident. In a subscription business, a customer who renews but downgrades represents a different loss from a cancelled account. Use remaining contribution margin to value the expected impact, and make assumptions visible.
Reputation damage is harder to value directly, but customer behavior provides useful signals. Review support contacts, refund requests, public complaints, and sales conversations following the incident. A four-hour credit-card-processing outage can disrupt purchases and customer confidence at once. Keep measured refunds separate from estimated future churn, or the same affected customer may inflate both categories.
Downtime can also reduce employee productivity when staff cannot complete customer work. Support teams may handle outage reports instead of normal cases, while operations teams may need manual workarounds. Record affected functions and incident-specific hours, then distinguish lost output from extra response labor. For example, a support queue that grows during a service failure can create delays even after the underlying system is available again.
Reputational and business disruption are estimated to account for 35% of downtime costs. Treat that figure as context, not as a fixed share to apply automatically to every incident. The exposure depends on customer visibility, service criticality, outage timing, and the quality of response updates. A transparent explanation of what failed, what remains affected, and the next update point gives customers concrete information during recovery.
For a defensible estimate, connect incident records with customer and operational outcomes. Match outage timestamps to affected accounts, support contacts, refunds, renewal decisions, and employee work diverted by the failure. Then label each result as recorded or estimated. This evidence helps finance and engineering teams review reputational losses without presenting uncertainty as a booked cost.
Presenting low, expected, and high cost scenarios
Present low, expected, and high estimates instead of treating a generic hourly cost as your actual loss. Show the assumptions, evidence, and cost categories included in each scenario.
A cost-per-minute benchmark can provide context, but it cannot establish what a specific outage cost. Customer demand, affected services, outage timing, and recovery work all change the figure. A sale-period checkout failure and an overnight issue in a supporting system, for example, should not use the same revenue assumptions.
Worked Outage-Cost Calculation
A worked calculation applies the same cost categories and outage duration to one documented incident. Keep the split visible so readers can distinguish recovery spending from costs caused by lost activity or other effects.
Build three versions by changing evidence-based assumptions, not by multiplying an industry benchmark. The low case can use confirmed missed transactions and recorded recovery expenses. The expected case can include likely recovered sales and incident-specific labor. The high case can include plausible customer losses and extended recovery work, with every assumption labeled.
- Low: Use observed transactions, confirmed expenses, and completed recovery work.
- Expected: Include likely sales recovery and the most supportable customer-impact assumptions.
- High: Model longer impact or additional losses only when incident evidence supports them.
Estimating Loss With Incomplete Data
When data is incomplete, use the strongest available records and make uncertainty explicit. This produces a usable estimate without presenting gaps as certainty. Compare the outage window with matching weekdays and times, such as previous Tuesday mornings, rather than relying on a monthly average.
If transaction logs are incomplete, combine available sales records with order confirmations, payment records, and service timestamps. Use the affected service’s share of revenue as an assumption, then show how changing that share shifts the low, expected, and high estimates. Backup records can help reconstruct missing events, but distinguish reconstructed values from directly observed transactions.
Keep the calculation auditable: record the outage window, hourly cost assumptions, affected revenue share, recovery expenses, and any excluded categories. Then multiply the supported hourly impact by customer-facing downtime, adding direct costs only once. A public status page can give customers a clear incident update while teams work through recovery and refine the estimate.
StatusPulse
StatusPulse helps teams maintain a clearer record of service disruptions and communicate their impact. Uptime, API, and SSL certificate monitoring can help identify affected services and outage timelines, while Public Status Pages give customers a place to see incident updates. These signals support the cost model by grounding downtime duration and customer impact in operational records.
Turn to StatusPulse when your team needs better visibility into service availability or a clearer way to share disruption updates. Monitoring cannot determine missed revenue or customer churn by itself; those estimates still depend on your sales, payroll, and account data. Together, these records help connect technical events to business impact.
Contact StatusPulse to discuss how its monitoring and status page tools can support your outage tracking and communication.
Make outage estimates part of operational planning
Turn each incident estimate into a decision input. Assign an owner to maintain the assumptions, preserve the operational records behind them, and revisit the model when traffic patterns or critical services change. This makes calculating revenue lost from an outage a repeatable part of incident review, rather than a figure assembled from memory under pressure.
Use the next review to connect financial impact with operational evidence. Note where detection, customer communication, or recovery records leave gaps, then decide which one to address first. A clearer baseline helps engineering and finance teams discuss resilience in practical terms and track whether changes reduce exposure over time.
StatusPulse can support service visibility and incident communication through its monitoring and status page tools. Contact StatusPulse to discuss outage tracking and how it could fit your team’s workflow. Start with the records and processes you already rely on, then improve them one concrete step at a time.
Frequently Asked Questions
What Is the True Cost of a Power Outage to Your Business?
The cost includes revenue operations could not earn, plus expenses caused by the interruption. For a physical retailer, a power outage might stop checkout terminals and refrigeration; an online service might lose access to systems hosted at the affected site. Include repair and restart work, spoiled or damaged inventory where applicable, and delayed orders. Separate costs incurred during the outage from follow-on costs after power returns.
What hidden costs get missed on the first calculation?
Commonly missed items include manual workarounds, delayed fulfilment, failed payment retries, and support demand that persists after restoration. An outage may leave a warehouse team re-entering orders while customer service handles duplicate enquiries, for example. Check incident logs, operations records, and support tickets for work created by the event. Count only incremental costs, not normal work employees would have done anyway.
What formula estimates lost revenue per minute or hour of downtime?
For a simple estimate, multiply revenue at risk per minute or hour by customer-facing downtime and the affected share of revenue. For transaction-based businesses, multiply prevented transactions by contribution margin per transaction, then subtract the margin from purchases completed later. Choose one time unit and keep it consistent: convert minutes to hours before multiplying by an hourly rate. This estimates revenue impact, not the entire incident cost.
How do you calculate outage impact using average revenue per hour?
Divide revenue for a representative operating period by its hours to get average hourly revenue, then multiply by outage hours and the affected share. Use comparable periods rather than a broad average: a weekday morning may best match another weekday morning. If traffic spikes around a product launch or promotion, model that interval separately. An annual average can conceal peaks and understate exposure during busy periods.
How do you estimate lost sales when customers postpone purchases or switch to competitors?
Compare expected purchases with completed purchases during the incident, then track whether affected customers buy later. Subtract recovered contribution margin from the initial shortfall. To estimate switching or abandonment, examine post-incident order patterns and the customer accounts affected by the failure. Keep directly observed cancellations separate from projected future churn. A delayed purchase is not a permanent loss unless evidence shows the customer did not return.
What indirect outage costs should be included beyond lost revenue?
Include incident-specific response labor, overtime, repair work, recovery tasks, refunds, and any contractual credits or penalties. Then assess downstream effects such as delayed deliveries, a support backlog, or reduced employee productivity. Queued jobs may need manual review after a service restarts, for example. Avoid counting the same impact twice: if a refund is already recorded as a direct cost, do not count it again as lost revenue.
How do refunds, service credits, and SLA penalties affect outage cost calculations?
Record refunds, service credits, and penalties as separate direct costs, using transaction records and applicable contract terms. A refund reverses a customer payment; an SLA credit follows the agreement’s eligibility and calculation rules. Do not assume every outage triggers a penalty or that a credit equals the full monthly fee. Keep potential regulatory exposure distinct from a confirmed payable amount, and include only documented costs in the actual total.
How do you calculate and compare outage costs for ecommerce, SaaS, and subscription businesses?
For ecommerce, assess affected checkouts, contribution margin, refunds, and orders completed later. For SaaS, measure which customer workflows failed, affected account usage, response work, and any applicable service credits. For subscription businesses, track renewals, downgrades, cancellations, and remaining contribution margin. Compare each model using the same incident window and cost categories, while preserving business-specific assumptions. A checkout outage and a degraded feature do not affect revenue in the same way.


