

The most expensive monitoring tool in your stack isn't the one with the highest licensing fee. It's the one that buries a critical outage under a mountain of false positives. Most enterprise platforms prioritize metric density over actual clarity, making monitoring availability of cloud services feel like a burden rather than a safeguard. You shouldn't need a PhD in proprietary query languages just to verify if your API is reachable from Frankfurt or New York.
We agree that your time is better spent shipping code than fighting with per-subscriber pricing models or complex alerting logic. This technical guide explains how to implement a high-precision monitoring architecture that balances uptime detection with transparent communication. We'll examine multi-vantage point consensus, the impact of tightening TLS lifespans to 47 days, and how to maintain data sovereignty under EU regulations like DORA and NIS2. You'll learn to build a system that reduces time-to-detect and earns customer trust through technical honesty. By the end, you'll have a blueprint for a streamlined setup that prioritizes integrity over corporate bloat.
Key Takeaways
- Implement multi-region probe consensus to eliminate false positives and solve the problem of single-vantage point routing failures.
- Master the technical architecture for monitoring availability of cloud services by combining external synthetic transactions with deep API assertion matching.
- Navigate regional data sovereignty by selecting hosting locations that align with GDPR and DORA compliance for your monitoring telemetry.
- Automate SSL certificate tracking to handle the industry transition toward 47-day validity periods and prevent silent connection errors.
- Reduce support ticket volume during outages by decoupling your incident communication from your core infrastructure using public status pages.
The Mechanics of Availability Monitoring: How Uptime is Measured
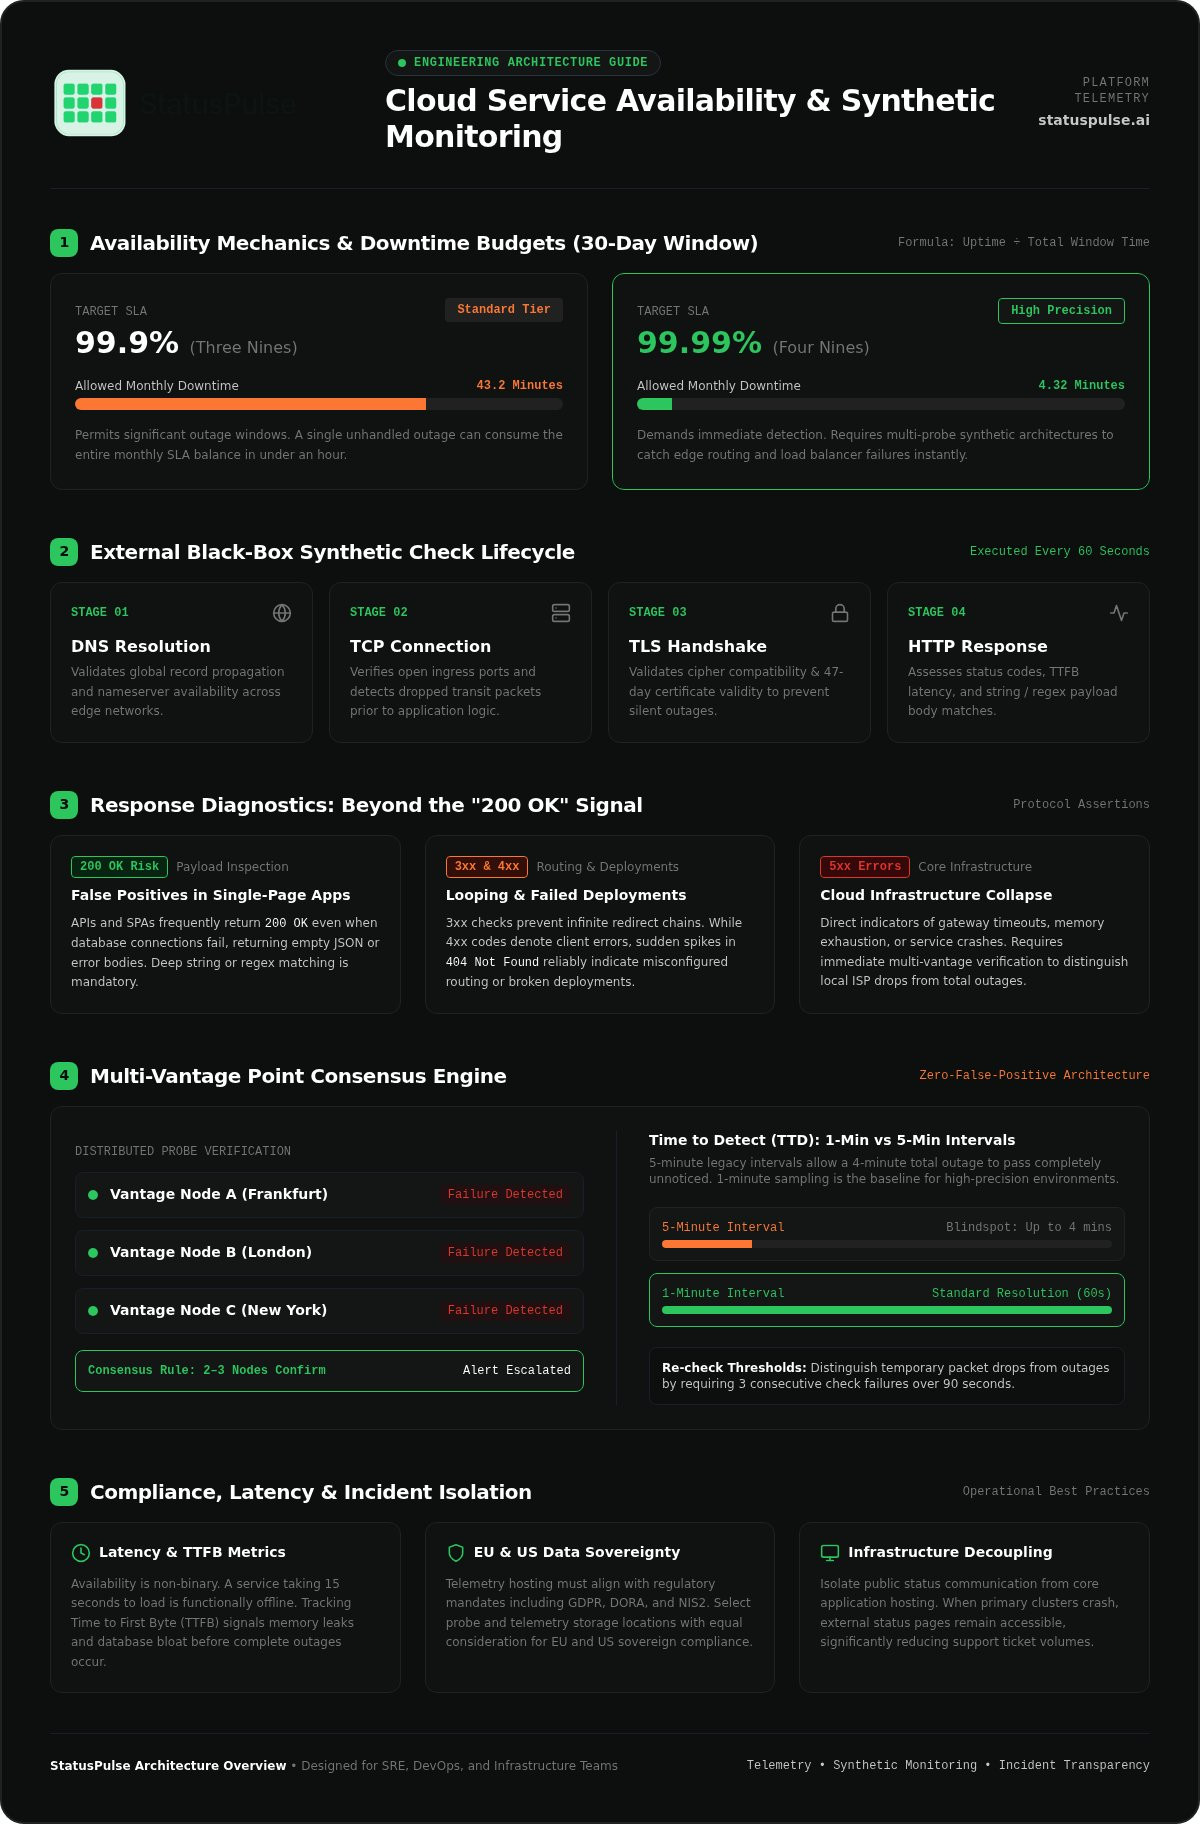
Availability is a simple ratio. It is the uptime divided by the total time in a specific window, usually 30 days. This calculation provides the foundation for high availability and uptime measurement. While "three nines" (99.9%) allows for 43.2 minutes of downtime per month, "four nines" (99.99%) drops that window to just 4.32 minutes. Achieving the latter requires more than just reactive fixes; it demands precise detection.
Effective monitoring availability of cloud services relies on external black-box testing. Internal monitoring, like Kubernetes liveness probes, tells you if a container is running. It doesn't tell you if your load balancer is misconfigured or if a transit provider is dropping packets. You need both. Internal metrics provide the "why" during a post-mortem, but external checks provide the "what" and "when" for your customers.
Every synthetic check follows a strict lifecycle. It starts with DNS resolution to ensure your records are propagating. Next is the TCP connection to verify the port is open. For secure sites, the TLS handshake follows, checking certificate validity and cipher compatibility. Finally, the HTTP response confirms the application logic is functional. Protocols vary by need. ICMP (Ping) is the fastest for network reachability, but HTTP/S is the standard for modern web applications.
Synthetic Monitoring vs. Real User Monitoring (RUM)
Synthetic monitoring acts as a controlled heartbeat. It simulates user paths at fixed intervals, such as every 60 seconds, to detect failures before they impact real traffic. This is the baseline for SLA reporting. RUM captures telemetry from actual users, which helps identify regional ISP issues or CDN latency. However, RUM is reactive. If your traffic drops to zero during a total outage, RUM has no data to report. Reliable systems use synthetic checks for alerting and RUM for performance tuning.
Decoding HTTP Status Codes for Uptime
A "200 OK" status is often a false signal. Many single-page applications or APIs return a 200 status code even when the backend database is down, serving an empty or error-laden JSON body. Reliable uptime monitoring must look for specific response strings or regex patterns to confirm the page content is correct. Redirects (3xx) should be monitored to prevent infinite loops. While 4xx errors usually indicate client-side issues, a spike in 404s can signal a failed deployment. 5xx errors are the primary indicators of cloud infrastructure collapse.
Designing a Resilient Monitoring Architecture
A single monitoring node is a single point of failure. If your monitor is hosted in the same cloud region as your application, a regional outage will take down both your service and your visibility. Implementing resilient monitoring availability of cloud services requires a distributed mesh of probes across different global regions and infrastructure providers. This architecture solves the "who monitors the monitor" problem by ensuring that your alerting system remains online even when your primary cloud provider faces a backbone failure.
Frequency matters for your Time to Detect (TTD) metrics. A 5-minute interval might save on processing costs in legacy per-check pricing models, but it permits a 4-minute outage to go entirely unnoticed. 1-minute intervals are the standard for production environments that demand high reliability. While high frequency increases the risk of being triggered by transient network blips, you can mitigate this through intelligent threshold settings rather than by reducing your resolution.
Eliminating False Positives with Consensus Logic
Consensus logic prevents your phone from buzzing at 3 AM because of a single ISP routing hiccup in London or a peering split in Frankfurt. A reliable system requires at least two or three independent nodes to confirm a failure before escalating an alert. You should configure re-check counts, such as requiring three consecutive failures over 90 seconds, to distinguish between temporary packet loss and a genuine server crash. This approach significantly reduces alert fatigue, allowing your team to ignore the noise and focus on verified incidents.
Latency and Performance Benchmarking
Availability isn't just a binary "up or down" state. A service that takes 15 seconds to load is functionally down for the user, even if the server returns a successful response. Monitoring Time to First Byte (TTFB) provides an early warning of resource exhaustion, database bloat, or memory leaks. By following the NIST Cloud Computing Service Metrics framework, teams can establish performance budgets that trigger warnings before a total failure occurs. Global monitoring nodes are essential here to identify regional latency spikes that your local health checks might miss.
Alerting works best when it's multi-channel and integrated into your existing workflow. Webhooks enable automated scripts to trigger failovers or clear caches, while Slack and SMS keep the SRE team informed of critical breaches. Many enterprise tools charge per-subscriber for these notifications, which creates a financial barrier to transparency. If you're struggling with configuration fatigue or unexpected bill increases, setting up a transparent uptime monitoring system with flat pricing helps you scale your response team without scaling your costs.
Data Sovereignty and Regional Monitoring Constraints
Data sovereignty is no longer a legal afterthought. For engineering teams in Europe, monitoring availability of cloud services involves navigating a complex web of regulations like GDPR, NIS2, and the Digital Operational Resilience Act (DORA). If your monitoring data, including IP addresses and request headers, is stored in US based data centers, you may face compliance hurdles under the US CLOUD Act. This creates a technical requirement to choose a provider that offers explicit data residency options.
The architecture of your monitoring stack should decouple probe locations from data storage. While you need global probes to detect regional outages, your telemetry storage must remain within your required jurisdiction. Centralizing logs in the EU ensures that audit trails and incident post mortems comply with local privacy standards. This setup allows you to benefit from global visibility without cross border compliance leakage. It is a trade off between broad reach and regulatory safety.
The Legal Reality of Monitoring Logs
Monitoring checks often capture more than just a binary status. HTTP headers, User Agent strings, and source IP addresses are frequently logged during synthetic transactions. Under current EU frameworks, these data points can be classified as Personally Identifiable Information (PII). Following the ENISA guidelines on cloud service level monitoring ensures that your security service levels meet regulatory scrutiny. Many enterprise providers default to US hosting. This makes StatusPulse a principled alternative for teams requiring dedicated EU hosting options to maintain strict data sovereignty.
Minimizing Latency in Global Checks
Physical distance introduces network latency that can skew your performance benchmarking. If you monitor a Frankfurt based service from a node in San Francisco, the speed of light alone adds roughly 140ms to your Time to First Byte (TTFB). This artificial latency makes it difficult to distinguish between server degradation and transit provider congestion. For services targeting specific markets like the DACH region, placing monitoring nodes in proximity to your primary user base is essential for accuracy. You can find more details on optimizing this setup in our guide on Website Availability Monitoring. Accurate benchmarking requires a balance between global diversity and regional precision.
Beyond the Ping: Monitoring APIs and SSL Health
A simple HTTP response code is a shallow metric. While a "200 OK" indicates reachability, it often masks internal application failures where the backend returns a success code alongside a JSON error body. True monitoring availability of cloud services requires deep inspection of the response payload. If your API returns a success status but fails to include a required data key, your users are effectively facing an outage that your basic uptime check will never see.
Your monitoring strategy must also account for the infrastructure layer that sits in front of your code. Expired SSL/TLS certificates and forgotten domain renewals are the most common causes of avoidable downtime. These issues trigger "Connection Not Private" browser warnings that destroy user trust instantly. Relying on manual spreadsheets or calendar reminders for these renewals is no longer a viable strategy for production systems.
Advanced API Monitoring Strategies
Robust API checks should validate specific JSON schemas and key-value pairs to ensure functional correctness. This involves testing authenticated flows, such as OAuth or API key headers, to verify that your authorization layer is behaving as expected. Without these assertions, you risk missing silent failures in downstream microservices or database deadlocks. For a deeper look at implementing these multi-step checks, consult our API Monitoring Guide. This approach shifts your focus from network reachability to actual service utility.
Automating SSL and Domain Health
The technical landscape for certificate management is changing rapidly. Under CA/Browser Forum Ballot SC-081v3, public TLS certificate lifespans are transitioning from 398 days down to just 47 days by March 2029. As of March 15, 2026, the maximum validity has already dropped to 200 days. This 8.5x increase in renewal frequency makes automated tracking mandatory. You should set alert buffers at 30, 14, and 7 days to give your team enough lead time to handle manual renewals or automation failures.
Monitoring for chain of trust issues and revoked certificates is equally critical to prevent intermittent handshake failures. If you are tired of configuration fatigue from enterprise tools that overcomplicate these simple checks, you can automate your SSL and API monitoring with a system designed for technical precision. Decoupling these health checks from your primary infrastructure ensures you get notified even if your main cloud provider's internal alerting fails. This transparency allows you to fix the problem before the first customer ticket arrives.
Closing the Loop: Incident Management and Transparency
Outages are an operational reality. While monitoring availability of cloud services tells your team when a system fails, it doesn't solve the communication gap with your users. The industry is shifting away from the "stealth fix" approach. Modern engineering teams use radical transparency as a competitive edge. When you acknowledge a failure before the customer reports it, you build technical integrity that a marketing department cannot buy.
A public status page is the primary tool for this transparency. It reduces support ticket volume by providing a single source of truth for system health. Instead of answering dozens of identical emails, your team can focus on the root cause. Effective status pages include historical uptime data, real-time logs, and a breakdown of specific system components. You should automate these updates directly from your monitoring alerts to eliminate the delay between detection and notification.
Building Trust with Public Status Pages
Your status page shouldn't just be a green checkmark. It needs to reflect the actual state of your infrastructure, including scheduled maintenance and past incidents. Transparency requires showing the "nines" you actually hit, not just the ones in your SLA. For a deeper look at designing these systems, see our guide on The Architecture of Incident Communication Transparency. Decoupling this page from your core infrastructure ensures it remains reachable even during a total cloud provider outage.
AI-Assisted Incident Communication
Drafting clear incident updates under pressure is difficult. SREs are often too focused on the fix to write human-readable summaries for customers. AI can assist by analyzing technical logs and drafting concise updates that explain the impact without the jargon. However, human agency is non-negotiable. An engineer must always review and approve AI-drafted content before it goes live. This ensures accuracy and maintains a human connection during stressful disruptions.
StatusPulse takes a grounded approach to AI incident management. We treat AI as an assistant that prepares the work for a final human action. This avoids the hype of "autonomous" systems that often hallucinate during complex failures. By combining uptime monitoring and public status pages into a single platform with flat pricing, you can scale your incident response without worrying about per-subscriber fees. Honest communication beats a fake 100% uptime claim every time. It's about respecting your users' time and intelligence.
Building a Resilient Foundation for Uptime
Effective monitoring availability of cloud services requires moving beyond simple ping checks. By implementing multi-region consensus logic and deep API assertions, you eliminate the noise of false positives while catching silent failures before they impact your users. Navigating the regulatory landscape of the EU also demands a clear choice in data residency, ensuring your telemetry stays within your jurisdiction. Transparency isn't a liability; it's a strategic way to reclaim your time and earn customer trust during inevitable disruptions.
StatusPulse provides a principled alternative to the bloat of traditional enterprise monitoring. We offer a unified platform for uptime, SSL, and API checks with dedicated EU or US hosting for data sovereignty. Our flat pricing model removes the stress of per-subscriber fees, while AI-assisted incident management helps your team communicate clearly without the manual overhead. You've built a great product. Let's make sure it stays reachable.
Start monitoring your cloud services with StatusPulse
Frequently Asked Questions
What is the difference between uptime monitoring and observability?
Uptime monitoring is external black-box testing that verifies if a service is reachable and functional for the end user. Observability involves internal white-box telemetry like logs, metrics, and traces to explain why a system is behaving a certain way. While observability helps with root cause analysis, monitoring availability of cloud services through external probes is what determines your actual SLA compliance and user experience. You need both for a complete reliability stack.
How often should I monitor the availability of my cloud services?
Production environments should utilize 1-minute check intervals to ensure a low Time to Detect (TTD). While 5-minute intervals are common in legacy tools to save on costs, they allow significant outages to persist without triggering an alert. High-frequency monitoring is essential for maintaining "four nines" of availability. If you're worried about costs, look for platforms with flat pricing models that don't penalize you for frequent checks.
Can I monitor services that are behind a firewall or in a private VPC?
You can monitor private services by whitelisting the static IP addresses of your monitoring provider's probe nodes. This allows external checks to bypass your firewall while keeping the service hidden from the general public. This setup is critical for verifying that your VPN or VPC peering hasn't accidentally severed connectivity. It ensures that your internal security layers don't become a source of silent downtime for authorized users.
Why do I need a public status page if I already have internal monitoring?
Internal monitoring tells your engineers that a database is down, but it doesn't communicate that to your users. A public status page serves as a decoupled communication channel that remains online even if your primary infrastructure fails. It builds customer trust by providing a single source of truth during incidents. This transparency significantly reduces the volume of repetitive support tickets, allowing your team to focus entirely on technical resolution.
How do I prevent false positive alerts in my monitoring system?
Preventing false positives requires a multi-region consensus architecture. Your system shouldn't fire an alert based on a single failed check from one location, as this is often just a local routing blip. Instead, require at least two or three independent global nodes to confirm the failure. Setting a re-check count, such as three consecutive failures over 90 seconds, ensures that you only wake up your SRE team for genuine service disruptions.
What are the most common causes of cloud service downtime in 2026?
In 2026, the primary causes of downtime include mismanaged SSL certificate renewals due to shortened 200-day validity periods and silent API schema failures. Regional cloud provider outages and DNS misconfigurations also remain prevalent. Many teams still suffer from avoidable downtime caused by domain expiration. Using a tool like StatusPulse to automate these checks ensures that infrastructure layers are monitored just as closely as the application code itself.
How does data sovereignty affect where I should host my monitoring tools?
Data sovereignty mandates that certain telemetry, such as IP addresses or request headers, must be stored in specific geographic regions to comply with GDPR or DORA. If your monitoring availability of cloud services involves processing PII, you must ensure your provider offers hosting in your required jurisdiction. StatusPulse provides a choice between EU and US hosting to help teams meet these legal requirements without sacrificing the accuracy of their global uptime probes.
Is AI incident management reliable enough for technical teams?
AI is a reliable assistant for drafting incident updates, but it shouldn't act autonomously. It's excellent at summarizing complex technical logs into clear, human-readable language for your status page. However, a human engineer must always review and approve the AI-generated draft before it's published. This maintains human agency and ensures technical accuracy. It's about using technology to speed up communication during high-stress outages without losing precision or trust.


