

It is 3:00 AM on a Tuesday when your phone vibrates for the fifth time. You check the log, only to find another false positive from a "flapping" service that recovered before you could even open your laptop. This cycle of noise and interrupted sleep is the reality for many DevOps teams today. You understand that every minute of unverified downtime impacts your SLA, yet the constant barrage of low-context alerts makes it harder to identify genuine emergencies.
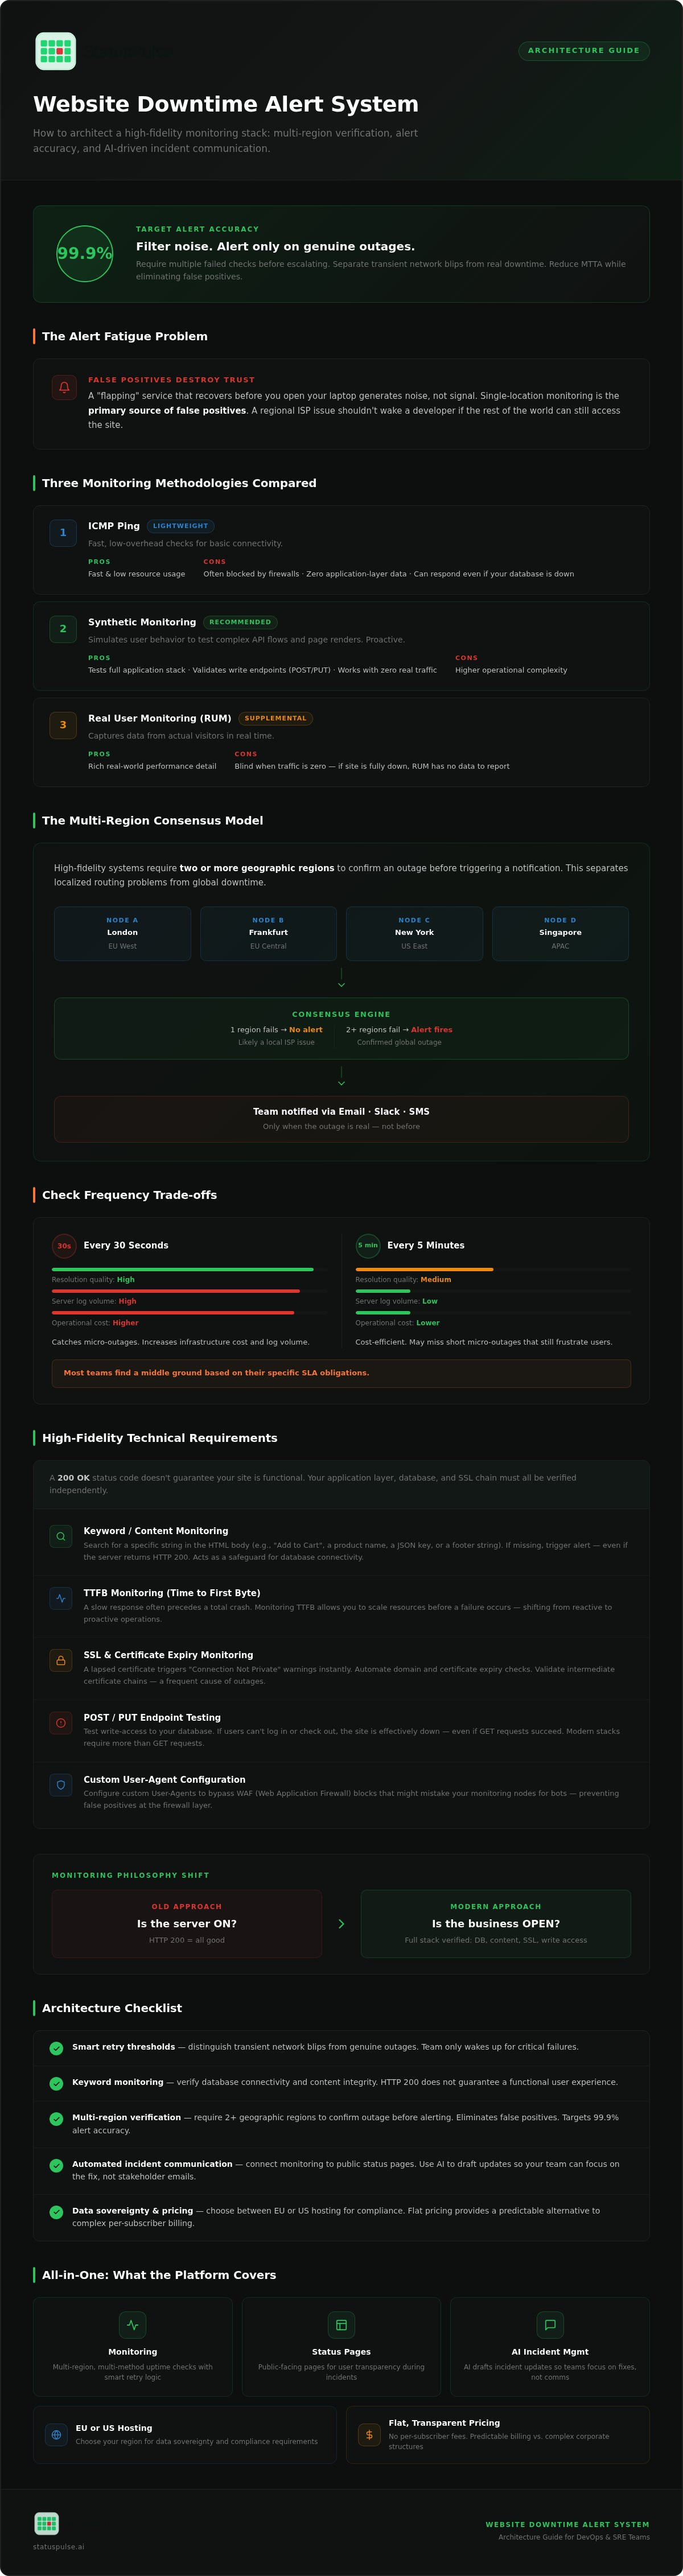
Building a reliable website downtime alert system requires more than just a simple ping. It demands a strategy that filters out transient network blips and provides the technical context needed for rapid recovery. This guide outlines how to architect a high-fidelity monitoring stack that delivers 99.9% alert accuracy while reducing your Mean Time to Acknowledge (MTTA). We will cover multi-region verification, the integration of status pages for user transparency, and how to use AI to draft incident updates that keep stakeholders informed without adding to your workload.
Key Takeaways
- Distinguish between transient network blips and genuine outages by configuring smart retry thresholds. This reduces alert fatigue and ensures your team only wakes up for critical failures.
- Verify database connectivity and content integrity using keyword monitoring. A simple HTTP 200 status code doesn't guarantee a functional user experience for your visitors.
- Architect a high-fidelity website downtime alert system that utilizes multi-region verification to eliminate false positives. This approach ensures 99.9% alert accuracy for your operations team.
- Automate incident communication by connecting monitoring directly to public status pages. Use AI to draft updates so you can focus on the technical fix while maintaining user trust.
- Maintain compliance and data sovereignty with a choice between EU or US hosting. Flat pricing models provide a predictable, ethical alternative to complex corporate billing structures.
Understanding the Architecture of a Website Downtime Alert System
A website downtime alert system is a service that monitors your site's availability and notifies your team via email, Slack, or SMS when a failure is detected. It acts as an external watchdog. It sits outside your infrastructure to ensure it can see what your users see. Without this external perspective, you risk being the last to know when your service fails.
Basic pings often fail to provide the full picture. A single failed packet is usually just a network blip; a transient routing issue that resolves in milliseconds. Genuine service outages are sustained. If your monitoring tool alerts on every minor fluctuation, you will quickly suffer from alert fatigue. Reliable architecture distinguishes between these events by requiring multiple failed checks before escalating.
The "observer" node is the core of a distributed website monitoring network. These nodes are independent servers located in different data centers globally. They perform the actual checks. By using a distributed network, the system avoids the "observer effect" where a local network issue at the monitoring source is mistaken for a target site failure.
There are always trade-offs regarding check frequency. Monitoring every 30 seconds provides high resolution but increases server log volume and operational costs. Checking every five minutes is more cost-efficient but might miss short "micro-outages" that still frustrate users. Most teams find a middle ground based on their specific SLA obligations.
Monitoring Methodologies: Ping vs. Synthetic vs. RUM
ICMP Pings are fast and lightweight. However, they are often blocked by firewalls and provide zero application-layer data. You might get a response even if your database is down. Synthetic monitoring is more robust. It simulates user behavior to test complex API flows and page renders. It's proactive. In contrast, Real User Monitoring (RUM) captures data from actual visitors. While RUM provides great detail, it can't alert you when traffic is zero. If the site is completely down, RUM has no data to report.
The Crucial Role of Multi-Region Verification
Single-location monitoring is a primary source of false positives. A regional ISP issue in London shouldn't wake a developer in Berlin if the rest of the world can still access the site. High-fidelity systems use a "Consensus" model. This requires two or more geographic regions to confirm an outage before a website downtime alert system triggers a notification. This logic separates localized routing problems from global downtime, ensuring that when your phone vibrates, the issue is real.
Technical Requirements for High-Fidelity Monitoring
High-fidelity monitoring goes beyond simple availability. A 200 OK status code doesn't always mean your site is functional. It's common for a web server to return a success code while the application layer serves a blank page or a "Connection Failed" message. To combat this, your website downtime alert system should look for specific strings in the HTML body. If your "Add to Cart" button or a specific product name is missing, the system should trigger an alert even if the server appears healthy.
Keyword monitoring acts as a safeguard for your database connectivity. If the database fails, the server might still respond, but the content will be missing. By searching for a specific JSON key or a footer string, you verify that the entire stack is operational. This approach moves you from checking if a server is "on" to checking if your business is "open."
Validating the Application Layer
Modern stacks require more than GET requests. Testing POST and PUT endpoints ensures that write-access to your database is functional. If users can't log in or checkout, the site is effectively down. You should also configure custom User-Agents to bypass Web Application Firewall (WAF) blocks that might mistake your monitoring nodes for a bot. Monitoring Time to First Byte (TTFB) is another critical metric. A slow response often precedes a total crash, allowing you to scale resources before a failure occurs.
SSL and Security Monitoring
Security failures are downtime by another name. A lapsed certificate triggers "Connection Not Private" warnings, driving traffic away instantly. You need to automate domain and certificate expiry checks to prevent these preventable outages. This includes validating intermediate certificate chains, which are a frequent cause of mobile-specific connectivity issues. Implementing SSL certificate monitoring serves as a foundational security layer, protecting your brand's integrity.
For headless architectures, API monitoring is non-negotiable. You must validate that JSON responses contain the correct keys and types. A change in an upstream API shouldn't break your frontend without your knowledge. This level of precision is why technical teams move away from basic pings toward uptime monitoring that handles the complexities of modern web architecture. By validating the application layer and security certificates simultaneously, you reduce the risk of "silent" failures that impact your users while your dashboard stays green.
Managing Alert Fatigue: From Critical Outages to Flapping Services
Alert fatigue is a silent killer in DevOps culture. When a website downtime alert system triggers for every minor network jitter, the team begins to ignore the noise. This desensitization results in missed outages and burnout. It's a technical problem with a high human cost. To protect your team, you must move beyond binary "up or down" logic.
Threshold configuration is your first line of defense against "flapping" services. A flapping service is one that toggles between up and down states rapidly due to transient network issues. You can eliminate this noise by setting an "Alert after X failures" rule. For example, requiring three consecutive failures from at least two different regions ensures that a notification only goes out for a sustained outage. This logic filters out the 3:00 AM blips that resolve themselves before a human can even log in.
Maintenance windows are equally essential for operational sanity. If you are deploying a new build or performing database migrations, your monitoring should be aware. Silencing alerts during these planned windows prevents false alarms and keeps your incident logs clean. It ensures that your uptime statistics reflect genuine service availability rather than scheduled downtime.
Differentiating Severity Levels
Not all failures require the same response. A global outage is a Critical event that demands immediate SMS or phone call escalation. In contrast, a Warning event, such as an SSL certificate expiring in 30 days or a slight increase in latency, only needs a Slack or email notification. Information alerts, like minor performance dips, should be reviewed during standard business hours. Categorizing incidents this way prevents the "boy who cried wolf" effect in your communication channels.
Escalation Best Practices
Managing a 24/7 service doesn't mean every developer should be on call 24/7. Implementing on-call rotations distributes the burden fairly across the team. For complex organizations, integrating your monitoring with tools like PagerDuty or Opsgenie allows for sophisticated routing based on service ownership. This ensures the right person receives the alert at the right time. For a deeper look at moving from reactive fire-fighting to a more stable environment, see our guide on uptime monitoring service strategies. By refining your escalation policies, you turn a chaotic stream of notifications into a controlled, professional response system.
Implementation Guide: Configuring Your Monitoring Stack for 2026
Implementing a robust website downtime alert system requires a systematic approach. It's not enough to monitor a single root domain. You must map the entire user journey to ensure every critical touchpoint remains functional. Follow these five steps to configure a high-fidelity monitoring stack.
- Step 1: Map critical endpoints. Identify your "money paths." This includes the Homepage, Login, Checkout, and primary API v1 endpoints. If these fail, your business stops.
- Step 2: Define success criteria. A 200 OK status is the baseline. Add a latency threshold of under 500ms to detect performance degradation. Validate specific JSON keys for API responses to ensure the data layer is intact.
- Step 3: Select check frequency. Match this to your SLA. High-traffic applications benefit from 1-minute checks for rapid detection. Internal tools might only require 5-minute intervals to reduce noise.
- Step 4: Configure notification channels. Use Slack for general team awareness. Implement Webhooks to trigger automated recovery scripts. Reserve SMS or phone calls for critical, global outages.
- Step 5: Test the alert. Intentionally break a non-production endpoint. Verify that the notification reaches the right person with the correct context. If the alert fails during a test, it will fail during a real crisis.
Automating Monitoring with Infrastructure as Code (IaC)
Manual configuration is a bottleneck for growing teams. Use Terraform or Pulumi to provision monitors alongside your cloud resources. This approach ensures that every new microservice is monitored from the moment it's deployed. Version-controlled monitoring configurations allow for easy audits and rapid rollbacks. A simple configuration block might look like this:
{
  "monitor_name": "Checkout API",
  "url": "https://api.example.com/v1/checkout",
  "check_interval": 60,
  "expected_status": 200,
  "regions": ["us-east-1", "eu-central-1"]
}
Data Sovereignty and Hosting Regions
The physical location of your monitoring nodes matters. Choosing between EU and US hosting allows you to comply with local privacy regulations like GDPR or CCPA. It also impacts latency. Monitoring an EU-based server from a US-centric node can introduce artificial latency spikes. To ensure legal safety and technical accuracy, verify [GDPR compliance citations for monitoring tools] before committing to a provider. Data sovereignty is an ethical choice as much as a technical one. You can start building a compliant, high-precision uptime monitoring stack that respects your users' privacy while keeping your services online.
StatusPulse: Integrating Monitoring with AI-Driven Incident Communication
A technical failure is only half the battle. The other half is communication. A website downtime alert system that only notifies your internal team is a half-measure. It leaves your users in the dark, leading to a surge in support tickets and social media noise. Integrating monitoring with public status pages turns a technical failure into a trust-building event.
Automating the transition from a received alert to a status page update ensures transparency the moment a service fails. You shouldn't have to manually create an incident while you are busy fixing the root cause. A unified website downtime alert system handles both. It monitors your endpoints and provides a public-facing dashboard that updates in real-time, keeping stakeholders informed without manual intervention.
AI-Powered Incident Management
During a "war room" scenario, the cognitive load on SREs is immense. Every second spent drafting a stakeholder update is a second taken away from debugging. StatusPulse uses AI to bridge this gap. By analyzing technical logs and incident context, it drafts incident summaries that are technical, honest, and accessible to non-technical stakeholders.
This automation reduces the pressure on your team. You can review the AI-generated draft, make a quick adjustment, and publish it instantly. It ensures your communication remains consistent even during high-pressure outages. For more on this specific workflow, read about AI incident management for drafting updates.
Building Trust Through Transparency
Transparency is a competitive advantage. When users can verify an outage on your status page, they are less likely to flood your support desk. This reduces the operational burden on your customer success team during a crisis. You can customize your status page to match your brand's visual identity, ensuring a professional experience for your visitors. It doesn't feel like a third-party tool; it feels like part of your core service.
Industry incumbents often use complex pricing models with per-subscriber fees for these pages. This approach effectively taxes you for being transparent with your growing user base. We believe this model is a relic of the past. StatusPulse offers flat, transparent pricing with no per-subscriber fees. It is a principled alternative for teams who value integrity and simplicity. You can choose between EU or US hosting to maintain data sovereignty while keeping your services online. To get started, start monitoring with StatusPulse for reliable alerts and transparent communication.
Future-Proofing Your Incident Response Strategy
A high-fidelity website downtime alert system is the difference between a controlled response and a chaotic war room. By moving beyond basic pings and implementing multi-region verification, you ensure that your team only responds to genuine service outages. This technical precision, combined with smart threshold settings, effectively eliminates alert fatigue and protects your engineers from burnout. It turns monitoring from a source of stress into a reliable foundation for your operations.
Transparency remains your most valuable asset when things go wrong. Integrating your monitoring with public status pages reduces support volume and builds long-term user trust. StatusPulse offers a principled alternative to corporate bloat with EU-based data sovereignty and integrated AI incident management to help you draft honest updates. You get predictable, flat pricing without per-subscriber fees or hidden costs.
Build a more reliable stack with StatusPulse to ensure your monitoring is as resilient as the infrastructure it protects. Reliability is a choice; make it a straightforward one. Your users, and your on-call team, will thank you for the clarity.
Frequently Asked Questions
What is the difference between uptime and availability?
Uptime refers to the raw percentage of time a server is powered on and reachable at the network level. Availability measures whether the application is actually functional for the end user. For example, your server might show 100% uptime, but if the database is locked, your site has zero availability. High-fidelity monitoring focuses on availability by checking application-layer responses rather than just network pings.
How often should my downtime alert system check my website?
Your check frequency should align with your Service Level Agreement (SLA). High-traffic platforms typically require 1-minute intervals to minimize the impact of an outage. Internal tools or low-traffic sites might only need 5-minute checks to reduce noise and operational costs. It's a trade-off between discovery speed and log volume. Most modern teams find that 1-minute checks provide the best balance for a reliable website downtime alert system.
Can I monitor internal services that aren't public-facing?
Monitoring internal services is possible through the use of private monitoring agents or by whitelisting specific IP addresses from your monitoring provider. This allows you to track the health of staging environments or internal APIs that aren't exposed to the public internet. However, this requires careful firewall configuration. If your internal service is completely isolated behind a physical air-gap, you might need a specialized on-premise solution instead of a cloud-based SaaS tool.
What happens if the monitoring service itself goes down?
Reputable monitoring services use distributed networks with nodes across multiple geographic regions to prevent a single point of failure. If one node goes down, other regions continue the checks. This redundancy ensures that the monitoring system remains operational even if a specific data center faces an outage. It's also common practice to use a secondary, lightweight monitoring tool for your primary monitoring service to ensure total visibility and maintain a continuous feedback loop.
Do I need a separate system for API and SSL monitoring?
You don't need separate systems. Using an all-in-one platform like StatusPulse allows you to manage uptime, API endpoints, and SSL certificates from a single dashboard. This reduces tool sprawl and ensures that your incident communication is integrated with your monitoring data. Separate tools often lead to fragmented data and delayed responses. Consolidating these functions into one website downtime alert system simplifies your stack and provides better context during a crisis.
How do I prevent false positives in my downtime alerts?
False positives are best prevented by requiring multi-region verification and setting retry thresholds. Instead of alerting on a single failed check, configure your system to notify you only after three consecutive failures from at least two different geographic locations. This filters out transient network blips and local ISP routing issues. By implementing a consensus model, you ensure that your team only receives alerts for genuine, global service outages rather than temporary network noise.
Is a public status page really necessary for a small SaaS?
A public status page is essential for any SaaS, regardless of size, because it builds customer trust through transparency. During an outage, users will naturally check for updates. Providing a dedicated page reduces the volume of support tickets and prevents social media backlash. It shows that you are proactive and take reliability seriously. Even a simple page can significantly improve user retention by managing expectations during technical disruptions and providing a single source of truth.
What is the best way to receive alerts: Email, SMS, or Slack?
The best channel depends on the severity of the incident. Slack is ideal for general awareness and non-critical warnings that the whole team should see. Email provides a persistent record for auditing and post-mortem analysis. For critical, global outages, SMS or phone calls are necessary to ensure an immediate response outside of business hours. Most teams use a combination of all three, routed through an escalation policy based on the specific alert type and impact.


