

Publishing a status update within 15 minutes of a detected outage can reduce incoming support ticket volume by up to 70%. Yet, most engineering teams still struggle to justify the cost of communication tools because they lack the right data. Measuring uptime is straightforward; measuring the quality of your transparency is much harder. If your current incident communication metrics only track whether a page exists, you're missing the data that actually reduces support overhead and prevents churn.
You likely know the frustration of a "quiet" outage where support queues swell while developers are focused on a fix. We agree that technical recovery and customer communication are two separate disciplines that require different benchmarks to be effective. In this guide, we'll move beyond simple uptime to provide a clear list of quantitative and qualitative KPIs. You'll learn how to track Mean Time to Notify (MTTN) and update cadence to verify your transparency and build long-term trust with your users.
Key Takeaways
- Distinguish between operational recovery and incident communication metrics to evaluate how effectively your team maintains stakeholder trust during downtime.
- Target a Mean Time to Notify (MTTN) of under 15 minutes to potentially reduce incoming support ticket volume by up to 70% during major incidents.
- Combine quantitative data like update cadence adherence with qualitative sentiment analysis to provide a complete picture of communication performance to management.
- Automate the link between uptime monitoring and your status page to ensure first-response updates are triggered as soon as a service degradation is detected.
- Utilize AI-assisted drafting tools to quickly translate complex technical telemetry into clear, plain-language updates for your customers.
What are Incident Communication Metrics?
Incident communication metrics are specific KPIs used to evaluate how effectively a team shares information during a service disruption. While standard engineering metrics focus on the system's state, these metrics focus on the stakeholder's state. They quantify the speed, frequency, and clarity of updates provided to customers and internal teams. By tracking these data points, SREs can move from subjective feedback to objective proof of how transparency affects the bottom line.
Establishing clear incident communication metrics helps technical teams move beyond the binary of "up" or "down." It allows for a more nuanced understanding of how downtime impacts customer retention. When you can prove that proactive updates reduce support costs, it becomes much easier to justify the budget for dedicated status page infrastructure.
Why MTTR is not a communication metric
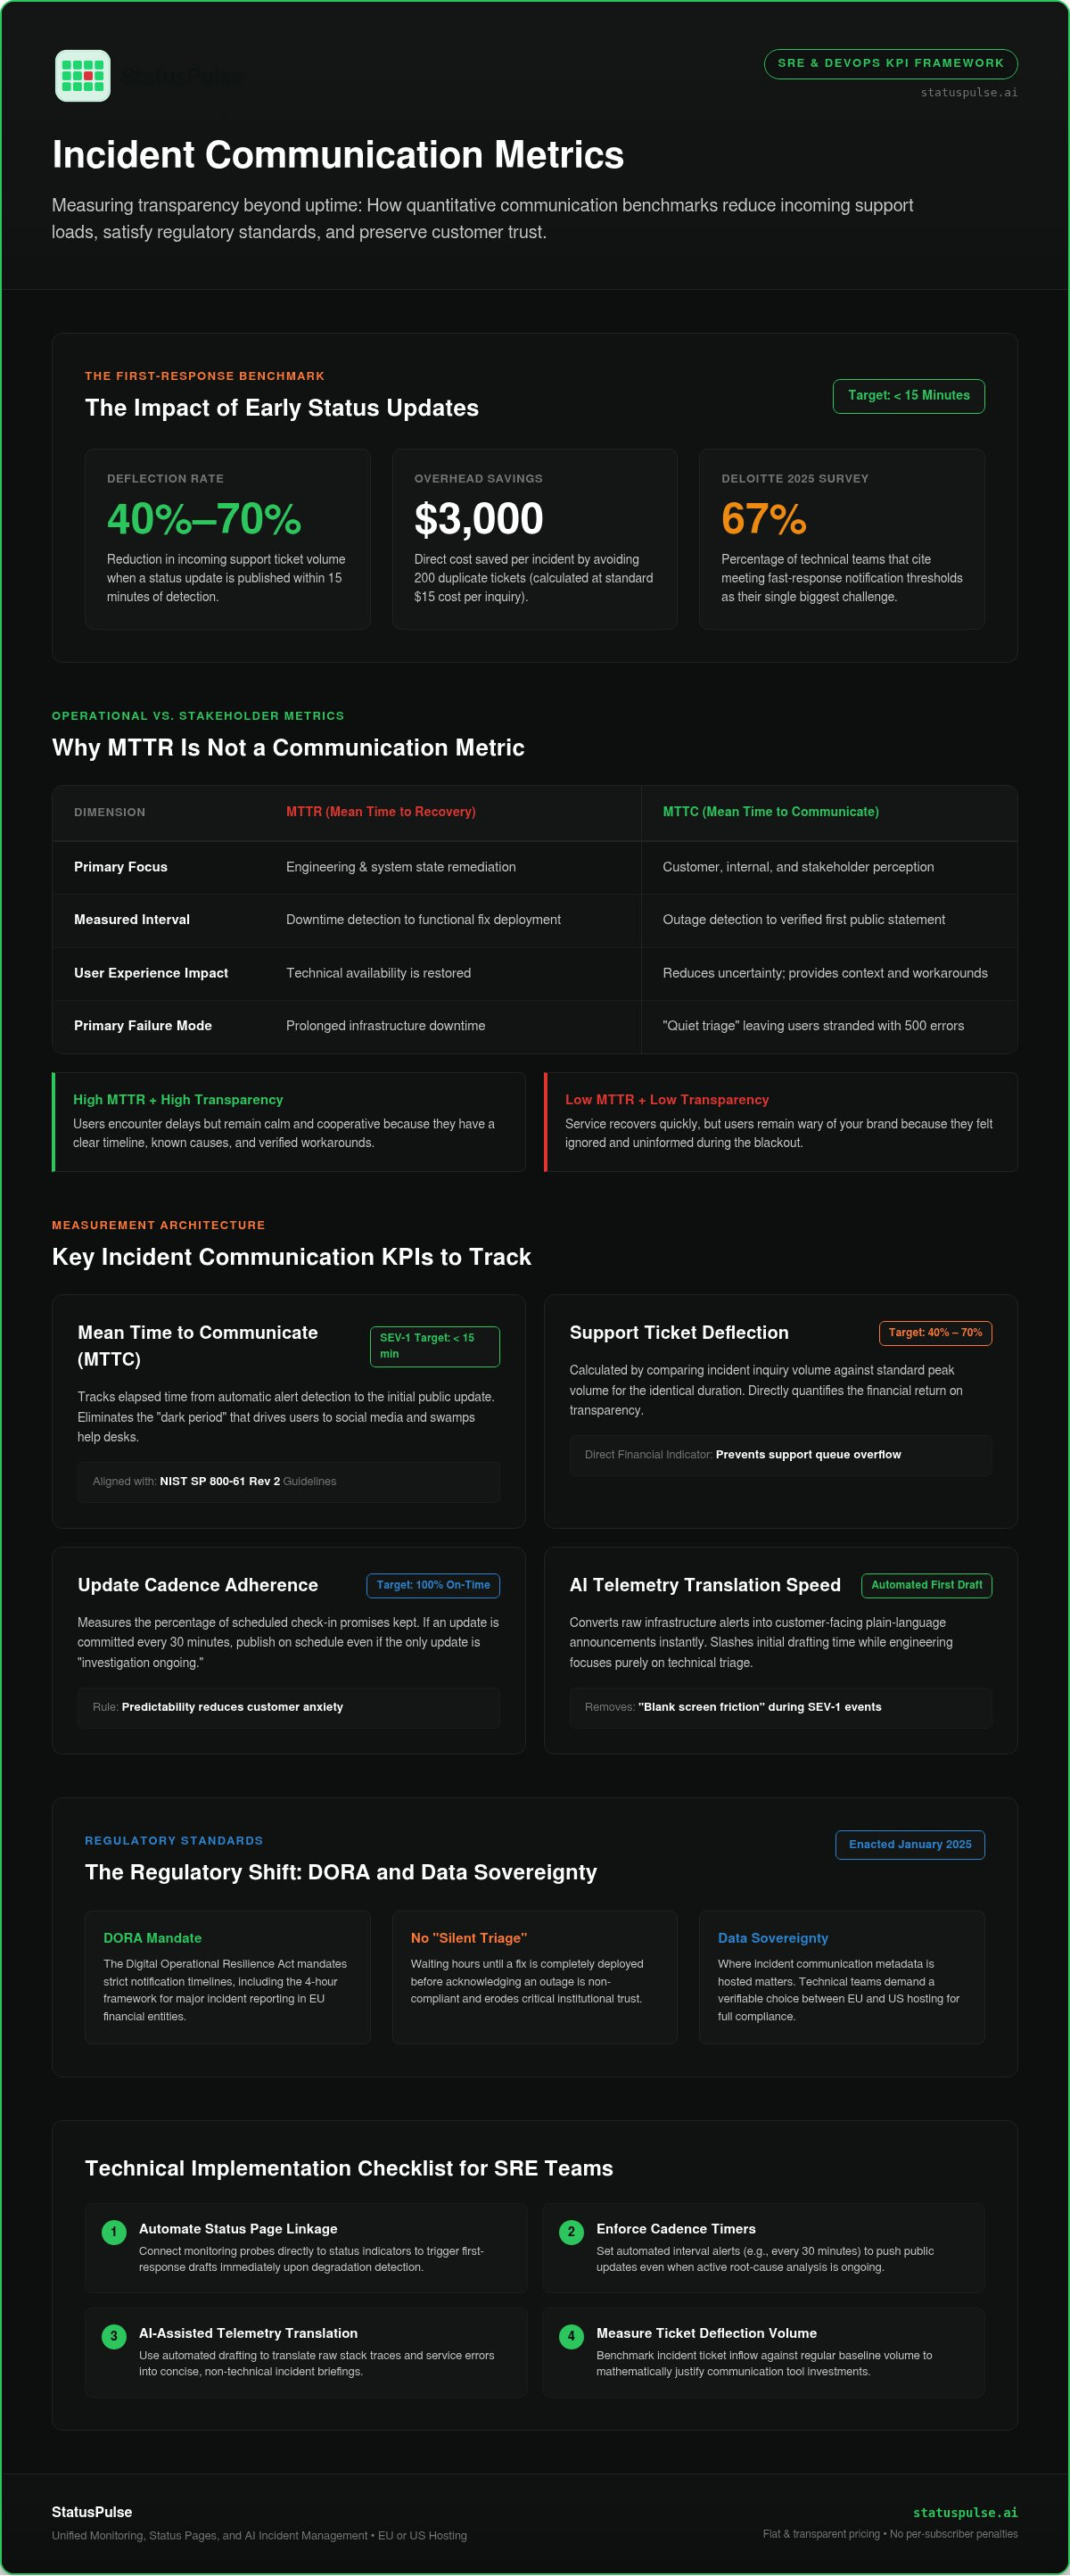
Mean Time to Recovery (MTTR) is a vital metric for engineering health, but it's a poor proxy for customer satisfaction. You can resolve a database deadlock in ten minutes, but if your users spend those ten minutes staring at a generic 500 error, the damage is done. Communication metrics fill the gap between technical resolution and the user experience. They align with established crisis communication principles by prioritizing the reduction of uncertainty over mere speed.
Consider the difference in outcomes during a typical outage:
- High MTTR, High Transparency: Users are frustrated by the delay but feel respected because they have a timeline and a workaround.
- Low MTTR, Low Transparency: Users are relieved the service is back but remain wary of your brand because they felt ignored during the blackout.
The 2026 standard for transparency
In the current regulatory environment, silent triage is no longer an option. Under the Digital Operational Resilience Act (DORA), which became fully effective in January 2025, financial entities in the EU must now adhere to strict notification frameworks for major incidents. Modern SaaS users have internalized these high standards. They expect an update on your public status page within minutes of an automated alert, not hours after the fix is deployed.
Transparency in 2026 also involves data sovereignty. Where you host your incident data matters as much as the data itself. Many technical teams now require a choice between EU and US data hosting to satisfy regional privacy compliance. Modern incident communication metrics help teams prove they're meeting these evolving expectations through verifiable data rather than vague promises of being "customer-centric."
The Roundup: 5 Essential Metrics to Track
To improve your transparency, you need to track how fast and how often you speak to your users. Most organizations measure uptime, but uptime doesn't tell you if your customers feel ignored. These five incident communication metrics provide a framework to measure the effectiveness of your response and the health of your customer trust.
Mean Time to Communicate (MTTC)
Mean Time to Communicate (MTTC) measures the gap between the moment an incident is detected and the first public update. A long "dark period" creates anxiety and drives users to social media for answers. The 2025 Deloitte regulatory survey noted that 67% of teams find meeting fast-response thresholds, like the DORA 4-hour rule, to be their biggest challenge. For SRE teams, a target of under 15 minutes is the gold standard for SEV-1 incidents.
This benchmark aligns with the NIST Computer Security Incident Handling Guide, which emphasizes structured stakeholder communication as a core capability. Using AI incident management to draft initial templates from telemetry data can slash this time. It removes the friction of starting from a blank screen while your engineers are focused on the fix.
Support Ticket Deflection
Support Ticket Deflection is the most direct financial metric for incident communication. Industry data shows that a clear status update within 15 minutes can reduce incoming ticket volume by 40% to 70%. To calculate this, compare your incident inquiry volume against your standard peak volume for an equal duration. If you avoid 200 duplicate tickets and your cost per ticket is $15, that single update saved $3,000 in support overhead. Using automated status alerts to preemptively inform users is the most effective way to protect your support team from being overwhelmed.
Other Essential Benchmarks
- Update Frequency Consistency: This tracks the percentage of scheduled updates met. If you promise updates every 30 minutes, you should meet that window 100% of the time, even if the status is "still investigating."
- Subscriber Growth and Retention: Status page engagement is a trust signal. Growing subscriber lists without high churn after outages suggest your communication is valuable.
- Incident Retrospective Completion Rate: Transparency doesn't end when the service is restored. Track how often you publish a public post-mortem within your target window, such as 48 hours.
You can automate the collection of these incident communication metrics by using an integrated status page and monitoring platform that tracks update timestamps and subscriber activity automatically.
Quantitative vs. Qualitative: Choosing the Right Data
Effective incident communication metrics require a balance between hard numbers and human perception. Quantitative data, such as Mean Time to Notify (MTTN), provides the objective benchmarks needed for management reporting. It answers the technical question of whether your team met its Service Level Objectives (SLOs). However, numbers alone don't reveal if your users actually felt informed or merely processed by an automated system.
Qualitative data fills this gap by capturing the emotional state of your users. While quantitative metrics are fast to collect and easy to graph, qualitative insights offer the depth required to understand long-term brand loyalty. A hybrid approach ensures that your reliability strategy accounts for both operational efficiency and stakeholder trust. You can't manage what you don't measure, but you also can't automate trust.
Measuring Customer Sentiment
Post-incident surveys are a primary tool for gauging how well you spoke to your audience. Instead of asking about the downtime itself, focus on the clarity and frequency of updates. Analyzing reactions on social media or community forums during an outage also provides real-time feedback on your transparency levels. Honest communication, even when technical details are embarrassing, often results in lower churn than vague, corporate-speak updates. Users value a technical peer-to-peer relationship over polished marketing jargon that hides the root cause.
The limitations of automated metrics
Automation is necessary for scale, but a 100% automated status page can feel robotic. If every update is a generic "we are investigating" message triggered by a webhook, users stop trusting the page. The Google SRE incident management framework suggests designating explicit communication roles to ensure updates are both timely and meaningful. This human-in-the-loop approach allows for nuanced updates that automation simply can't replicate.
Balancing automation with human oversight is critical. You might use monitoring tools to trigger initial alerts, but a human should provide the final context. This ensures that your incident communication metrics reflect a strategy built on integrity rather than just checking a box. Providing specific, verified technical details shows respect for your audience's expertise. It builds a foundation of trust that survives even the most complex technical disruptions.
Tools and Implementation for Metric Collection
Collecting accurate incident communication metrics requires a technical stack where monitoring and communication tools are tightly coupled. Manual tracking during a major outage is rarely accurate. Engineers are focused on technical recovery, not logging the exact second a status update was published. By integrating uptime monitoring directly with your status page, you create a verifiable audit trail for every incident.
API monitoring can trigger internal alerts that start the communication clock before a human even opens a ticket. This automation ensures your Mean Time to Notify (MTTN) is based on system telemetry rather than manual entry. When collecting subscriber data for these alerts, privacy is a priority. You should use tools that allow for GDPR compliant data handling without the per subscriber fees that often penalize broad transparency. Keeping your monitoring infrastructure independent from your primary application stack ensures these metrics remain accessible even during a total site failure.
Infrastructure for Data Sovereignty
The geographic location of your status page hosting is a critical trust factor for many technical teams. If your primary infrastructure is in the EU, your status page should ideally reside there too to simplify regulatory compliance. StatusPulse offers a choice between EU or US hosting for your monitoring and status page data. This flexibility supports regional data sovereignty requirements and ensures your communication remains online even if your primary cloud provider faces a regional disruption. Relying on a single global region for both your product and your status page creates a single point of failure for your transparency.
Automating the Dashboard
Visualizing communication speed alongside system performance reveals the true impact of your strategy. You should connect support desk tools like Zendesk or Intercom to your incident timelines. This allows you to see the exact moment a status update was posted and the subsequent drop in new ticket creation. This correlation is the only way to prove the financial value of incident communication. You can find more detail on building these systems in our guide on the architecture of incident communication transparency.
Automating these dashboards removes the administrative burden from your SRE team. Instead of manually calculating ticket deflection, the data is ready for your next retrospective. If you're tired of complex pricing models that charge for every subscriber, you can start measuring your transparency with StatusPulse using our flat rate all in one platform.
Improving Your Metrics with StatusPulse
StatusPulse is designed to automate the collection of incident communication metrics by removing the silos between monitoring and reporting. When your uptime checks and status pages exist on the same platform, the system can automatically calculate the delta between a failure detection and your first public response. This provides a single source of truth for your Mean Time to Communicate (MTTC) without requiring manual data entry during a crisis.
The AI incident management features act as a technical assistant for your SRE team. Instead of forcing an engineer to stop debugging to write a public update, the AI drafts a status report based on the current telemetry. A human performs the final review and action, maintaining integrity while slashing the time spent on administrative tasks. This consolidation helps teams meet the strict notification windows required by regulations like NIS2 or DORA.
Transparent Pricing for Transparent Teams
Many legacy status page providers use pricing models that penalize you for being popular. They often charge per subscriber or enforce strict limits on entry-level tiers [VERIFY: competitor X entry-level subscriber limits]. This creates a "transparency tax" where your costs increase exactly when your service is struggling. StatusPulse uses a flat pricing model with no per-subscriber fees, ensuring you can keep every stakeholder informed without worrying about an unexpected bill.
We believe that cost should never be a barrier to honesty. By removing the financial friction of notifying large user bases, we help teams focus on what matters: fixing the problem and keeping users calm. This approach aligns with our goal of being a fair alternative to corporate bloat and complex enterprise contracts. You shouldn't have to choose between your budget and your users' trust.
Getting Started in 5 Minutes
Setting up your first public status page and uptime check takes less than five minutes. You can integrate the AI incident management workflow directly into your Slack or Discord channels, allowing your team to draft updates without leaving their primary environment. This integration ensures that communication becomes a natural part of the incident response lifecycle rather than a separate, burdensome chore.
For a deeper look at how to structure your stack for maximum reliability, see our guide on website uptime monitoring tools. If you are ready to build a more transparent relationship with your users, you can get started with StatusPulse today. We provide the technical precision you need with the plain-spoken ethics you expect from a dedicated team.
Standardizing Your Path to Stakeholder Trust
Reliability isn't just about how often your systems fail. It's about how you respect your users when they do. By tracking incident communication metrics like Mean Time to Notify and ticket deflection rates, you move beyond guesswork. Transparency isn't an ethical luxury; it's a financial necessity. It protects your support team and reduces churn. Shifting from silent triage to proactive updates requires stable infrastructure to ensure your data stays accessible and compliant.
StatusPulse provides the tools to manage this transition without the complexity of legacy enterprise software. Use our AI-powered drafting and choice of EU or US hosting to maintain user confidence while you focus on recovery. Our flat pricing model means you're never penalized for growing your audience or keeping them informed during a crisis. It's time to build a more transparent incident process with StatusPulse. Trust is earned in every outage. Your team is ready to lead the way.
Frequently Asked Questions
What is the most important metric for incident communication?
Mean Time to Notify (MTTN) is widely considered the most critical metric. It tracks the duration between system failure detection and your first public acknowledgment. While other incident communication metrics provide depth, MTTN directly correlates with customer anxiety levels. A fast MTTN prevents users from flooding social media or support channels looking for answers. It establishes you as the primary source of truth for the incident immediately.
How do I calculate Support Ticket Deflection?
You calculate Support Ticket Deflection by comparing the volume of incident related inquiries against your standard peak volume for the same period. The formula is 1 minus the ratio of actual inquiries to the expected baseline. Industry data suggests that a status update within 15 minutes can deflect 40% to 70% of tickets. This metric provides the clearest financial justification for investing in automated communication tools and public status pages.
What is a good benchmark for Mean Time to Communicate (MTTC)?
A strong benchmark for Mean Time to Communicate (MTTC) is under 15 minutes for critical SEV-1 incidents. While regulations like DORA set a 4 hour threshold for major ICT incidents, customer expectations are much higher. For less severe SEV-2 or SEV-3 issues, a 30 to 60 minute window is often acceptable. The goal is to acknowledge the problem before your users encounter it and report it themselves.
Can AI really help with incident communication metrics?
AI assists by drafting initial status updates from raw telemetry and incident logs. This reduces the mental load on engineers who are trying to fix the underlying technical issue. By using an AI assistant to summarize complex system states into plain language, you can significantly lower your MTTC. StatusPulse uses AI incident management to help teams publish accurate updates faster, ensuring that incident communication metrics remain within target thresholds.
Why should I track communication metrics separately from uptime?
Uptime measures system availability, but communication metrics measure the quality of your relationship with users during a failure. High uptime doesn't guarantee customer retention if your rare outages are handled with silence. Tracking these separately allows you to identify if your support overhead is high because of the technical failure itself or because of poor transparency. It helps engineering and support teams align on stakeholder management goals.
Does the location of my status page hosting affect trust?
Hosting location is a significant factor in building trust, particularly for users concerned with data sovereignty. If you serve customers in the EU, hosting your status page and monitoring data in the same region supports GDPR compliance and regional privacy standards. StatusPulse offers a choice between EU and US hosting to ensure your incident metadata resides where your legal requirements demand. This regional focus demonstrates a commitment to privacy that generic global providers often overlook.
How often should I update my status page during an active incident?
You should aim to update your status page every 20 to 30 minutes during a major service disruption. Consistency is more important than having new technical details to share. Even a brief message stating that the team is still investigating maintains the rhythm of transparency and prevents users from assuming the incident has been forgotten. For long running incidents, you can extend this cadence to 60 minutes once the situation is stable.


