

A "green" status on your SMTP server is a vanity metric that hides silent delivery failures. Email round-trip monitoring is the process of sending a test message to a controlled inbox and verifying its arrival to confirm the entire mail flow is functional. With spam accounting for nearly 48% of global traffic in 2026, checking if a port is open is no longer enough to guarantee that your system notifications reach their destination.
We agree that monitoring should reflect the actual user experience, not just the server state. This article explains how to implement Email Round-Trip Monitoring: Catching Deliverability Failures Before Your Customers Do to validate your entire infrastructure. You'll learn how to deploy automated probes that detect logic-level failures, reduce your Time to Detection (TTD), and automate incident communication when mail flow breaks. We'll cover the configuration of these loops and how they help you stay ahead of strict 2026 bulk sender requirements while maintaining high deliverability standards.
Key Takeaways
- Identify why standard uptime checks fail to detect logic-level issues like disk saturation, expired relay credentials, or DNSBL blacklisting.
- Master the architecture of Email Round-Trip Monitoring: Catching Deliverability Failures Before Your Customers Do by using unique tracking headers and automated echo responses.
- Evaluate the technical trade-offs between proactive synthetic probes and reactive log analysis to determine the best fit for your infrastructure.
- Secure your monitoring loops by whitelisting probe IP ranges and correctly configuring SPF, DKIM, and DMARC for dedicated subdomains.
- Connect technical delivery probes to public status pages to automate incident communication and reduce your Time to Detection (TTD).
Why 'Port 25 is Up' is a Dangerous Lie for SaaS Reliability
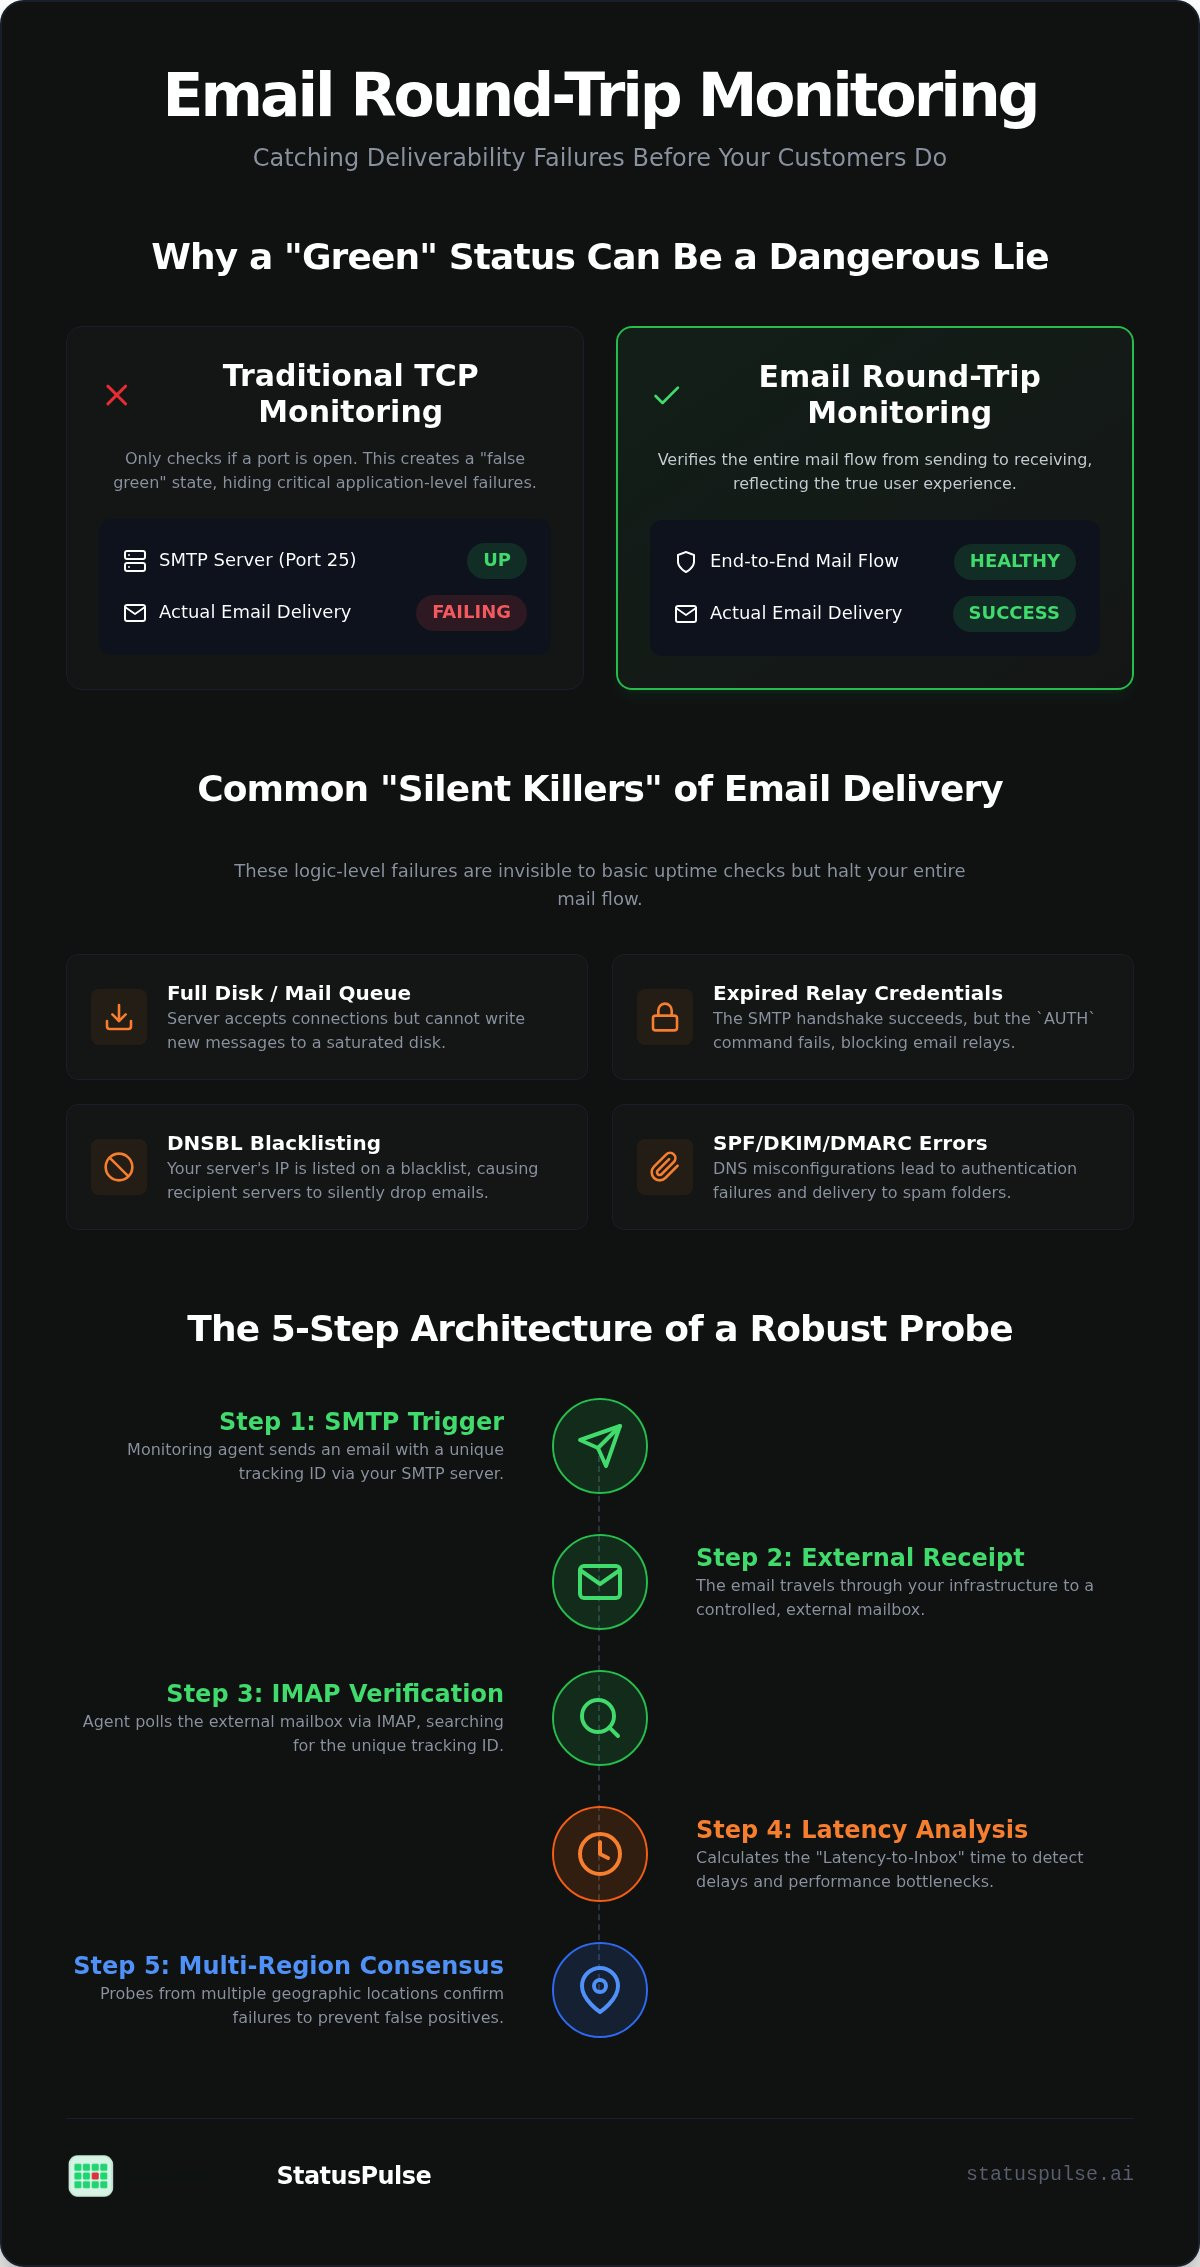
Standard uptime tools are binary. They ask: "Is the port open?" If the server acknowledges a TCP handshake on port 25, the dashboard shows a green light. This tells you the network is reachable, but it says nothing about your ability to deliver a message. Relying on basic network monitoring for email infrastructure is a reliability gamble. It ignores the complex handshake and filtering logic that happens after the connection is established.
Silent failures happen at the application logic layer. Your SMTP server might be listening, but if the disk partition holding the mail queue is full, no messages move. If your relay credentials expired, the initial handshake succeeds but the subsequent AUTH command fails. If your IP hit a DNSBL (Domain Name System Blacklist), the connection remains stable while your emails are silently dropped by recipient filters. Traditional monitors stay green while your customers wait for password resets that never arrive. This disconnect creates a "false green" state that delays incident response.
The Limits of Simple TCP Monitoring
A TCP handshake on ports 25, 465, or 587 only proves a service is listening. It doesn't validate the SMTP protocol state machine or the underlying mail transfer agent. Many modern mail servers use "tarpitting." This technique slows down connections to discourage automated spam. A basic monitor sees a responsive port and ignores the fact that the connection is too slow for production traffic. Network stability is not service availability. Logic failures, like misconfigured SPF records, exist outside the scope of a ping. You need a tool that speaks the language of email, not just packets.
Defining the Round-Trip Loop
True reliability requires a closed-loop system. This is where Email Round-Trip Monitoring: Catching Deliverability Failures Before Your Customers Do becomes essential. The process validates three pillars: outbound SMTP submission, external processing, and inbound retrieval via IMAP or POP3. It tests the entire relay chain, including third-party providers like SendGrid or Postmark. Round-trip monitoring is the only way to verify the 'last mile' of delivery by confirming that a message sent actually arrived. By implementing a monitoring loop that mimics real user behavior, you move beyond vanity uptime metrics toward functional integrity.
The Architecture of a Robust Email Round-Trip Probe
Building a round-trip probe requires more than a simple cron job. It is a distributed state machine designed to verify that your mail server, DNS records, and third-party relays are all cooperating. This architecture ensures Email Round-Trip Monitoring: Catching Deliverability Failures Before Your Customers Do by simulating a complete user interaction. The process follows a strict five-step sequence.
- Step 1: The SMTP Trigger. The monitoring agent initiates an SMTP handshake with your mail server. It injects a unique tracking ID into the message headers.
- Step 2: External Receipt. The message is routed through your infrastructure to an external mailbox. This mailbox acts as a neutral third party.
- Step 3: IMAP Verification. The monitoring agent polls the external mailbox via IMAP or POP3. It searches for the specific tracking ID generated in Step 1.
- Step 4: Latency Analysis. The system calculates the delta between the send time and the receipt time. This "Latency-to-Inbox" metric identifies bottlenecks in the relay chain.
- Step 5: Multi-Region Consensus. To avoid false positives, the system verifies failures from multiple geographic locations. A failure in Frankfurt must be confirmed by a probe in New York before an alert triggers.
SMTP and IMAP Handshake Requirements
Security is paramount during the probe transmission. You must configure STARTTLS or SSL/TLS to protect credentials. Use unique UUIDs in the X-Probe-ID or Subject line to prevent collisions during high-frequency testing. Managing the external mailbox is also a technical requirement. Automated scripts should delete processed messages to prevent "Inbox Full" errors. These errors can cause your monitor to report a failure when the actual mail flow is healthy.
Measuring Latency vs. Availability
In a SaaS environment, a 10-minute delivery delay is often as damaging as a total outage. Password resets and 2FA codes lose their utility if they arrive late. Your monitoring should track the Time to First Byte (TTFB) of the SMTP greeting to detect server load issues early. Set realistic thresholds for your environment. Internal mail routing should be near-instant, while external relays might require a 60-second grace period. StatusPulse provides uptime monitoring that handles these multi-region checks, ensuring you only receive alerts for genuine infrastructure failures rather than localized network noise.
Comparing Monitoring Strategies: Probes vs. Log Analysis
Choosing a monitoring strategy involves balancing technical depth with operational overhead. Synthetic probes act as a consistent heartbeat for your mail infrastructure. They are proactive and predictable. They send test messages at fixed intervals to ensure the delivery path remains open. However, probes follow a specific, programmed route. They might miss unique edge cases that only real user traffic triggers under specific conditions. Log analysis, using data from Postfix or Exim, offers the opposite. It provides a granular view of every transaction that passes through your server. But it is inherently reactive. You only see failures after they have already impacted a customer.
Scaling log analysis across modern cloud environments is difficult. Aggregating logs from multiple regions requires significant infrastructure and compute power. Third-party webhooks from Email Service Providers (ESPs) are another option. They provide real-time data but create a circular dependency. If your ESP's reporting API experiences downtime, you lose all visibility into your mail flow. This is why Email Round-Trip Monitoring: Catching Deliverability Failures Before Your Customers Do is the preferred method for baseline reliability. It operates independently of your primary mail logs and provides a neutral "truth layer" for your infrastructure.
Privacy and Security Trade-offs
Synthetic probes are inherently privacy-first. They use generated data, which avoids exposing Personally Identifiable Information (PII) to your monitoring stack. Granting a third-party tool access to your production mail logs is a security risk. It increases your attack surface and complicates compliance audits. For a broader look at maintaining system health beyond email, see our API Monitoring: The Developer’s Guide to High Availability in 2026. In Europe, data sovereignty is a legal requirement. Using EU-based monitoring helps you meet GDPR standards without moving sensitive log data across international borders.
Cost and Complexity Analysis
Self-hosting a log aggregation stack like ELK or Grafana Loki carries high hidden costs. You pay for storage, compute, and the engineering hours required to maintain the pipeline. Cloud-based probes offer a leaner alternative. Flat-rate pricing models, like those offered by StatusPulse, make high-frequency checks affordable. You don't get penalized for scaling your monitoring as your traffic grows. This predictability is vital for DevOps teams managing tight budgets. While log analysis remains useful for post-mortem forensics, Email Round-Trip Monitoring: Catching Deliverability Failures Before Your Customers Do provides the immediate, clean signal needed for rapid incident response.
Implementation Best Practices: Avoiding the 'Spam Trap' Loop
Setting up a probe is only the first step. You must ensure your monitoring traffic isn't treated as a malicious attack. Without proper configuration, your own security layers might block the probes, leading to false positives and alert fatigue. Email Round-Trip Monitoring: Catching Deliverability Failures Before Your Customers Do requires a delicate balance between high-frequency testing and reputation management. If you whitelist entire IP blocks without restriction, you open a back door for spoofing; however, if you are too restrictive, your monitors will fail during routine security updates.
Monitoring storms are a real risk for smaller SMTP relays. If your probe frequency is too high, you might inadvertently trigger your own rate-limiting or anti-DoS protections. We recommend starting with a conservative interval and gradually increasing frequency as you validate your server's capacity. This prevents the monitoring tool from becoming the source of the outage it is designed to detect.
Authentication and Reputation Management
Use dedicated subdomains for your monitoring traffic. This separates the reputation of your testing loops from your primary production domain. If a configuration error causes your probes to hit a spam trap, your main transactional mail flow remains unaffected. You must configure SPF, DKIM, and DMARC specifically for these subdomains. A "p=quarantine" or "p=reject" policy is essential even for test traffic to maintain high deliverability standards and meet 2026 bulk sender requirements.
# Example DMARC record for a monitoring subdomain
_dmarc.status.example.com. IN TXT "v=DMARC1; p=quarantine; adkim=s; aspf=s; rua=mailto:[email protected]"
Regularly check your monitoring IP addresses against DNSBLs. Even legitimate probes can get flagged if the traffic patterns look like a "low and slow" dictionary attack. Using a dedicated subdomain allows you to isolate these issues quickly without interrupting customer communication.
Handling Greylisting and Tarpitting
Greylisting is a common anti-spam technique that temporarily rejects mail from unknown senders with a "451 Try Again Later" response code. Most basic monitors interpret this as a hard failure. A robust probe must understand SMTP retry logic. It should recognize the 451 code and wait for a specific window before attempting the "trip" again. This differentiates between a temporary security handshake and a genuine infrastructure outage.
Tarpitting behaves similarly by intentionally slowing down the SMTP response. If your monitoring timeout is too aggressive, you will record a failure even though the message would have eventually cleared the queue. For deeper insights into network-level troubleshooting that affects these handshakes, consult our Website Availability Monitoring: A Technical Guide to Uptime and Reliability. For teams who want to avoid the complexity of managing these retry windows manually, you can automate your uptime monitoring with a platform that handles multi-region verification and SMTP state logic out of the box.
Closing the Loop: From Deliverability Probes to Status Pages
Monitoring data is a liability if it remains trapped in a technical silo. You need to bridge the gap between technical probes and customer communication to maintain trust during an outage. When Email Round-Trip Monitoring: Catching Deliverability Failures Before Your Customers Do triggers an alert, the "Incident Detected" state should update your public status page automatically. This automation ensures that your support team isn't the last to know about a mail flow disruption.
Transparency is a powerful churn-reduction strategy. Customers value honesty over perfection. Telling your users about a mail flow delay before they open a support ticket preserves your professional reputation. It reduces the sudden influx of "where is my email" tickets that often overwhelms help desks during a silent failure. Proactive communication turns a potential technical disaster into a managed event.
AI-Assisted Incident Communication
StatusPulse uses AI to transform raw SMTP error codes into clear, technical summaries. Instead of "550 5.7.1 Service unavailable," the system drafts an update explaining that outbound mail is stable while inbound processing is experiencing delays. This nuanced approach avoids panic while maintaining technical accuracy. It helps you acknowledge trade-offs, such as explaining that internal relays are functional even if a third-party provider is struggling.
For a deeper look at the ethics of this approach, read about The Architecture of Incident Communication Transparency. Proving your reliability during a procurement audit requires more than just verbal promises. A public, historical record of your mail flow uptime serves as a technical audit trail for enterprise partners. This data demonstrates that you have the infrastructure to detect and resolve issues before they impact the end user.
Public vs. Private Status Dashboards
Deciding what to show on a public page requires a strategic choice. You might show high-level availability publicly while keeping granular latency metrics on a private dashboard for your internal team. Integrating third-party ESP status, such as AWS SES or Postmark, alongside your own probes provides a comprehensive view of the entire delivery ecosystem. This prevents your team from wasting hours troubleshooting an upstream issue that is already documented elsewhere.
You can start monitoring your mail flow with StatusPulse today. Our platform connects your deliverability probes directly to public status pages, ensuring your users are always informed by a single source of truth. We offer flat pricing without per-subscriber fees and the choice of EU or US hosting to support your specific data sovereignty requirements. This approach ensures your monitoring is as ethical as it is technically precise.
Modernizing Your Email Reliability Stack
Reliability in 2026 is no longer about simple network availability. It requires verifying the entire logic layer of your mail flow. By implementing Email Round-Trip Monitoring: Catching Deliverability Failures Before Your Customers Do, you move beyond "green" dashboards that hide silent outages like full disk partitions or expired credentials. Synthetic probes provide a proactive truth layer that reactive log analysis often misses.
Connecting these probes to automated incident communication reduces your time to detection and strengthens customer trust. You can build a more transparent SaaS with StatusPulse uptime monitoring. Our platform offers a choice between EU and US hosting for data sovereignty and utilizes AI to draft honest, technical incident updates. With transparent, flat pricing and no per-subscriber fees, you can scale your monitoring infrastructure without budget surprises. It's time to stop guessing and start validating every message your system sends.
Frequently Asked Questions
What is the difference between SMTP monitoring and round-trip monitoring?
SMTP monitoring only verifies that the service is listening on a specific port. It doesn't prove that mail is actually moving. Round-trip monitoring validates the entire delivery logic by sending a test message and confirming its arrival in an external inbox. This is the core of Email Round-Trip Monitoring: Catching Deliverability Failures Before Your Customers Do, as it tests the mail queue, relay credentials, and recipient filtering in one closed loop.
Will round-trip monitoring emails affect my domain's sender reputation?
It won't hurt your reputation if you use dedicated subdomains and low-volume traffic. Probes simulate legitimate system notifications rather than bulk marketing. By configuring SPF, DKIM, and DMARC correctly, you ensure these tests are indistinguishable from healthy production traffic. High-frequency probes should be balanced to avoid triggering rate limits or "monitoring storms" on smaller SMTP relays.
How often should I run email round-trip checks?
Most SaaS teams run checks every 5 to 15 minutes. This frequency balances the need for a low Time to Detection (TTD) with server resource management. If you manage high-priority transactional mail like 2FA codes, you might increase frequency to every 2 minutes. Always match the interval to your server's specific retry logic and greylisting windows to avoid recording false positives.
Can I monitor third-party providers like SendGrid or Gmail with this method?
Yes, you can monitor any provider that allows SMTP submission and IMAP or POP3 retrieval. This method is specifically useful for validating third-party relays like SendGrid, Postmark, or AWS SES. It ensures their infrastructure is successfully handing off your messages to the wider internet. You aren't just monitoring their generic status; you're monitoring your specific integration and credential health with them.
What happens if the monitoring probe itself is blocked by a spam filter?
If a probe is blocked, the monitor records a failure. This is the intended behavior. A blocked probe often signals a reputation issue or a misconfigured filter that would also impact your real customers. You should investigate the SMTP bounce code or the spam headers in the receiving mailbox to determine why the filter was triggered. This allows you to fix deliverability issues before they cause churn.
How do I handle GDPR compliance when a monitoring tool sees my email headers?
Choose a provider that offers EU-based hosting to keep metadata within the region. Since probes use synthetic data rather than real customer PII, the compliance risk is significantly lower than scraping production logs. Ensure your monitoring tool doesn't store sensitive headers longer than necessary for the validation check. StatusPulse supports data sovereignty by offering a choice between EU and US hosting for all monitoring data.
Is round-trip monitoring better than checking my mail server logs?
Round-trip monitoring is proactive, while log analysis is reactive. Logs tell you what happened to real messages in the past, but they don't help you detect a "dead" queue until customers start complaining. Email Round-Trip Monitoring: Catching Deliverability Failures Before Your Customers Do provides an immediate signal that your infrastructure is broken before real traffic is affected. Logs are better for deep forensics; probes are better for immediate alerting.
Can I display my email deliverability status on a public status page?
Yes, displaying deliverability metrics on a public status page builds enterprise trust. It shows that you value transparency and proactively manage your infrastructure. You can automate this process so a failed probe immediately updates your status page with an incident report. This keeps your users informed and reduces the volume of repetitive support tickets during mail flow disruptions.


