

What if your browser console says "Connected," but your users are staring at a frozen price ticker or an empty chat feed? It's a frustrating reality for many SREs. The HTTP 101 Switching Protocols response is just a "hello," not a guarantee of ongoing life. Is Your WebSocket Actually Alive? Monitoring Real-Time Connections Beyond the Handshake requires looking at the continuous flow of frames rather than just the initial connection event.
You know the feeling of a "zombie" connection. The browser thinks it's active, but a load balancer silently killed the idle socket sixty seconds ago. We've seen this happen frequently with default Nginx proxy_read_timeout settings or Google Cloud's 30-second backend limits. It leaves your frontend in a state of suspended animation while your backend assumes everything is fine. These silent failures are harder to debug than a hard crash.
This guide explains how to move past basic handshake checks to ensure your real-time data actually reaches its destination. You'll learn how to detect half-open failures and implement robust heartbeat mechanisms. We will cover specific configuration examples for proxies and show you a reliable way to report real-time health on a public status page. By the end, you'll have a strategy to manage persistent connections without the stress of hidden downtime.
Key Takeaways
- Move beyond the "101 Switching Protocols" status to verify that application data is actually moving through the pipe.
- Identify and manage "zombie" connections where the client or server remains unaware that the network path has been severed.
- Implement application-level heartbeats to bypass proxies and load balancers that often ignore or strip standard protocol-level pings.
- Tune infrastructure timeouts in Nginx and AWS to prevent silent socket termination during periods of low activity.
- Learn the techniques to answer the critical question: Is Your WebSocket Actually Alive? Monitoring Real-Time Connections Beyond the Handshake ensures your users never face a frozen interface.
The WebSocket Handshake Illusion: Why '101 Switching Protocols' is Not Health
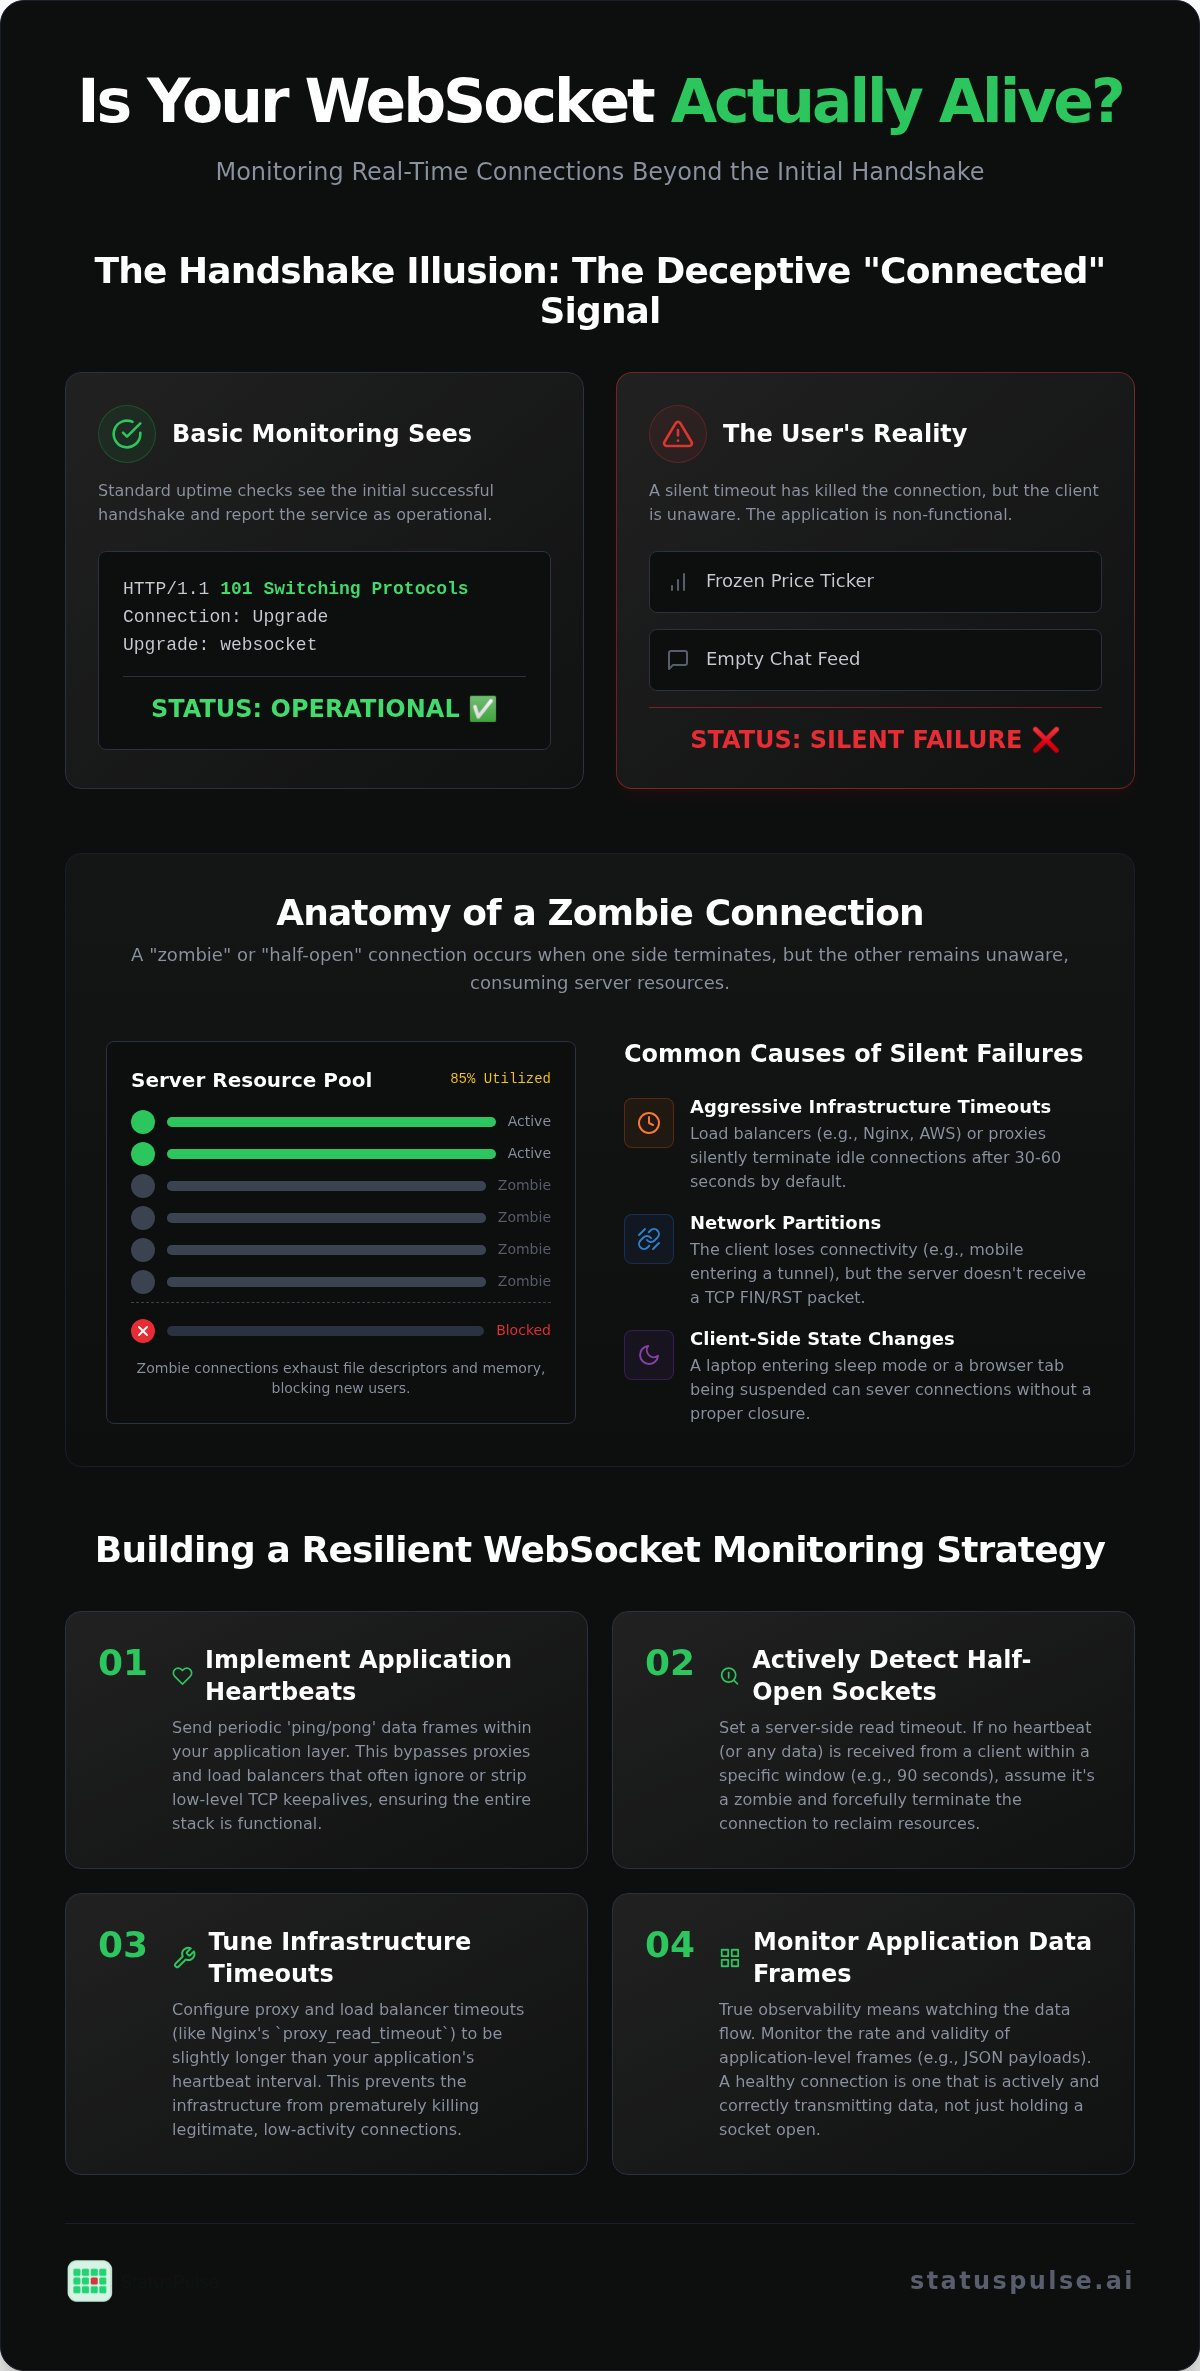
The 101 Switching Protocols status code is the most deceptive metric in real-time architecture. Most monitoring tools treat this response as a definitive "up" signal. It confirms that your server received a request and agreed to the protocol upgrade. However, this success is a single point in time. It doesn't tell you if the connection survives for ten seconds or ten hours. Is Your WebSocket Actually Alive? Monitoring Real-Time Connections Beyond the Handshake requires looking past this initial handshake to see if data actually flows.
A successful handshake only proves that your routing logic and initial authentication worked. It doesn't guarantee that the underlying TCP socket remains functional for application data. When a socket enters a "Silent Failure" state, the client remains in a connected status while the stream of updates has actually stopped. This creates a dangerous gap in observability where your dashboard shows green lights while your users see stale data.
The Lifecycle of a Persistent Connection
The WebSocket protocol, defined by RFC 6455, begins with a standard HTTP GET request. The client includes an "Upgrade" header and a unique "Sec-WebSocket-Key." If the server supports the version requested, it responds with the 101 status. This transition is the most common failure point for misconfigured proxies that don't recognize the Upgrade header. Unlike REST APIs, which are stateless and short-lived, WebSockets are stateful. This persistence creates a unique challenge. You aren't just monitoring an endpoint; you're monitoring a long-lived relationship between a client and a specific server instance.
Why Traditional Uptime Checks Miss WebSocket Issues
Standard uptime monitors usually perform a HEAD or GET request to an endpoint. They check for a 200 OK or a 101 Switching Protocols response and then disconnect. This approach fails to identify WebSocket degradation for several reasons:
- No session persistence: Synthetic monitors rarely stay connected long enough to encounter the idle timeouts that kill real user sessions.
- TCP-level blind spots: A load balancer might keep the TCP connection "open" to the client even if the backend service has crashed or the process is hung.
- Frame-level corruption: Protocol-level connectivity doesn't mean your application is successfully sending JSON frames or binary data.
For an SRE, handshake success is merely a protocol negotiation; operational health is the continuous, bidirectional exchange of valid application frames over time. If you only monitor the 101 response, you're only monitoring the door, not the room. Robust observability requires staying in the room to ensure the lights stay on.
The Anatomy of a Zombie Connection: Identifying Silent Failures
A "Zombie Connection" is the most common cause of silent failures in real-time systems. It occurs when a socket enters a half-open state. One side of the connection has been terminated, but the other side remains unaware of the drop. This usually happens because the underlying TCP stack never received a FIN or RST packet to signal a graceful close. Is Your WebSocket Actually Alive? Monitoring Real-Time Connections Beyond the Handshake requires identifying these orphaned sockets before they exhaust your server resources.
These failures often stem from network partitions or client-side behavior. For instance, a mobile device moving into a tunnel or a laptop entering sleep mode can sever the connection without a proper handshake closure. The server continues to hold the socket open, waiting for data that will never arrive. This leads to a slow creep in memory usage and file descriptor exhaustion, eventually preventing new users from connecting entirely.
Half-Open Connections: The SRE's Nightmare
From the server's perspective, a half-open connection is indistinguishable from a quiet one. In high-concurrency environments like Node.js or Go, each socket consumes a dedicated portion of memory for read and write buffers. If your backend doesn't aggressively reap these orphaned sockets, you will eventually hit the `ulimit` for file descriptors. This often results in "EMFILE: too many open files" errors, crashing your service even when traffic seems low. Managing these states is a core part of maintaining a reliable API monitoring strategy that accounts for more than just simple uptime.
Measuring Throughput and Frame Latency
Connection counts are a vanity metric. To understand the health of your stream, you must track bytes-in and bytes-out at the socket level. If a connection is open but hasn't transmitted a frame in several minutes, it's likely a zombie. The official WebSocket specification provides the framework for Ping and Pong frames to solve this, but monitoring must also account for frame-level latency.
- Time to First Frame (TTFF): Measure the delay between the 101 handshake success and the first application-level message.
- Activity Thresholds: Set specific limits for how long a connection can remain idle based on your expected message frequency.
- Head-of-Line Blocking: Watch for scenarios where a single large or slow-to-process frame stalls the entire TCP stream, causing a spike in p99 latency for real-time updates.
If you notice high connection counts paired with near-zero throughput, your infrastructure is likely hosting a graveyard of zombie sockets. Effective monitoring involves verifying that the data pipe is actually functional, not just that the door is still propped open.
Heartbeats vs. Protocol Pings: Implementing Reliable Health Checks
To solve the zombie connection problem, you need a mechanism that forces the network path to remain active. The WebSocket Protocol (RFC 6455) defines specific control frames for this purpose. Choosing between native protocol pings and application-layer heartbeats is a decision that impacts both reliability and observability. Is Your WebSocket Actually Alive? Monitoring Real-Time Connections Beyond the Handshake depends on which layer you choose to monitor.
We recommend a 30-second heartbeat interval for most production environments. This keeps load balancer timers from expiring. It also avoids excessive battery drain on mobile clients. If you need higher precision, you can drop this to 10 or 15 seconds. Be careful. Shorter intervals increase server CPU load as you scale to thousands of concurrent users.
Protocol-Level Ping/Pong (Opcode 0x9/0xA)
Native pings use Opcode 0x9 for the request and 0xA for the response. These are handled by the server and browser engine automatically. They are lightweight and don't require JSON parsing. However, they have a major limitation. Most browser JavaScript APIs don't expose these frames to the developer. You can't easily log them or trigger events based on them. Some proxies even strip these frames entirely, making them unreliable for end-to-end testing.
const WebSocket = require('ws');
const wss = new WebSocket.Server({ port: 8080 });
wss.on('connection', (ws) => {
ws.isAlive = true;
ws.on('pong', () => { ws.isAlive = true; });
});
const interval = setInterval(() => {
wss.clients.forEach((ws) => {
if (ws.isAlive === false) return ws.terminate();
ws.isAlive = false;
ws.ping();
});
}, 30000);
Application-Layer Heartbeats (Custom JSON)
Application-layer heartbeats use standard data frames. You send a small JSON payload like {"type": "ping"} and wait for a response. This pattern provides true end-to-end validation. It proves the network is open. It also proves the application logic is actually processing messages. If your event loop is blocked, the heartbeat will fail. This is a more honest measure of system health. Is Your WebSocket Actually Alive? Monitoring Real-Time Connections Beyond the Handshake is best answered when you verify the full application stack.
The "Pong-Back" strategy is the gold standard here. The client must echo a unique timestamp or ID sent by the server. This prevents stale caches or proxies from spoofing a healthy response. While this adds a few bytes to each message, the peace of mind is worth the overhead. Integrating these checks into your uptime monitoring workflow ensures your real-time infrastructure remains transparent and reliable.
Infrastructure Gotchas: Configuring Proxies and Load Balancers for Persistence
Your application code might be perfect, but your infrastructure often acts as a silent executioner for long-lived sockets. Most proxies and load balancers are tuned for standard HTTP request-response cycles. They expect a transaction to finish in seconds. When a WebSocket connection stays open for minutes or hours without constant traffic, these intermediaries often kill the connection to reclaim resources. Is Your WebSocket Actually Alive? Monitoring Real-Time Connections Beyond the Handshake requires auditing your network stack for these aggressive idle timeouts.
Nginx and AWS Application Load Balancers (ALBs) typically default to a 60-second idle timeout. If your application doesn't send a heartbeat within that window, the proxy terminates the TCP session. The client sees this as a sudden disconnect, often without a specific error code. Tuning these values is the first step toward a stable real-time environment.
Nginx and HAProxy Configuration Best Practices
To support persistent streams, you must explicitly increase the read and send timeouts. In Nginx, `proxy_read_timeout` determines how long the proxy waits for the proxied server to send data. This is different from `client_body_timeout`, which applies only to the initial request body. For WebSockets, both the read and send timeouts should be set to a value that exceeds your application's heartbeat interval.
location /socket.io/ {
proxy_pass http://websocket_backend;
proxy_http_version 1.1;
Essential headers for the protocol upgrade
proxy_set_header Upgrade $http_upgrade;
proxy_set_header Connection "upgrade";
Increase timeouts for long-lived persistence
proxy_read_timeout 3600s;
proxy_send_timeout 3600s;
}
Setting these to 3600 seconds (one hour) provides a safe buffer. It ensures that the proxy won't kill the connection during brief periods of silence. Always verify that your "Connection" and "Upgrade" headers are correctly passed; without them, the handshake will fail before it even starts.
Load Balancing and Sticky Sessions
WebSockets are stateful by nature. In a clustered environment, a client must stay connected to the same backend server that holds its session state. Without "Session Affinity" (Sticky Sessions), a reconnection attempt might land on a different server that has no record of the client's previous state. This is especially critical during "Reconnection Storms." If a load balancer node fails, thousands of clients will try to reconnect simultaneously. Without proper affinity and rate limiting, this "thundering herd" can crash your remaining healthy nodes.
- Monitor Connection Age: Track how long connections stay on a single node to identify uneven load distribution.
- Drain Gracefully: When deploying new code, use a "connection draining" strategy to slowly migrate sockets rather than killing them all at once.
- Data Sovereignty: If you are monitoring users in Europe, ensure your logging of IP data for connection tracking complies with regional standards. Choosing a provider with EU-based hosting simplifies your compliance path by keeping data within the same jurisdiction as your users.
If you need to verify that your infrastructure isn't silently dropping packets, you can use StatusPulse to monitor your WebSocket entry points from multiple global regions. This helps you identify if a specific load balancer or regional proxy is causing localized disconnects for your users.
Scaling Real-Time Observability with StatusPulse
Implementing heartbeats and tuning Nginx timeouts secures the connection. However, your users don't see your Nginx config. They see a non-responsive app. True observability requires a bridge between your backend socket health and your user's expectations. Is Your WebSocket Actually Alive? Monitoring Real-Time Connections Beyond the Handshake is a question your support team will face during every outage. StatusPulse provides the external "truth layer" to answer it accurately.
Internal monitoring often misses regional routing issues or DNS failures that prevent the initial handshake. StatusPulse complements your internal logic by monitoring your WebSocket entry points from distributed global locations. You can choose between EU or US hosting for your monitoring infrastructure to maintain data sovereignty. This ensures your availability data stays within your preferred legal jurisdiction while providing a clear view of how the internet sees your service.
Proactive vs. Reactive Incident Communication
Waiting for a surge in support tickets is a reactive strategy that erodes trust. You can link your internal monitoring tools, such as Prometheus or Grafana, directly to your public status page via our API. When your internal heartbeat checks detect a spike in zombie connections, StatusPulse can automatically draft an incident report. This allows you to communicate disruptions before they become widespread complaints.
Managing real-time health involves more than just pings. It requires understanding the full availability of the supporting infrastructure. For a deeper dive into maintaining high-availability systems, refer to our API Monitoring guide. This resource explains how to align your incident management with the technical realities of modern distributed systems.
Transparent Pricing and Technical Integrity
We built StatusPulse for specialists who value precision over marketing fluff. Our pricing model is flat and transparent. We don't charge per-subscriber fees. This makes it sustainable for high-traffic real-time applications where a single outage could trigger thousands of notifications. We believe that communicating with your users during a crisis shouldn't come with a financial penalty.
It's important to recognize the trade-offs in any monitoring stack. StatusPulse focuses on external observability and incident communication. We don't perform deep-packet inspection or internal application profiling. If you need to debug a memory leak in your Go backend, you'll still need your internal APM. We provide the external verification that your WebSocket is reachable and functional for the end user. You can start with a free trial to test your entry points and verify that your infrastructure persistence is actually working as intended.
Securing Your Real-Time Data Flow
Relying on the 101 Switching Protocols status code is a risk that leads to silent failures and stale user interfaces. You've seen how zombie connections and aggressive proxy timeouts can sever a socket while leaving the client in the dark. Is Your WebSocket Actually Alive? Monitoring Real-Time Connections Beyond the Handshake requires a multi-layered approach. You must implement application-level heartbeats and audit your Nginx or ALB configurations to ensure persistence.
Effective observability isn't just about internal metrics; it's about clear communication during disruptions. You can build a more transparent real-time experience with StatusPulse. Our platform offers flat, transparent pricing for growing teams and the choice of EU or US hosting for data sovereignty. With AI-driven incident drafting, you can explain complex socket drops to your users without the usual manual overhead. It's time to stop guessing and start verifying your stream health. Your users will appreciate the honesty.
Frequently Asked Questions
What is the difference between a WebSocket heartbeat and a TCP keepalive?
WebSocket heartbeats operate at the application layer while TCP keepalives function at the transport layer. A TCP keepalive can detect a broken network link, but it won't tell you if your Node.js or Go process is hung. Application-layer heartbeats are the only way to verify that your specific application logic is still processing frames correctly.
Why does my WebSocket connection close exactly every 60 seconds?
This is usually caused by default idle timeouts in Nginx or AWS Application Load Balancers. Both often default to a 60-second window. If no data or heartbeats pass through the pipe during this time, the proxy kills the connection. You can fix this by increasing your proxy_read_timeout or sending heartbeats every 30 seconds.
How many concurrent WebSocket connections can a single server realistically handle?
A standard Linux server can handle 50,000 to 100,000 connections with basic tuning. High-performance libraries like uWebSockets have demonstrated scales of over 1 million connections on a single instance. Your actual limit will depend on your memory per connection and the OS file descriptor limits you've configured.
Do WebSockets work with standard HTTP load balancers like AWS ALB?
Yes, modern load balancers like AWS ALB support the protocol upgrade. You must ensure your configuration preserves the "Upgrade" and "Connection" headers. It's also critical to enable sticky sessions; otherwise, a client might try to reconnect to a different backend server that doesn't have its session state.
How do I monitor WebSocket latency in production without slowing down the app?
The best way is to use asynchronous logging for frame timestamps. You can measure the round-trip time of your application-level heartbeats without blocking the main event loop. Is Your WebSocket Actually Alive? Monitoring Real-Time Connections Beyond the Handshake involves tracking these p99 latencies to identify congestion before it causes a full disconnect.
What happens to a WebSocket connection when a mobile user switches from Wi-Fi to 4G?
The connection will drop immediately because the client's IP address changes. This invalidates the existing TCP socket. The server often won't realize the connection is gone until a heartbeat fails. Your frontend code must listen for the "offline" event and proactively attempt a new handshake to restore the stream.
Can I use StatusPulse to monitor my WebSocket server's uptime?
StatusPulse monitors the reachability and uptime of your WebSocket entry points. While it doesn't perform internal deep-packet inspection, it provides the external verification that your handshake is successful and your API is responsive. It's the primary tool for communicating real-time health to your users via a public status page.
Is it better to use a managed WebSocket service or build my own monitoring?
Managed services reduce infrastructure overhead but often introduce complex per-subscriber pricing. Building your own monitoring provides more control over data sovereignty and costs. Is Your WebSocket Actually Alive? Monitoring Real-Time Connections Beyond the Handshake is more cost-effective for high-traffic apps when using flat-pricing tools that don't penalize your growth.


