

An HTTP 200 OK status code is often a false signal of service health. In a distributed system, a green light on the transport layer doesn't mean your business logic isn't failing internally. This article offers gRPC Health Checks Explained: Probing Check and Watch over HTTP/2 and HTTP/3 to give you a more precise view of your infrastructure. We've written this to help you move beyond superficial pings that ignore the actual state of your services.
Managing microservices is difficult when standard probes miss internal state changes. You've likely experienced the stress of a service that appears online but fails to process data. This guide promises to walk you through the technical mechanics of the official protocol. You'll learn how to implement unary Check methods for load balancers and streaming Watch probes for real-time updates. We also examine how the shift from HTTP/2 to HTTP/3 impacts performance by eliminating head-of-line blocking. By the end, you'll have a strategy for faster failure detection and better service reliability.
Key Takeaways
- Learn the core mechanics of the standard protocol in this guide, gRPC Health Checks Explained: Probing Check and Watch over HTTP/2 and HTTP/3, to move beyond basic port-level monitoring.
- Contrast unary polling with server-side streaming to determine when to use simple pings versus real-time status watches.
- Analyze how HTTP/3 and QUIC transport layers prevent health check stalls by eliminating head-of-line blocking during packet loss.
- Find configuration best practices for registering health services and mapping internal metrics to serving statuses.
- Bridge the gap between technical service signals and public communication by integrating gRPC health data with status pages.
Understanding the gRPC Health Checking Protocol
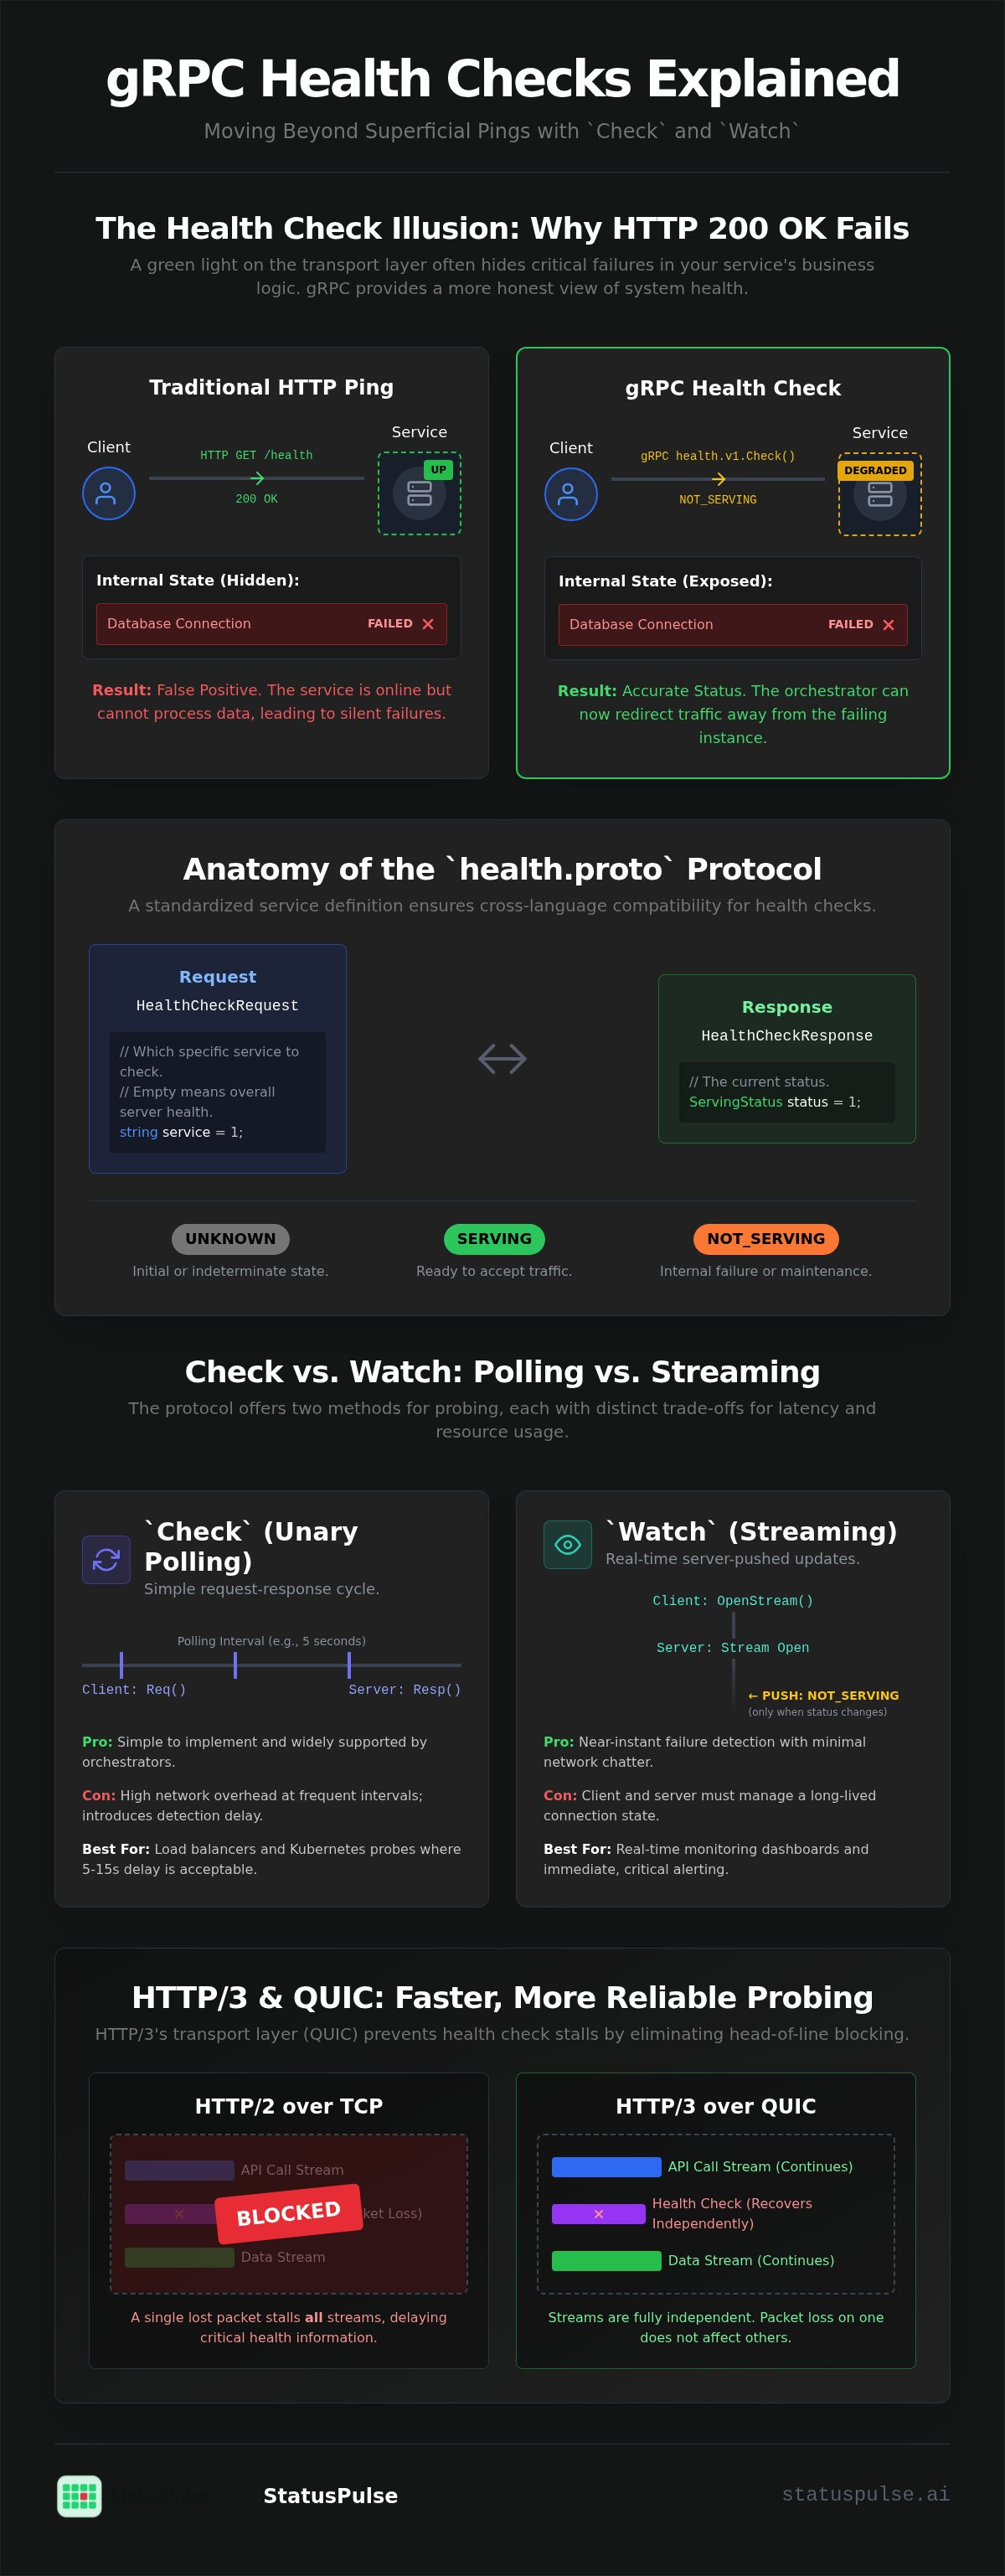
Standard HTTP pings are a liability in modern architectures. A TCP handshake confirms a port is open, but it tells you nothing about the service logic behind it. The gRPC Health Checking Protocol solves this by providing a dedicated service for reporting internal status. It's a standard part of the gRPC framework, defined under the grpc.health.v1 package. This section offers gRPC Health Checks Explained: Probing Check and Watch over HTTP/2 and HTTP/3 to help you secure your service visibility. By using a uniform definition, the protocol ensures that your monitoring stack remains consistent regardless of the underlying language.
Partial failure is the primary enemy of distributed systems. It occurs when a server is technically "up" but unable to perform its primary function. Perhaps a critical dependency is unreachable or local disk space is exhausted. Traditional infrastructure probes often miss these states because they only check the surface. The gRPC protocol allows the application to report its own readiness based on these internal metrics. This creates a more honest representation of system health and helps orchestrators like Kubernetes make better traffic decisions.
Why HTTP 200 OK is Not Enough for gRPC
Transport layer availability is a shallow metric. A server might accept a connection while its internal buffers are full or its database client has timed out. Because gRPC uses binary framing over HTTP/2 or HTTP/3, specialized tools are required to probe the actual handler. A port might be reachable, but if the Protobuf decoder is stuck or the thread pool is exhausted, your application is effectively down. Traditional probes miss these nuances. gRPC probes expose them by interacting directly with the service definition rather than just the network stack.
The Anatomy of health.proto
The protocol centers on a simple health.proto file. This ensures that a Go-based load balancer can check the health of a Java-based microservice without compatibility issues. The logic revolves around two messages: HealthCheckRequest and HealthCheckResponse. These messages carry the state information across the wire. Three primary status enums define the response. SERVING indicates the system is ready for traffic. NOT_SERVING signals a controlled pause or internal failure. UNKNOWN acts as a fallback for initialization states. The service string parameter allows you to query specific sub-services on a single server, preventing a single degraded component from taking down the entire node.
Implementing these probes is the first step toward a resilient architecture. gRPC Health Checks Explained: Probing Check and Watch over HTTP/2 and HTTP/3 provides the framework needed for this transition. By querying the internal state, you ensure your monitoring reflects reality.
Check vs. Watch: Comparing Unary Polling and Streaming
The official gRPC health checking protocol establishes two paths for monitoring: unary polling and server-side streaming. Understanding the difference is vital for maintaining high availability in distributed systems. This deep dive into gRPC Health Checks Explained: Probing Check and Watch over HTTP/2 and HTTP/3 helps you decide which method fits your specific resource constraints. Choosing the wrong one can lead to either delayed failure detection or unnecessary CPU spikes.
The Check method follows a standard request-response cycle. A client sends a HealthCheckRequest and the server immediately returns a HealthCheckResponse. This is the default approach for most load balancers and container orchestrators. It's straightforward to implement and debug. It works well for systems where a slight delay in failure detection is acceptable.
The Unary Check Method: Simplicity and Overhead
Polling has a hidden cost. If you set a high frequency, such as every 500ms, the overhead of repeated RPC calls can saturate your network. Establishing new RPCs involves header compression and frame management that adds up over time. Most teams find a balance by setting polling intervals between 5 and 15 seconds. If your system requires faster detection, polling might not be the right tool for the job. It's often better to reserve Check for external probes that don't need millisecond precision.
The Streaming Watch Method: Real-Time Observability
The Watch method shifts the responsibility from the client to the server. Instead of a single response, the server keeps a stream open. It pushes a new HealthCheckResponse whenever the service status changes. This provides near-instant visibility into failures. You get the benefit of lower network traffic because the server only speaks when there's something new to report.
Real-time updates allow for immediate failover. When a service status flips to NOT_SERVING, the client knows within milliseconds. This is a significant improvement over waiting for the next polling cycle to trigger. But this efficiency comes with architectural complexity. The server must track the state of every active watcher. If a connection drops, the client needs a robust reconnection strategy to avoid missing critical status flips. Monitoring these complex streaming signals is easier with a dedicated API monitoring tool that understands gRPC semantics.
Choosing between these methods requires a trade-off analysis. Use Check for simple infrastructure probes and external load balancers. Use Watch for internal service-to-service communication where fast failover is critical. Always consider server memory limits when scaling the number of concurrent Watch streams.
The Impact of HTTP/2 and HTTP/3 on gRPC Probing
Transport layers are the foundation of gRPC. This section of gRPC Health Checks Explained: Probing Check and Watch over HTTP/2 and HTTP/3 looks at how the move to QUIC changes the monitoring game. Reliability isn't just about the application logic; it's about the wire it travels on. Monitoring tools must now support both transports to ensure accurate availability data across modern infrastructure.
HTTP/2 introduced multiplexing, allowing multiple health checks to share a single TCP connection. While this reduces resource usage, it introduces a shared risk. If the network experiences congestion, the underlying transport protocol can impact how your probes behave. Understanding these mechanics is essential for anyone maintaining high-density microservices.
Multiplexing and Head-of-Line Blocking in HTTP/2
HTTP/2 uses a single TCP connection to multiplex many gRPC streams. This is efficient for resources but creates a bottleneck. If a single packet is lost, the entire TCP connection halts until that packet is retransmitted. This is known as head-of-line (HOL) blocking. It affects every stream on that connection, including your health probes.
This blocking can trigger false negatives. Your monitoring agent might report a timeout even if the service logic is healthy. Inaccurate signals undermine your API monitoring: The Developer’s Guide to High Availability in 2026 strategy. When health checks stall due to network jitter rather than server failure, orchestrators might restart healthy containers, leading to unnecessary churn.
QUIC and Resilience in HTTP/3
HTTP/3 replaces TCP with QUIC. Because QUIC is built on UDP, it handles packet loss on a per-stream basis. A dropped packet in one stream doesn't stall your health check probe in another. This isolation makes probes much more reliable on congested or unreliable networks. It ensures that the status of your service is reported accurately even when the network is struggling.
Connection establishment is also faster. HTTP/3 supports a 0-RTT handshake. This is a major win for ephemeral monitoring agents that connect and disconnect frequently. This speed is especially useful when managing gRPC health probes in Kubernetes, where containers start and stop constantly. Faster handshakes mean less time spent in a "pending" state and more time spent gathering actual health data.
Moving to HTTP/3 requires infrastructure changes. You must ensure your firewalls allow UDP traffic on the gRPC port. While the resilience gains are clear, the complexity of managing UDP-based traffic is a trade-off every SRE team must evaluate. Modern monitoring requires a stack that can handle both the legacy stability of HTTP/2 and the high-speed resilience of HTTP/3.
Implementing gRPC Health Checks: Code and Configuration
A service without a health endpoint is a black box. If your orchestrator can't see inside, it can't protect your users from failures. This section of gRPC Health Checks Explained: Probing Check and Watch over HTTP/2 and HTTP/3 focuses on moving from theory to production-ready code. You must register the health service during the initial server bootstrap. This ensures the probe is active before the service begins accepting traffic.
Implementers face a choice between manual toggles and automated metrics. Manual updates are useful for graceful shutdowns. Automated metrics are better for detecting silent failures like database connection exhaustion. Both approaches require careful integration with your service's lifecycle to avoid flapping.
Server-Side Implementation in Go
The Go gRPC library provides a built-in health server. You don't need to write the logic from scratch. Simply create the health server and register it with your main gRPC instance. Use the SetServingStatus method to update the status based on internal readiness. This allows you to toggle availability as your service initializes or shuts down.
import (
"google.golang.org/grpc"
"google.golang.org/grpc/health"
"google.golang.org/grpc/health/grpc_health_v1"
)

func main() {
s := grpc.NewServer()
healthServer := health.NewServer()
grpc_health_v1.RegisterHealthServer(s, healthServer)

// Update status once ready
healthServer.SetServingStatus("my-service", grpc_health_v1.HealthCheckResponse_SERVING)
}
Handling the UNKNOWN state is critical during service initialization. During this phase, the service shouldn't accept traffic but also shouldn't be marked as failed. Set the status to UNKNOWN until all database connections and caches are ready. Once the bootstrap is complete, flip the status to SERVING to signal readiness to the load balancer.
Configuring Load Balancers for gRPC Probes
Load balancers like Envoy require specific filters to understand gRPC status codes. A standard TCP check isn't enough. You must configure the grpc_health_check filter within your cluster settings. This allows Envoy to parse the Protobuf response and determine if a node should remain in the rotation.
health_checks:
  - timeout: 1s
interval: 10s
grpc_health_check:
service_name: "my-service"
Mapping these status codes to retry logic prevents cascading failures. If a node returns NOT_SERVING, the load balancer should immediately stop sending new requests. For external verification, integrate these internal signals with uptime monitoring to ensure your public perception matches your internal reality. This creates a complete visibility loop. Secure your endpoints by ensuring the health check doesn't include sensitive service metadata in its response. You can achieve this by keeping the service string generic. For a unified view of these technical signals across your entire stack, use StatusPulse for API monitoring to bridge the gap between backend probes and public communication.
Scaling gRPC Observability with StatusPulse
Technical probes provide the raw data, but data alone doesn't solve incidents. This guide to gRPC Health Checks Explained: Probing Check and Watch over HTTP/2 and HTTP/3 has focused on the internal mechanics of service health. Now, you must decide how to communicate those signals when a failure occurs. Scaling observability requires a bridge between your backend Watch streams and your customer-facing communication channels. StatusPulse acts as this bridge, turning technical gRPC signals into actionable intelligence.
Most monitoring tools treat gRPC as an afterthought. They force you into complex configurations or opaque pricing models that scale with your subscriber count. We take a different approach. StatusPulse provides a unified view of your system health with flat, transparent pricing. It's built for specialists who value precision over corporate bloat. By integrating directly with your gRPC stack, you can automate the entire incident lifecycle without the overhead of traditional enterprise software.
Bridging gRPC Probes and Public Status Pages
Manual updates during an outage are a recipe for human error. When your gRPC service status flips to NOT_SERVING, StatusPulse can automatically update your public status page. This automation reduces developer toil and ensures your users aren't left in the dark. It transforms a technical failure into an honest, transparent update.
Transparency reduces support ticket volume. Users who see an active incident report are less likely to flood your help desk with duplicate queries. StatusPulse also leverages AI incident management to assist your team during the recovery phase. The platform can analyze gRPC failure patterns to help you draft technical post-mortems. This moves your team from reactive firefighting to proactive system improvement.
Maintaining Data Sovereignty in Monitoring
Data sovereignty is a core virtue, not a marketing checkbox. For gRPC-based services in financial or healthcare sectors, where your monitoring data lives is a regulatory requirement. StatusPulse offers a choice between EU or US hosting. This ensures you maintain GDPR compliance while monitoring global gRPC endpoints. We don't default to a single region; we give you the agency to choose what fits your compliance needs.
Our commitment to ethical data handling means we don't hide behind complex contracts. You get straightforward monitoring that respects your privacy and your budget. No per-subscriber fees. No hidden costs. Just a reliable tool for reliable services. Start monitoring your gRPC services with StatusPulse today.
Securing Your gRPC Infrastructure
Reliability in a distributed system depends on the depth of your signals. Moving from simple port pings to the official health checking protocol ensures your orchestrators react to actual service states. This guide, gRPC Health Checks Explained: Probing Check and Watch over HTTP/2 and HTTP/3, has outlined how unary polling and server-side streaming provide the visibility needed for high availability. As you transition to HTTP/3 and QUIC, your probes will gain the resilience required for modern, congested networks.
Effective monitoring shouldn't stop at your internal network. You need a way to bridge technical signals with honest communication. StatusPulse offers a straightforward path to build a more transparent gRPC infrastructure with StatusPulse. With options for EU-based hosting and AI-assisted incident summaries, you can maintain data sovereignty while reducing developer toil. Our flat, transparent pricing ensures you can scale without the stress of complex cost functions. Take the next step in refining your observability strategy to build systems that your users and stakeholders can trust.
Frequently Asked Questions
What is the default port for gRPC health checks?
There is no officially reserved default port for gRPC health checks. They typically listen on the same port as your primary service, such as 50051 or 8080. Many SRE teams choose to configure a dedicated port for health probes. This isolation prevents monitoring traffic from competing with business logic and allows for stricter firewall rules on management traffic.
How does the gRPC Watch method handle client disconnections?
The server stops pushing updates immediately when a client disconnects from a Watch stream. It doesn't persist state for disconnected clients. The responsibility for recovery lies entirely with the client. You should implement a robust reconnection strategy with exponential backoff to ensure monitoring resumes as soon as the network stabilizes without causing a thundering herd problem on your server.
Can I use gRPC health checks with standard Kubernetes liveness probes?
Yes, Kubernetes has supported native gRPC probes since version 1.24. You don't need to include external binaries like grpc-health-probe in your container image anymore. You can define the probe directly in your pod specification using the grpc field. The kubelet then communicates with your service using the standard protocol to determine container liveness and readiness.
What is the performance impact of running gRPC health checks over HTTP/3?
Running gRPC Health Checks Explained: Probing Check and Watch over HTTP/2 and HTTP/3 reveals that HTTP/3 improves reliability at a slight CPU cost. QUIC handles packet loss per stream, so a dropped packet in a data stream won't stall your health probe. The 0-RTT handshake also makes connection establishment faster. This is ideal for ephemeral monitoring agents that connect frequently.
How do I secure my gRPC health check endpoint from unauthorized access?
Secure your health endpoints by implementing mutual TLS (mTLS) to verify the identity of the monitoring agent. You can also use gRPC interceptors to validate specific headers or tokens within the HealthCheckRequest. Restricting access to internal IP ranges or using a service mesh like Istio provides an additional layer of security by isolating these endpoints from the public internet.
Does gRPC health checking support custom status codes beyond the standard enum?
The official protocol is limited to the status codes defined in the health.proto file. These include SERVING, NOT_SERVING, UNKNOWN, and SERVICE_UNKNOWN. You cannot add custom enum values without breaking compatibility with standard load balancers. Instead, use the service string parameter to query the health of specific sub-components, which allows for more granular reporting within the standard framework.
Is it better to use a dedicated sidecar for health checking or integrate it into the binary?
Integrating the health service directly into your application binary is the more accurate approach. It allows the probe to check internal states, such as database pool health or cache readiness, that a sidecar might miss. Sidecars are a valid fallback for legacy applications that you cannot modify. However, a sidecar only proves the network path is open, not that the application is functional.
How does StatusPulse handle gRPC monitoring for private networks?
StatusPulse monitors gRPC endpoints that are accessible from our global probing nodes. For services located on private networks, you can expose a secure, authenticated health endpoint through a reverse proxy or API gateway. This configuration allows our platform to ingest your gRPC health signals. You can then automate public status page updates while maintaining the security of your internal infrastructure.


