

A green light on a port check doesn't mean your database is healthy. It just means the door is open while the building inside is on fire. You've likely dealt with a thundering herd because a silent Redis failure went unnoticed by basic monitoring tools. It's a common frustration for SREs who find themselves manually drafting incident reports instead of fixing the root cause.
Monitoring Redis and MySQL health directly requires more than a simple ping. You need functional probes that verify the actual state of your data layer. This article outlines a reliable strategy to detect silent failures and maintain high availability in your stack without the bloat of traditional enterprise monitoring tools.
We'll show you how to implement checks for Redis 8.8 and MySQL 8.4 LTS metrics, including cache hit ratios and InnoDB buffer pool efficiency. You'll learn to automate status updates to reduce your Mean Time to Detection (MTTD) and keep your team focused on engineering rather than firefighting. It's a straightforward approach for teams that value precision and technical honesty.
Key Takeaways
- Move beyond simple port connectivity to prevent silent failures like "thundering herds" in your cache layer.
- Implement functional probes such as SELECT 1 for MySQL and PING for Redis to verify actual database availability.
- Learn to monitor Redis and MySQL Health Directly by exposing custom health-check endpoints that track memory usage and connection saturation.
- Create dedicated, low-privilege monitoring users to ensure security while maintaining deep visibility into your data stack.
- Use external API monitoring to automate incident reporting and keep stakeholders informed during critical database outages.
The Architecture of Direct Database Health Monitoring
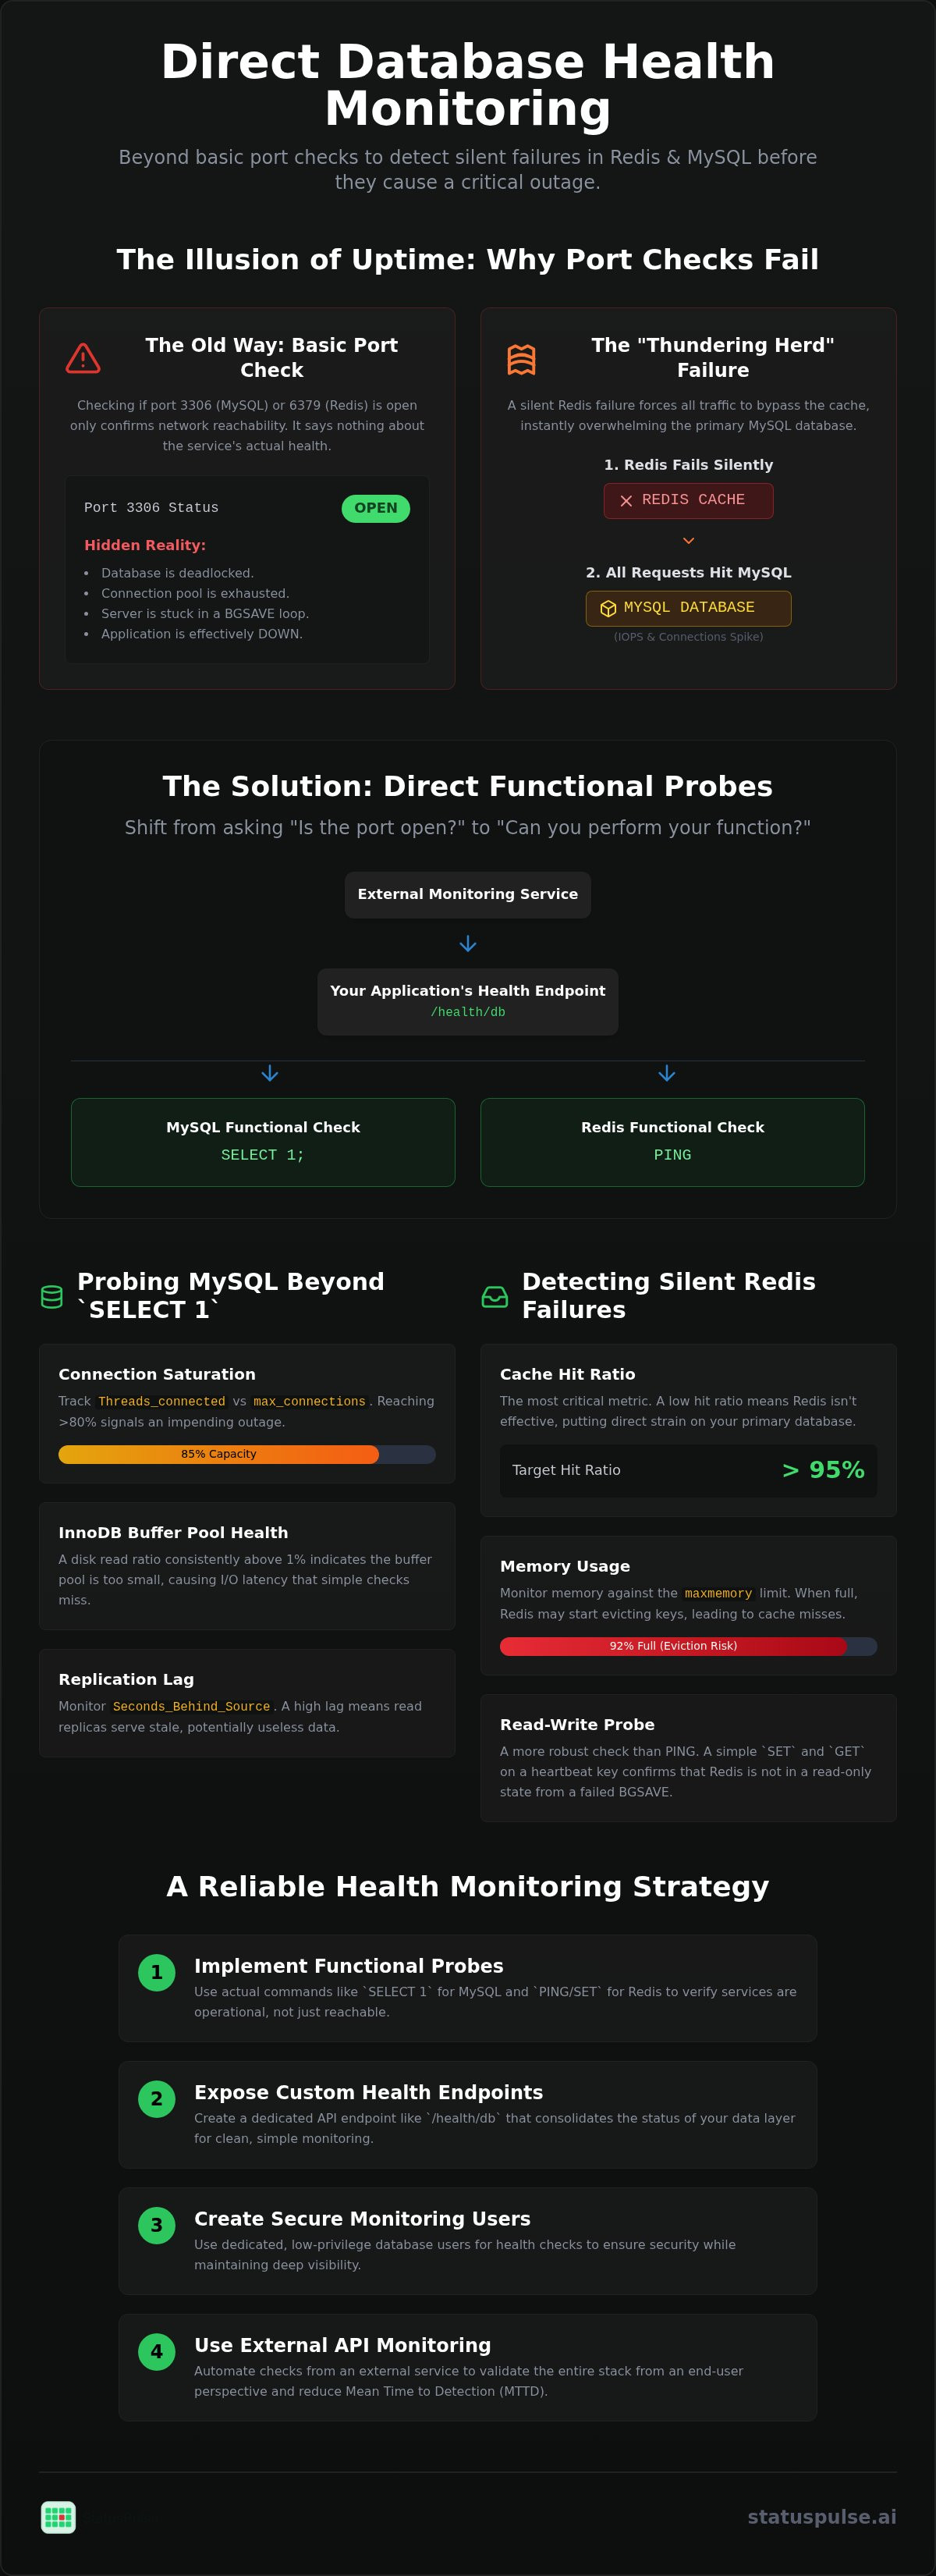
Binary network checks are a relic of simpler times. Monitoring port 3306 for MySQL or 6379 for Redis only tells you if the traffic can reach the server. It says nothing about whether the database engine is actually processing queries. A deadlocked MySQL instance or a Redis server stuck in a background save loop will still respond to a TCP port check. This creates a dangerous illusion of uptime while your application is effectively down.
When you fail to monitor Redis and MySQL Health Directly, you risk the "thundering herd" problem. This occurs when a silent Redis failure causes the application to bypass the cache entirely. Every single request then floods the primary MySQL database simultaneously. This sudden spike in IOPS and connection count can crash a perfectly healthy database in seconds. You need functional probes that verify the internal state of these services before the traffic hits them.
Direct health monitoring moves the validation from the network layer to the application layer. Instead of asking "Is the port open?", you ask "Can I execute a query?". This requires a strategy that combines internal metrics with external validation to ensure your monitoring doesn't fall victim to the same resource exhaustion it's supposed to detect.
The Dependency Loop: Redis as a MySQL Guard
In a modern stack, Redis isn't just a performance booster; it's a structural barrier. It shields MySQL from high-frequency read patterns that the relational database isn't designed to handle. If Redis health degrades, the pressure on your primary database increases linearly. Your monitoring must see both layers simultaneously to identify when a "healthy" MySQL instance is actually under duress because its cache guard has failed.
Identifying these critical failure points requires looking at the data retrieval path as a single unit. If the cache is cold or failing, the database load will inevitably spike. Monitoring the synergy between these two components allows you to predict outages before they happen, rather than just reacting to them after your connection pool is exhausted.
Direct vs. Synthetic Monitoring for Databases
Traditional Application Performance Management (APM) tools often rely on internal agents. These agents consume CPU and memory, which can skew performance data or even contribute to a crash during a high-load event. Synthetic monitoring takes a different approach by using external probes to validate health from the perspective of your services.
Exposing a private health-check endpoint like /health/db allows an external validator to verify the entire stack. Tools like StatusPulse can hit these endpoints from multiple geographic regions to ensure that connectivity is stable and functional. Functional health probes are the standard for 2026 reliability, ensuring that a service is capable of performing its primary task rather than just existing on the network.
Probing MySQL: Beyond Simple Connectivity
SELECT 1 is the "hello world" of database health. It validates that the MySQL daemon is responsive and the parser is functional. However, it fails to account for resource exhaustion. A database under heavy lock contention or one that has reached its connection limit will still return a result for SELECT 1 if the connection is already established. To monitor Redis and MySQL Health Directly, you must look at the variables that indicate impending failure.
Monitoring connection pool saturation is critical. In MySQL 8.4 LTS, you should track the Threads_connected metric against your max_connections setting. If you consistently reach 80% of your allowed connections, your application is one traffic spike away from a total outage. Following MySQL performance monitoring best practices also means keeping an eye on the InnoDB buffer pool. A disk read ratio consistently above 1% suggests your buffer pool is too small, leading to latency that simple pings will never catch.
Advanced MySQL Health Queries
A more robust probe goes beyond liveness. Use SHOW GLOBAL STATUS LIKE 'Aborted_connects'; to find network issues or authentication failures that haven't triggered a full outage yet. For a functional check, implement a "Read-Write" probe. This involves updating a single row in a heartbeat table. It confirms that the underlying storage isn't in read-only mode due to disk errors or cloud provider throttling.
In distributed environments, replication lag is your primary health indicator. A healthy replica with 100 seconds of lag is practically useless for real-time reads. Monitor Seconds_Behind_Source (formerly Seconds_Behind_Master) to ensure your read-heavy traffic isn't serving stale data. This prevents your application from making decisions based on data that is several minutes old.
Infrastructure Guardrails
Health checks should never become the cause of an outage. Set strict timeout limits on your probe queries. If a health check takes longer than 500ms, it should fail and trigger an alert. This prevents the monitoring tool from holding open connections during a database slowdown, which would only worsen the "Too many connections" error you are trying to avoid.
Integrating these deep probes into your broader uptime monitoring strategy ensures that your status page reflects the actual user experience. When these metrics cross critical thresholds, StatusPulse can alert your team before the database stops accepting new traffic entirely. This proactive approach reduces detection time and prevents the stress of manual incident reporting during a full-blown crash.
Redis Health Metrics: Detecting Silent Cache Failures
The PING command is the absolute floor for monitoring. It confirms the Redis process is running and the event loop is responsive. However, a process can be alive while the cache itself is functionally useless. To monitor Redis and MySQL Health Directly, you must track how the engine manages its memory footprint.
Compare used_memory against your maxmemory setting. When these values converge, Redis triggers its eviction policy. If the evicted_keys metric spikes, you are likely in an eviction storm. Performance degrades as the engine spends CPU cycles deleting old data to make room for new writes, often leading to increased latency for the application.
Your cache hit ratio is the most vital indicator of functional health. A ratio below 80% suggests your cache size is insufficient or your expiration logic is flawed. When this number drops, the "thundering herd" problem mentioned earlier becomes a reality. More requests bypass the cache and hit your MySQL instance, risking a secondary failure at the storage layer.
Redis Persistence and Latency Probes
Persistence failures can lead to catastrophic data loss during a restart. Monitor the rdb_last_bgsave_status and aof_last_write_status metrics. If a background save fails due to disk space or permission issues, Redis 8.8 may stop accepting writes entirely to protect data integrity. It's a fail-safe that turns a minor storage issue into a total service outage.
Latency spikes in Redis are often caused by long-running commands blocking the single-threaded event loop. Use the SLOWLOG command to identify these bottlenecks. In clustered environments, verify the master_link_status. A replica that has lost synchronization with its master will serve stale data, creating inconsistencies that are difficult to debug at the application level.
Identifying Cache Poisoning
An "Up" status is a lie if the data inside your cache is stale or incorrect. Implement TTL (Time To Live) monitoring for critical keys to ensure your invalidation logic works as intended. If keys never expire, your memory usage will climb until evictions begin. If they expire too quickly, your database load will remain high.
Using API monitoring allows you to verify cache-dependent response times from the outside. If an endpoint that usually returns in 20ms suddenly takes 200ms, your cache is likely being bypassed. External validation through StatusPulse helps you catch these "soft" failures before they trigger an automated incident report. It's about seeing the impact on the user, not just the raw metrics on a dashboard.
Implementing a Direct Health Monitoring Strategy
Moving from passive observation to active probing requires a structured approach. You can't rely on generic agents to understand the nuances of your specific workload. To monitor Redis and MySQL Health Directly, you must build a strategy that treats your data layer as a set of functional requirements rather than just running processes.
- Step 1: Create dedicated monitoring users. Avoid using administrative accounts. In MySQL, create a user with limited
SELECTandUPDATEprivileges on a dedicated heartbeat table. In Redis, use ACLs to restrict the monitoring user toPING,SET, andGETcommands. - Step 2: Expose a private health-check endpoint. Create a route like
/health/dbwithin your application. This endpoint acts as a proxy, executing the actual database queries and returning a simple status code to your external monitor. - Step 3: Perform multi-step checks. A simple read isn't enough. Your probe should write a timestamp to a "heartbeat" row and then read it back. This confirms that the storage engine is writable and that replication is functioning.
- Step 4: Define clear thresholds. Set alerts based on connection counts and query latency. If MySQL connections exceed 80% of
max_connections, you need a warning. If Redis latency exceeds 100ms, you have a critical bottleneck.
The Health-Check Endpoint Pattern
Your health-check controller should be lightweight. It should not perform complex logic or heavy joins. The goal is a quick "yes" or "no" from the underlying services. If Redis is down but MySQL is up, return a 503 Service Unavailable status. This tells your load balancer or monitor that the instance is unhealthy, even if the web server itself is responsive.
# Example Python Health Check
def check_health():
try:
db.execute("UPDATE heartbeat SET last_seen = NOW() WHERE id = 1")
cache.set("health_check", "ok", ex=10)
return {"status": "healthy"}, 200
except Exception:
return {"status": "unhealthy"}, 503
Security is a priority when exposing these endpoints. Use IP whitelisting to ensure only your monitoring provider can access the health check. This prevents attackers from using the endpoint to perform a Denial of Service attack by spamming database-heavy probes.
Alerting and Escalation
Thresholds must be actionable. A warning should trigger a notification in a chat channel, while a critical alert should wake up an engineer. Integrating these probes with your incident communication workflow ensures that stakeholders are informed before they start noticing errors. One-minute check intervals are the industry standard for database monitoring because they provide enough granularity to catch spikes without overwhelming the server with probe traffic.
When a probe fails, you shouldn't waste time manually checking logs. Using StatusPulse API monitoring allows you to track these endpoints from multiple regions simultaneously. This external perspective confirms whether the issue is a local network blip or a genuine database outage. It's a transparent way to maintain high availability while keeping your team's focus on building features rather than chasing ghosts in the machine.
Automating Database Transparency with StatusPulse
Internal monitoring is a feedback loop that often fails when you need it most. If your database is under heavy load, the very tools you use to monitor it may become unresponsive. External validation is the only way to ensure your health probes are actually working. By using StatusPulse to monitor your Redis and MySQL Health Directly, you separate the observer from the observed.
StatusPulse hits your health-check endpoints from multiple geographic regions simultaneously. This prevents false positives caused by local network blips. If your /health/db endpoint returns a 503 from three different regions, the system knows it's a genuine outage. You can choose between EU or US hosting to ensure your monitoring infrastructure aligns with your data sovereignty requirements.
One of the most tedious parts of a database outage is explaining it to non-technical stakeholders. StatusPulse uses an AI assistant to translate complex MySQL error logs into readable status updates. Instead of a raw "Deadlock found when trying to get lock" error, your status page can automatically draft an update about "temporary database contention." It saves time during high-stress incidents and ensures your communication is as precise as your engineering.
Bridging the Gap Between DevOps and Customers
Automated transparency reduces the "thundering herd" of support tickets. When customers see a verified status page update, they stop refreshing the app and stop emailing your support team. It builds trust. Honest communication about database maintenance or unexpected failures is a better retention strategy than silence. It proves you have a handle on your infrastructure.
Integrating your functional probes with a public status page closes the loop between engineering and the customer. When your multi-step "Read + Write" check fails, the status page reflects the change immediately. This reduces your Mean Time to Detection (MTTD) and ensures that your incident communication is as fast as your technical response. It's about maintaining integrity through every stage of a failure.
Getting Started with StatusPulse
Setting up your first database uptime check takes less than five minutes. You simply point the monitor to your private health-check URL and define your failure thresholds. There are no complex agents to install and no per-subscriber fees to worry about. It's a straightforward tool for teams that value technical precision over corporate bloat.
You can customize your status page to match your brand's look, ensuring a professional appearance even during downtime. If you're looking for a transparent monitoring solution that respects your time and your data, StatusPulse provides the guardrails you need. It's built by specialists who understand that a green light should actually mean the system is healthy.
Building a Resilient Data Layer
Direct health monitoring is the difference between guessing and knowing. By moving past simple TCP pings to functional probes, you protect your application from the thundering herd and silent cache failures. You've learned how to implement low-privilege monitoring users and expose private endpoints that verify actual database operations. This strategy ensures your monitoring reflects the real-world state of your infrastructure.
Monitoring Redis and MySQL Health Directly is only the first step. The second is communicating that health to your team and your customers. StatusPulse provides the external validation needed to bridge this gap. You get 1-minute check intervals, AI-powered incident drafting for stakeholders, and EU-based data sovereignty without the burden of per-subscriber fees.
It's time to stop reacting to outages and start predicting them. Start Monitoring Your DB Stack with StatusPulse today. A reliable monitoring strategy doesn't have to be complex; it just needs to be honest. You can build a system that stands up to scrutiny and keeps your users informed.
Frequently Asked Questions
How do I check MySQL health from the command line?
You can use the mysqladmin ping command for a basic liveness check. It returns "mysqld is alive" if the server process is responsive. For deeper diagnostics, run SHOW GLOBAL STATUS LIKE 'Threads_connected'; to see active connections or SHOW ENGINE INNODB STATUS; to check for deadlocks. These commands provide a more accurate picture than a simple network port check.
What is the most important metric for Redis health monitoring?
The cache hit ratio is your most vital functional indicator. A ratio below 80% usually means your cache is too small or your data is expiring too quickly. You should also monitor used_memory against maxmemory. If these values meet, Redis begins evicting keys, which can lead to performance spikes and increased load on your primary database.
Can I monitor Redis and MySQL without an agent?
Yes, you can monitor Redis and MySQL Health Directly by exposing a private health-check endpoint in your application code. This endpoint executes a simple query and returns a status code to an external validator. This approach reduces overhead on your database servers and provides a functional perspective from the application's point of view.
What happens to my application if Redis health fails?
If your Redis health fails silently, your application will likely fall back to the primary MySQL database for every request. This creates a "thundering herd" where the database is suddenly overwhelmed by traffic it wasn't designed to handle. Application latency will spike, and the primary database may eventually crash. Direct monitoring helps you catch these failures before the secondary failure occurs.
How often should I probe my database for health?
One-minute check intervals are the industry standard for database probes. This frequency is granular enough to catch performance dips without putting unnecessary load on the server. Checking less often risks missing short outages or significant spikes in latency. Checking more often can sometimes create unnecessary noise in your monitoring data and logs.
Should I use a public status page for database outages?
A public status page is an ethical way to communicate with your users during an outage. It reduces support ticket volume by providing a single source of truth for technical disruptions. When you automate these updates based on real health probes, you build trust through transparency. It shows your team is proactive and values honest communication with the people who rely on your software.


