

Your uptime monitor shows a green 200 OK, but your users are staring at a loading spinner that never ends. It is a frustrating scenario that highlights Why HTTP Checks Aren't Enough: Monitoring Postgres. A simple ping to a health check endpoint often misses deep-seated issues like connection pool exhaustion or transaction ID wraparound. These silent failures create a false sense of security while your database performance actively degrades.
Postgres monitoring requires more than HTTP checks because status codes do not reflect internal database health, such as locking issues or disk I/O bottlenecks. To ensure true availability, you must monitor the data layer directly rather than relying on the application's response code. This article explains why standard status codes hide database bottlenecks and how to implement a strategy that catches Postgres failures before they impact your users. We will examine the metrics that actually matter for reliability, from cache hit ratios to query execution patterns, helping you reduce your mean time to detection.
Key Takeaways
- Identify the "zombie app" state where web servers return a 200 OK while the underlying database is actually unresponsive.
- Prioritize availability-killing metrics like connection exhaustion and transaction locks over generic performance statistics.
- Learn how to build deep health check endpoints to verify Why HTTP Checks Aren't Enough: Monitoring Postgres at the data layer.
- Implement multi-node confirmation to verify database incidents and reduce false positives before updating your status page.
- Streamline incident response by integrating synthetic API monitoring with automated status updates and AI-powered management.
The 'Liar' 200 OK: Why Basic HTTP Checks Fail Postgres
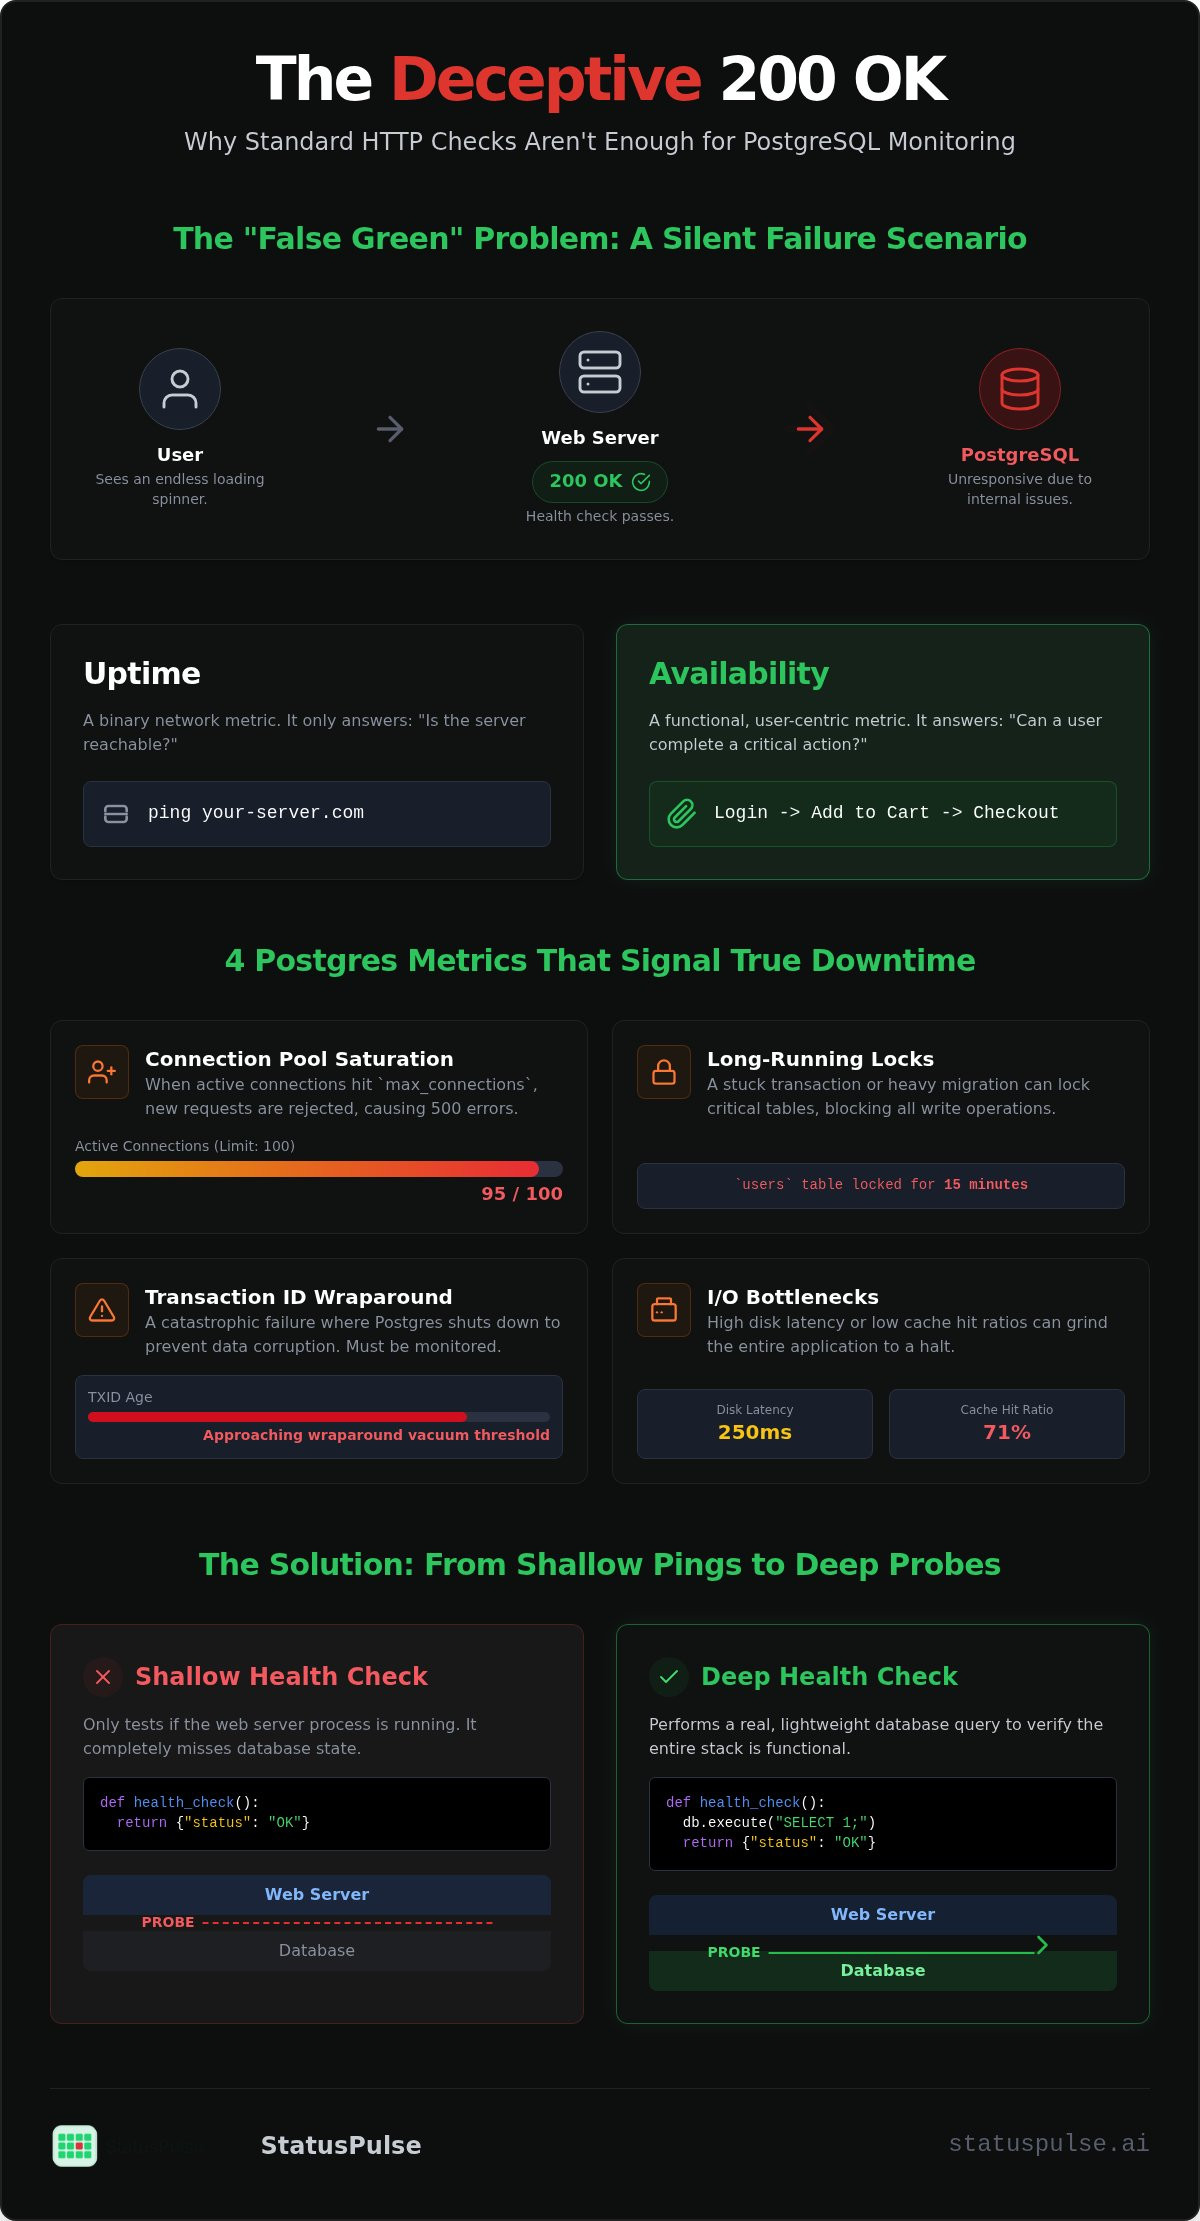
Standard uptime monitors often deceive you. They ping a URL, receive a 200 OK, and report that everything is fine. This is the "False Green" problem. Your status page stays green while your users see "Internal Server Error" or endless loading spinners in their browsers. This mismatch happens because a basic HTTP check only tests the network path to your load balancer or web server. It doesn't verify if the application can actually talk to your database. This is a primary reason Why HTTP Checks Aren't Enough: Monitoring Postgres effectively.
When the web server is reachable but the database is unresponsive, you enter a "Zombie App" state. The process is alive, but the functionality is dead. Network-edge monitoring is necessary to catch DNS issues or server crashes, but it is never sufficient for a production stack. It ignores the complex dependencies required for a successful transaction. Relying solely on pings creates a dangerous blind spot in your observability layer.
Anatomy of a Silent Database Failure
Database failures rarely start with a total server crash. They often begin with subtle degradation that shallow health checks ignore. Consider a scenario where your connection pool is exhausted. Your web server might still respond to a health endpoint with a hardcoded "OK" string because that specific route doesn't query the database. Meanwhile, every user trying to log in is met with a timeout. The monitor reports 100% uptime, but the service is useless.
Another common failure involves long-running locks. In Postgres, a heavy migration or a stuck transaction can lock a critical table. Your basic pings see a healthy web server. Your read-only health checks might even pass. However, any request requiring a write operation fails immediately. Shallow health checks mask this infrastructure rot. You remain blind to the actual user experience until the support tickets start piling up.
The Difference Between Uptime and Availability
Technical teams often confuse uptime with availability. Uptime is a binary network metric; the server is either reachable or it isn't. Availability is a functional metric. It measures whether a user can successfully complete a transaction. Within the discipline of Application Performance Management (APM), we recognize that a reachable server with a broken data layer is effectively down.
True monitoring website uptime involves probing the application logic. You need to know if the database can execute a query, not just if the port is open. Understanding Why HTTP Checks Aren't Enough: Monitoring Postgres means moving your monitoring strategy closer to the data. If your checks don't exercise the database, they aren't monitoring your service. They are only monitoring your network.
Beyond the Surface: 4 Postgres Metrics That Actually Signal Downtime
Performance optimization is a luxury you can't afford when your database is crashing. You must prioritize availability-killing metrics over general slow query statistics. While a slow query makes a user wait, connection exhaustion or transaction locks prevent them from using the service at all. The pg_stat_activity view provides the visibility needed for real-time incident response. It is the definitive source for understanding what your database is doing at any given second.
Relying on the network edge misses internal state changes that lead to outages. For instance, transaction ID wraparound is a critical risk in high-volume environments that can render an entire database unavailable. This is a primary reason Why HTTP Checks Aren't Enough: Monitoring Postgres requires a deep dive into the engine's internals. You can find a complete list of available views and statistics in the official PostgreSQL monitoring documentation to help build your own telemetry pipelines.
Connection Pool Saturation (Active vs. Idle)
Every Postgres instance has a max_connections limit. Once you hit this ceiling, the database rejects all new connection attempts. Your web server will likely throw a 500 error, even if the CPU is sitting at 5% utilization. Monitoring "waiting" connections is essential to predict a bottleneck before it happens. Use this query to get a snapshot of your current connection states:
SELECT state, count(*)
FROM pg_stat_activity
GROUP BY state;
If the count of active connections consistently approaches your limit, your application is at risk. You may need to implement a connection pooler like PgBouncer or increase your hardware resources. Tracking these trends helps you identify capacity issues before they trigger an alert.
Transaction Longevity and Locks
Long-running transactions are dangerous. They prevent vacuuming and can hold exclusive locks that block other operations. If a transaction stays open for more than five minutes, it often indicates a bug or a stuck process. Exclusive locks on heavily used tables are particularly destructive. They create a queue of blocked requests that eventually exhausts your connection pool.
Detecting deadlocks before they trigger a cascade of timeouts is vital for maintaining high availability. While basic pings ignore these internal queues, API monitoring can be configured to probe specific endpoints that exercise these database paths. This approach ensures you catch locking issues before they impact your broader user base.
Finally, monitor resource saturation through CPU and Disk I/O. These are leading indicators of an impending crash. When Disk I/O reaches 100% saturation, query latency spikes, often leading to application-level timeouts that look like a total outage to the end user.
Synthetic Probing: Testing the Database through the API
To bridge the gap between network pings and database health, you need a "Deep Health Check" endpoint. This is a dedicated route in your application that doesn't just return a static string. Instead, it executes a minimal set of database operations to verify the full request lifecycle. This approach directly addresses Why HTTP Checks Aren't Enough: Monitoring Postgres by ensuring the application can actually interact with the data layer.
Performing these checks comes with a significant risk known as the "Thundering Herd" effect. If you have dozens of monitoring nodes and load balancers hitting a deep health check every few seconds, you might accidentally DDoS your own database. A best practice is to cache the health check result in memory for 10 to 30 seconds. This allows you to serve a fresh status to external monitors without placing unnecessary overhead on your connection pool. You can explore a comprehensive list of PostgreSQL monitoring tools to see how different agents handle this telemetry collection.
Building a Production-Ready Health Check Endpoint
A robust health check should perform three distinct verification steps. First, execute a simple SELECT 1. This confirms basic connectivity and that the Postgres process is accepting queries. Second, query your schema migration table to ensure the application code is aligned with the database version. This prevents errors caused by partial deployments or failed migrations.
Finally, verify write permissions by updating a timestamp in a dedicated heartbeat table. Connectivity doesn't always guarantee writeability, especially in failover scenarios where a node might have switched to read-only mode. By testing a small write, you confirm the database is fully operational for your users. These checks provide a high-fidelity signal that basic network pings cannot replicate.
Configuring Your Uptime Monitor for Deep Checks
Once your endpoint is live, configure your monitor with a frequency of at least 1-minute intervals for critical paths. Set timeout thresholds that align with your application's Service Level Agreement (SLA). If a simple heartbeat takes longer than 2 seconds, your database is likely experiencing significant contention or resource saturation. This delay is a leading indicator of Why HTTP Checks Aren't Enough: Monitoring Postgres for high-availability environments.
For geo-distributed Postgres clusters, multi-region api monitoring is vital. It helps you identify latency issues or routing failures specific to a single geographic area. This level of detail is essential for maintaining global availability and ensuring that "200 OK" truly means the system is healthy for everyone, regardless of their location.
From Detection to Transparency: Managing Postgres Incidents
Detection is only the first half of the battle. Once your deep health checks flag a failure, you must verify the incident before alerting the entire team. Multi-node confirmation is essential here. If only one monitoring location sees a failure, it might be a regional network blip. If three or more nodes agree, you have a confirmed database issue. This verification step is a critical component of Why HTTP Checks Aren't Enough: Monitoring Postgres, as it prevents the alert fatigue caused by false positives.
Transition your status page to "Partial Outage" or "Major Outage" immediately after confirmation. Transparency is better than a "False Green" dashboard that contradicts user reality. Modern incident management tools can now use AI to summarize complex technical logs into human-readable updates. Instead of posting "Postgres transaction ID wraparound detected," you can inform users that "A background maintenance task is temporarily limiting database access." This keeps stakeholders informed without requiring a developer to stop debugging to write a manual update.
Reducing Support Load During DB Downtime
User trust disappears when your dashboard claims 100% uptime while their queries are timing out. This silence is expensive. Support teams spend hours answering tickets that could have been avoided with a proactive status update. This occurs because basic network pings don't see the "Zombie App" state mentioned earlier in this guide. Linking your monitoring alerts directly to your status page automates this communication flow.
An honest update acknowledging a specific database lock issue builds more trust than a generic message blaming "upstream providers" or "the cloud." When you are direct about the problem, users are generally more patient. Automating these updates ensures that your status page reflects the actual state of your data layer in real-time. If you want to automate this entire cycle, you can manage Postgres incidents with integrated status pages to keep your users informed without manual intervention.
Post-Mortems for Technical Credibility
Use your monitoring data to provide a detailed post-mortem after the fix is deployed. This is where you explain the root cause, such as index bloat or a sudden connection spike. You can share query performance graphs to illustrate the problem without exposing sensitive connection strings or schema details. Detailed technical explanations prove that you understand your stack and have implemented a permanent fix.
Transparency prevents customer churn during recurring database issues. When users see a principled, meticulous approach to incident resolution, they feel more secure in your platform's long-term reliability. A well-documented post-mortem transforms a technical failure into an opportunity to demonstrate professional authority and integrity. It shows your audience that you value precision over marketing optics.
StatusPulse: Full-Stack Observability Without the Bloat
StatusPulse combines Uptime Monitoring, API Monitoring, and Public Status Pages into a single, cohesive workflow. This all-in-one approach eliminates the need to stitch together multiple disparate tools just to understand your data layer health. It directly addresses Why HTTP Checks Aren't Enough: Monitoring Postgres by providing the synthetic probing capabilities required to see past a simple 200 OK status. You get a clear view of your infrastructure without the corporate bloat or complex pricing models of enterprise incumbents.
We prioritize data sovereignty and flexibility. You can choose between EU (Germany) or US hosting for your monitoring nodes. This ensures your telemetry data stays within your preferred jurisdiction while providing an accurate view of global performance. Our pricing is flat and transparent. We do not charge per-subscriber fees. This makes transparency affordable for growing teams that value integrity over flashy marketing.
Proactive API and Uptime Monitoring
Setting up 1-minute checks for your deep health-check endpoints is straightforward. These checks exercise your database connection pool and write permissions as described in previous sections. StatusPulse tracks multi-region latency. This allows you to identify if Postgres lag is localized to a specific geographic market or if it indicates a global resource bottleneck. You can see exactly how your database performs from different corners of the world.
Alerting is immediate and logical. We integrate with the tools your team already uses, including Slack, PagerDuty, and Discord. When our monitoring nodes confirm a failure, your developers receive the context they need to start debugging. This reduces the stress of technical disruptions by ensuring you are the first to know when the data layer degrades.
AI-Driven Incident Communication
Drafting incident updates during a database outage is a high-pressure task. Our AI assistant helps you summarize technical logs into clear, human-readable summaries in seconds. This allows your engineers to focus on the fix while the system handles the communication. Maintaining a public status page builds long-term brand equity by proving your commitment to honesty and reliability.
A reliable status page is a signature of a principled team. It transforms a technical failure into a demonstration of professional authority. By automating the link between monitoring alerts and public updates, you ensure your users always have the truth. Start monitoring your Postgres stack with StatusPulse for free and move beyond the limitations of basic HTTP checks today.
Secure Your Data Layer with Deep Observability
Relying on the network edge leaves your application vulnerable to silent failures. You've seen Why HTTP Checks Aren't Enough: Monitoring Postgres requires probing the actual request lifecycle and internal database states. By monitoring connection saturation, long-running locks, and resource pressure, you move from reactive firefighting to proactive management. Automated transparency through public status pages reduces support burden and builds technical credibility with your users during the most stressful moments.
StatusPulse provides this full-stack visibility without the complexity or per-subscriber costs of traditional enterprise tools. You get the choice of EU or US hosting to maintain data sovereignty while utilizing integrated AI to handle incident summaries efficiently. It is a straightforward approach for teams that value technical precision over corporate bloat. Your users deserve a status page that reflects reality. Take control of your database health and ensure your 200 OK statuses are backed by a healthy data layer.
Stop guessing and start monitoring with StatusPulse
Frequently Asked Questions
Is SELECT 1 enough for a database health check?
No, a SELECT 1 query is a basic connectivity test but it is not a complete health check. It confirms the Postgres process is accepting queries; however, it misses issues like read-only failovers, schema mismatches, or table-level locks that block writes. This is a core reason Why HTTP Checks Aren't Enough: Monitoring Postgres at the application layer requires deeper synthetic probing.
How often should I probe my Postgres database for uptime monitoring?
Probing every 60 seconds is the industry standard for critical production paths. This interval provides a low Mean Time to Detection (MTTD) without causing resource exhaustion. For less critical internal tools, 5-minute intervals might be acceptable. The goal is to catch failures before your users report them through support tickets.
Will deep health checks slow down my database performance?
A well-designed health check has a negligible impact on performance. Executing a simple read or write once per minute uses fewer resources than a single user request. You should cache the status result for 10 to 30 seconds. This prevents multiple monitoring nodes from creating a "thundering herd" effect on your connection pool.
What is the difference between an agent-based and agentless monitor for Postgres?
Agent-based monitors require installing software on your database host to collect deep system metrics like disk I/O. Agentless monitoring uses synthetic API probes to test the database from the user's perspective. While agents provide more internal data, agentless probes are easier to set up and better at detecting "Zombie App" states where the network is up but the data layer is dead.
Should I put my database monitoring on my public status page?
Transparency is vital for maintaining user trust. You don't need to show raw query latency graphs, but you should link your database health to a service status indicator. If the database is struggling, your status page should reflect a "Partial Outage" even if the web server is reachable. This proactive communication reduces the load on your support team.
How do I handle monitoring during planned database maintenance?
You should use maintenance windows to silence alerts and update your status page proactively. Most monitoring platforms allow you to schedule these periods in advance. This prevents your team from being paged during a planned migration and keeps your uptime statistics accurate by excluding scheduled downtime from your reliability reports.


