

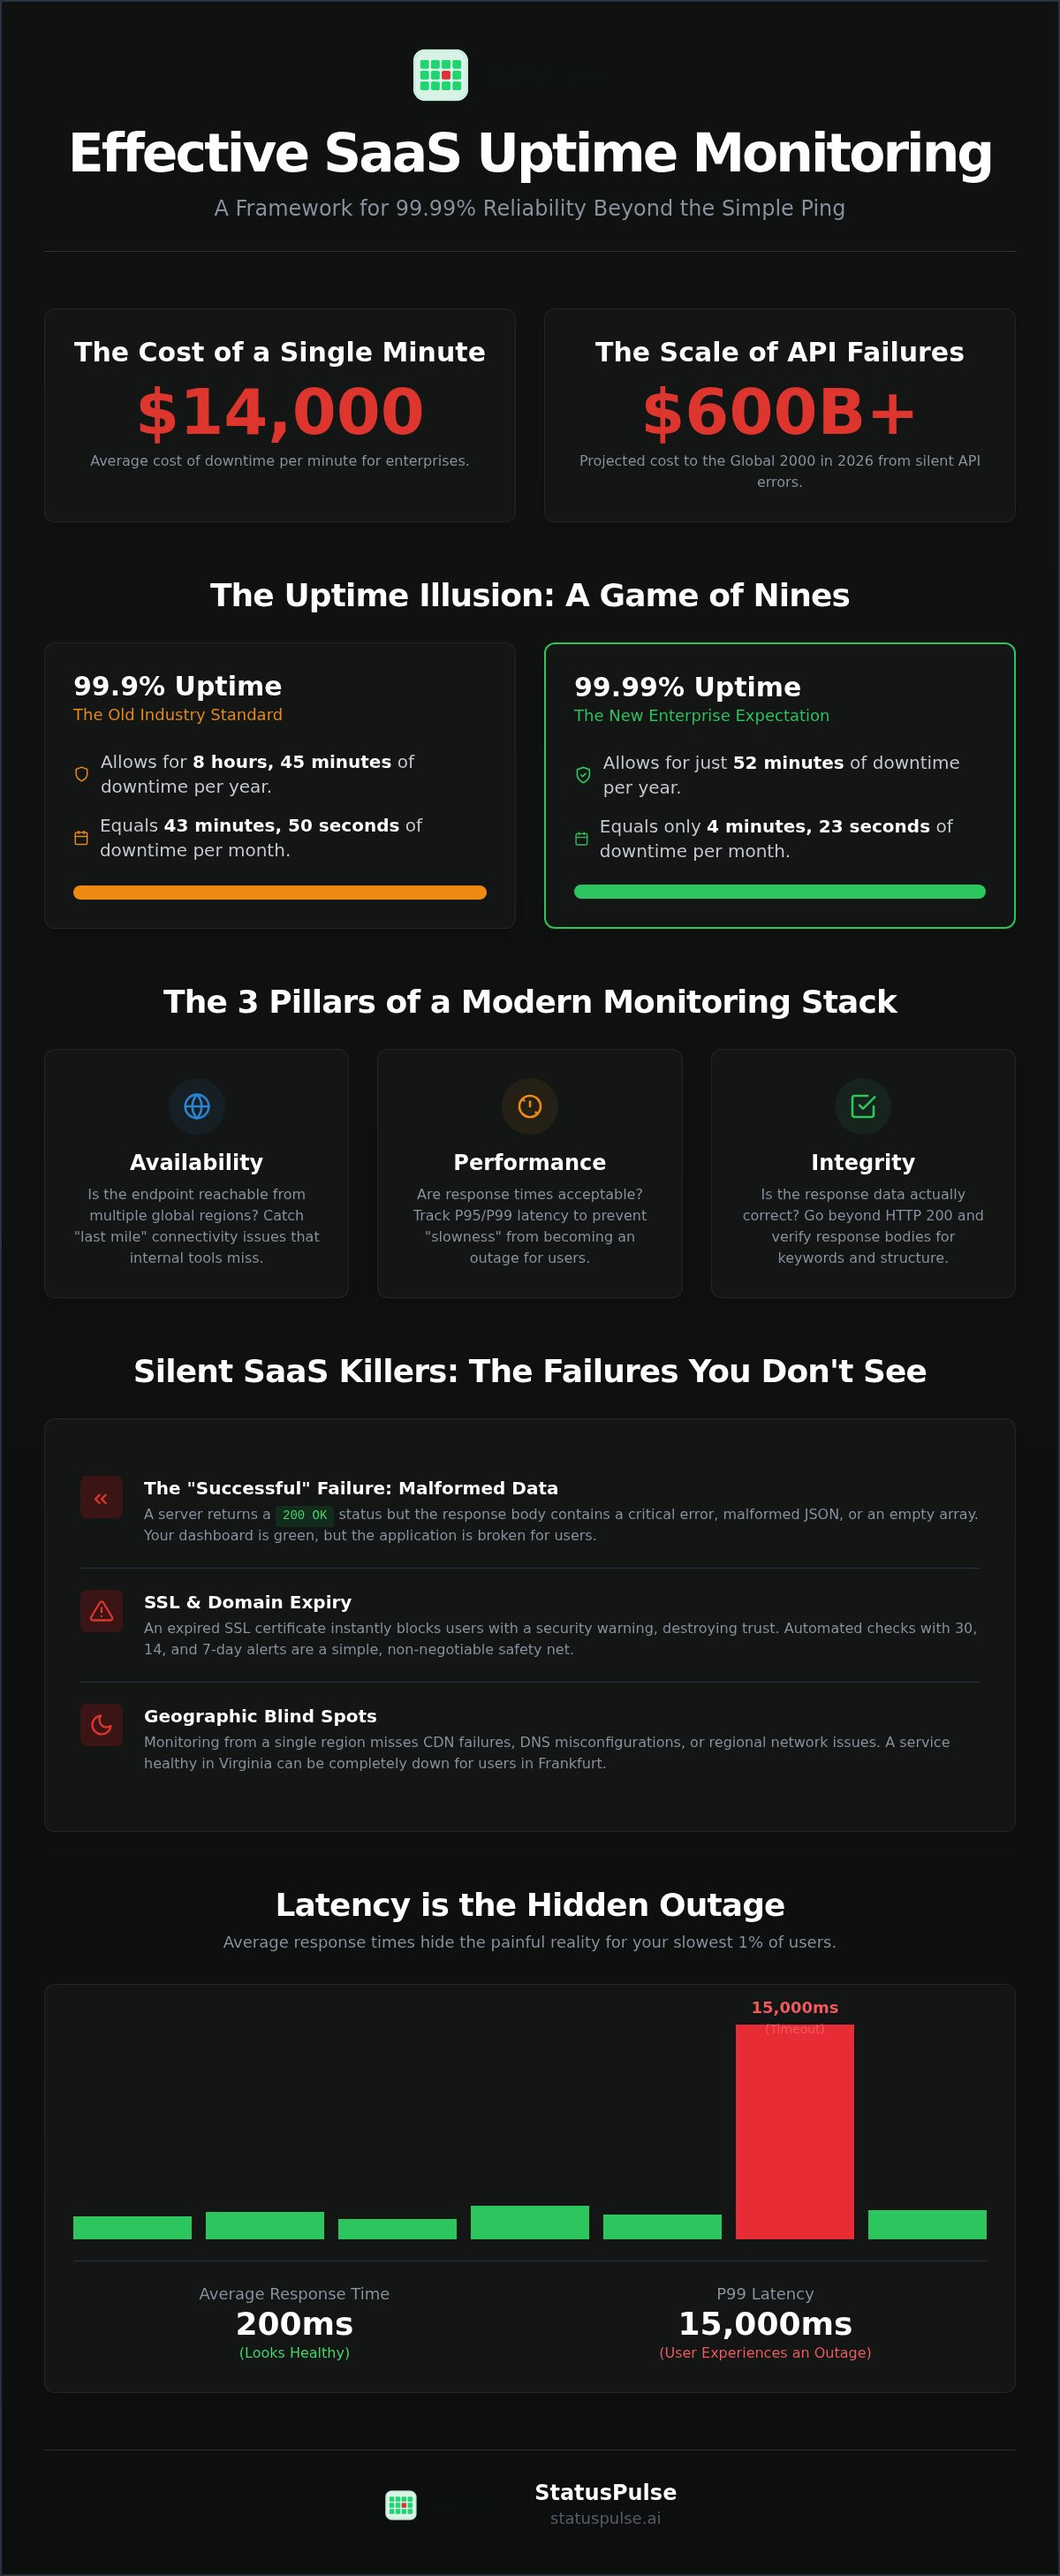
If your monitoring stack only pings an HTTP 200 OK, you're likely missing the silent API failures that cost the Global 2000 over $600 billion in 2026. A green light on a dashboard doesn't always mean your service is functional for the end user. Effective uptime monitoring for saas requires more than simple pings; it demands a strategy that catches logical errors before they reach your customers. You understand that 99.9% uptime is no longer the industry benchmark. With enterprise clients now expecting 99.99% reliability, you only have 52 minutes of allowable downtime per year.
This framework shows you how to build a resilient monitoring stack that pairs high-frequency checks with transparent incident communication. We'll move beyond basic status checks to address multi-region complexity and the rising costs of downtime, which now averages $14,000 per minute. You'll learn to automate your response to SSL expirations and API timeouts while maintaining strict GDPR compliance. We'll also examine how to eliminate the per-subscriber fees that make status pages unnecessarily expensive. This is a technical look at maintaining 2026 reliability standards without the corporate bloat of legacy providers.
Key Takeaways
- Learn why external monitoring is essential to catch "last mile" connectivity issues that internal logs and observability tools often miss.
- Understand the mathematical difference between 99.9% and 99.99% uptime and why tracking P99 latency is a better indicator of user experience than simple averages.
- Develop a comprehensive strategy for uptime monitoring for saas that balances synthetic "canary" checks with Real User Monitoring for ground-truth data.
- Master the "Golden Hour" of incident response by automating the transition from detection to transparent customer communication.
- Evaluate the benefits of all-in-one monitoring platforms that provide flat pricing and regional hosting options to simplify GDPR compliance.
Beyond the Ping: Defining the Modern SaaS Monitoring Stack
Uptime monitoring for saas is an external audit of your service from the customer's perspective. It is distinct from internal observability. While tools like Grafana provide visibility into your infrastructure, they often miss "last mile" connectivity issues. If a regional CDN fails or a DNS entry is misconfigured, your internal logs will show a healthy system while your users see a timeout. This is why you need a perspective that exists outside your own network.
A modern stack rests on three pillars that define the user experience:
- Availability: Ensuring the endpoint is reachable from multiple global regions.
- Performance: Tracking response times to prevent "latency as downtime."
- Integrity: Verifying that the returned data is actually correct and usable.
This outside-in approach complements Application Performance Management (APM) by validating the final delivery of your service across the public internet. It focuses on the result rather than the underlying process.
The Failure of the 200 OK Status Code
Traditional monitoring often stops at the HTTP status code. This is a dangerous oversight for modern APIs. A server might return a 200 OK while serving a malformed JSON object or an empty array. To prevent these silent failures, you should implement keyword monitoring. This technique looks for specific strings in the response body to confirm the application logic is executing correctly. Synthetic monitoring acts as a proactive simulation of user paths. It tests complex multi-step workflows like login or checkout before a human encounters an error. Without this, you're only monitoring the web server, not the application itself.
SSL and Domain Expiry: The Silent SaaS Killers
SSL certificate lapses are entirely avoidable, yet they remain a frequent cause of outages. When a certificate expires, browsers block access with a "Connection Not Private" warning. This destroys user trust instantly. You should set automated checks to verify certificate validity every 24 hours. Modern uptime monitoring for saas includes these checks by default. It alerts your team 30, 14, and 7 days before an expiry date. Domain renewals follow a similar pattern. Losing a domain because of an expired credit card is a preventable disaster. External monitoring provides the safety net that internal tools cannot offer.
SaaS Metrics That Impact Customer Churn and SLAs
Reliability is often a mathematical misunderstanding. Most teams target 99.9% uptime, which allows for 43 minutes and 50 seconds of downtime every month. If you move the goalpost to 99.99%, your monthly allowance drops to just 4 minutes and 23 seconds. This difference is significant. For an enterprise client, 43 minutes of missing service during a workday is a breach of trust that leads directly to churn. Reliability is a social contract, and the math defines the terms.
Average response times are equally misleading. A 200ms average can hide a P99 latency of 15 seconds for users in specific regions. When 1% of your requests are failing or timing out, those users aren't experiencing "slow" service; they're experiencing an outage. Tracking P95 and P99 latency provides a clearer picture of the "felt" uptime that actually impacts renewal rates. In the B2B world, performance is a core feature, not a technical detail.
Setting realistic Service Level Objectives (SLOs) requires a balance between engineering capacity and customer expectations. Use this checklist to define your targets:
- Identify critical user paths like authentication or data export.
- Define the maximum acceptable P99 latency for these paths.
- Establish the minimum success rate for API calls.
- Align these metrics with your legal SLA commitments.
Global Latency and Multi-Region Probes
Monitoring from a single data center creates dangerous blind spots. A service might look healthy from a probe in Virginia while users in Frankfurt suffer from DNS routing issues or CDN failures. To get an accurate view of uptime monitoring for saas, you must test from multiple geographic locations. This is particularly vital for maintaining API Monitoring: The Developer’s Guide to High Availability in 2026. Testing from both EU and US nodes ensures your performance data reflects the reality of a global user base and respects regional data sovereignty.
Third-Party Dependency Monitoring
Your SaaS doesn't live in a vacuum. You likely rely on Stripe for payments, AWS for hosting, or Twilio for communications. When these services fail, your customers blame you. Monitoring these third-party endpoints allows you to implement circuit breakers and update your status page before the support tickets pour in. It's critical to distinguish between internal infrastructure failures and upstream provider outages. By using specialized API monitoring tools, you can prove to your customers that your system is resilient even when a vendor falters. Clear attribution prevents unnecessary damage to your brand reputation.
Synthetic vs. Real User Monitoring (RUM): Choosing Your Strategy
Choosing between synthetic and real user monitoring isn't a binary decision. Synthetic monitoring acts as your canary in the coal mine. It uses automated probes to simulate user interactions at regular intervals from diverse global locations. Real User Monitoring (RUM) serves as the ground truth. It captures actual performance data from real visitors as they navigate your application. Effective uptime monitoring for saas requires a balance of both to provide proactive alerting and reactive forensic analysis.
Early-stage SaaS teams often prioritize synthetic checks because they are predictable and easy to configure. They provide a fixed cost model that doesn't fluctuate with traffic spikes. As you scale into the enterprise tier, RUM becomes necessary to understand how network conditions in specific regions affect your P99 latency. Synthetic checks tell you if the door is open. RUM tells you if people are actually making it through the lobby. Enterprise teams often use RUM to justify infrastructure spend by showing exactly where users are dropping off due to slow load times.
When to Use Synthetic Checks
Synthetic monitoring is the standard for 1-minute uptime heartbeats. It is the only way to test "cold paths" that users rarely trigger, such as password resets, new user onboarding, or account deletion workflows. If these paths break, you won't know until a frustrated user contacts support or abandons the platform entirely. You can set up a basic health check endpoint in your application to return a simple JSON response for these probes. This ensures your uptime monitoring for saas is testing the application layer, not just the load balancer.
// Example Node.js Health Check Endpoint
app.get('/health', (req, res) => {
  const dbStatus = checkDbConnection(); // Verify DB health
  if (dbStatus) {
res.status(200).json({ status: 'ok', timestamp: new Date().toISOString() });
  } else {
res.status(503).json({ status: 'error', message: 'Database unavailable' });
  }
});
This allows your monitoring tool to verify not just connectivity, but also the health of your underlying infrastructure before a user ever encounters an error.
The Limitations of RUM for Availability
RUM has a fundamental flaw: it requires a visitor to trigger a script. It cannot alert you at 3 AM if no one is on your site. If your entire platform goes offline, your RUM data simply stops flowing, which provides no diagnostic information about why the outage occurred. Additionally, RUM scripts add weight to your page load and carry privacy implications that require careful management under GDPR and other regional regulations.
For a deeper look at balancing these tools, see our guide on Website Uptime Monitoring Tools: A Developer’s Guide to 2026 Reliability. While RUM is excellent for performance tuning, it is a poor substitute for the consistent, high-frequency signals provided by synthetic checks. Use synthetic monitoring for your SLA commitments and RUM for your product roadmap decisions.
Building a Transparent Incident Response Workflow
Uptime monitoring for saas is only half the battle. The other half is how you handle the fallout when things break. Silence during an outage is a choice that destroys customer trust. When users can't access your service, they default to frustration. A transparent incident response workflow converts that frustration into a manageable technical event. It signals that your team is in control, even when the infrastructure is not.
The "Golden Hour" of incident communication defines your reputation. You must Detect the failure, Verify its scope, and Communicate the status within 30 minutes. Waiting for a perfect diagnosis before speaking is a mistake. Your customers need to know you are aware of the issue so they can stop debugging their own systems. A public status page acts as a primary support ticket deflector. It provides a single source of truth that prevents your help desk from being overwhelmed. Private status pages offer a different value, allowing you to share granular data with internal stakeholders or high-value enterprise clients without alerting the general public to every minor blip.
AI-Assisted Incident Drafting: Reducing Cognitive Load
Technical teams often struggle to write clear updates during a crisis. The cognitive load of fixing a database deadlock while drafting an empathetic email is high. AI-assisted incident drafting helps turn raw log data into human-readable updates. This ensures your communication remains technical but empathetic. StatusPulse AI incident management assists in this specific workflow by generating drafts based on the detected error. It allows your engineers to focus on the fix while the communication remains consistent and accurate.
Automated Status Alerts and Subscriber Management
Manual email chains are too slow for modern SaaS. The industry has shifted toward automated Slack, Discord, and SMS alerts. This ensures stakeholders get information where they actually work. However, many legacy providers use per-subscriber pricing models. We view this as a "success tax" on your growth. As your user base expands, your communication costs shouldn't penalize you for being transparent. You should look for platforms that offer flat pricing to avoid these hidden costs.
For a deeper dive into these structures, read about The Architecture of Incident Communication Transparency. Managing these alerts shouldn't be a manual burden. You need a system that handles subscriber preferences automatically. If you want to simplify your response, you can launch a public status page that integrates directly with your monitoring stack.
StatusPulse: Purpose-Built Monitoring for Technical Teams
Most monitoring tools are built for sales demos rather than incident response. They feature cluttered dashboards and complex configuration menus that slow you down when every second counts. StatusPulse is built by developers for developers who value precision over corporate bloat. It integrates uptime monitoring for saas, public status pages, and AI-driven incident management into a single, focused dashboard. This unified approach eliminates the need to context-switch between disconnected tools during an outage.
Transparency extends to the pricing model. Legacy providers often charge per-subscriber fees, which creates an unpredictable cost as your SaaS grows. We use a flat pricing structure that ensures your costs remain stable even as your audience expands. There are no hidden fees for adding more team members or status page subscribers. This ethical approach to billing allows your team to focus on reliability rather than budget management.
European Data Sovereignty and Compliance
Data residency is a critical requirement for modern SaaS compliance. Many monitoring services default to US-based hosting, which can complicate GDPR alignment for European companies. StatusPulse provides a choice between EU and US hosting locations to support your data sovereignty needs. By selecting a regional node, you ensure that your monitoring metadata and incident logs stay within your preferred jurisdiction. This security-first architecture respects regional privacy standards without sacrificing global probe coverage.
We avoid the "feature creep" that plagues enterprise observability suites. By maintaining a lean codebase, the platform remains fast and reliable. This focus on simplicity means the tool is always available when your primary infrastructure is not. You don't need a certification to configure a check; you just need an endpoint and a target response time.
Getting Started: 1-Minute Setup
You can add your first monitor and launch a public status page in less than 60 seconds. The setup process is designed to be direct. You enter your URL, select your check frequency, and choose your probe regions. The platform immediately begins gathering latency data and verifying your SSL certificate status. If a failure occurs, the AI assistant analyzes the error logs to draft a status update for you. This "human-in-the-loop" system ensures that while the AI helps with the heavy lifting, your team maintains final agency over all public communications.
Effective uptime monitoring for saas should be a silent partner that only speaks when necessary. It provides the technical truth you need to maintain your SLA and the communication tools you need to keep your customers' trust. If you are ready to simplify your reliability stack, you can start monitoring with StatusPulse today. Whether you are managing a handful of endpoints or a complex multi-region API, the platform scales with your technical requirements.
Implementing Your 2026 Reliability Strategy
Modern reliability requires moving beyond the simple HTTP heartbeat. You've seen how silent API failures and regional latency can bypass traditional checks. A robust strategy for uptime monitoring for saas now demands a combination of synthetic probes and transparent, automated communication. This ensures you catch outages before your customers do and maintain the 99.99% uptime expected in 2026. Technical precision is only half the contract. The other half is honest communication. By automating your incident response and choosing tools that respect data sovereignty, you protect both your infrastructure and your user trust.
StatusPulse provides a streamlined alternative to bloated enterprise suites. You get AI-powered incident drafting, specialized API monitoring, and the choice between EU or US hosting without the burden of per-subscriber fees. It's time to stop overpaying for complexity and start focusing on precision. Secure your platform's future with a stack designed for technical teams who value integrity and performance.
Build a more reliable SaaS with StatusPulse and take control of your service health today.
Frequently Asked Questions
What is the difference between uptime monitoring and observability?
Uptime monitoring provides an external, "outside-in" perspective on your service's reachability and performance. It's a binary check of whether a user can access your application. Observability is an internal, "inside-out" view involving logs, metrics, and traces. While observability tells you why a system is slow, uptime monitoring tells you if the system is actually delivering value to the end user across the public internet.
How often should I check my SaaS application’s uptime?
A one-minute check interval is the standard for modern SaaS reliability. Checking every five or ten minutes allows for significant downtime to occur before your team receives an alert. For critical API endpoints, some teams prefer 30-second intervals to catch intermittent network blips. High-frequency checks ensure you meet 99.99% SLA commitments, which only allow for roughly four minutes of downtime per month.
Can uptime monitoring detect broken features if the server is still "up"?
Yes, through keyword validation and synthetic monitoring. A server might return an HTTP 200 OK status code while serving a blank page or a "database connection error" string. By configuring your monitor to look for specific text on the page, you ensure the application logic is functioning. Synthetic checks can also simulate multi-step user paths, like logging in, to verify that core features remain operational.
Why do I need a public status page if I already send emails?
Status pages serve as a central source of truth that deflects support tickets during an outage. Emails can be delayed, caught in spam filters, or ignored by overwhelmed users. A public status page allows customers to self-serve information about ongoing incidents without waiting for a manual response. It demonstrates a commitment to transparency that builds long-term trust, even when your infrastructure encounters technical difficulties.
How does AI help in incident management for SaaS?
AI reduces the cognitive load on engineers by drafting human-readable status updates from raw technical data. During a crisis, your team should focus on the fix rather than word-smithing an email. AI assistants can suggest empathetic, clear language based on the specific error logs detected. This ensures communication remains consistent and professional while the technical team works to resolve the underlying root cause.
Is multi-region monitoring necessary for a local SaaS?
Multi-region checks are essential even for regional services. Issues with global CDNs, DNS providers, or specific internet exchange points can block access for some users while others see no problem. Using a diverse probe network for uptime monitoring for saas helps identify these localized routing failures. It prevents "false greens" where your site appears healthy from your own office but is unreachable for a segment of your customers.
How much does uptime monitoring for SaaS typically cost?
Pricing models vary significantly across the industry. Legacy enterprise providers often use complex "per-subscriber" or "per-user" fees that act as a tax on your growth. Modern, ethical alternatives favor flat monthly rates. This approach provides predictable costs regardless of how many customers subscribe to your status updates. You should look for a provider that offers transparent pricing without hidden charges for team seats or global probe locations.
What happens to my status page if the monitoring provider goes down?
Reliable providers host status pages on infrastructure that is physically and logically separate from their monitoring engine. This decoupled architecture ensures your communication channel remains available even if the monitoring service itself encounters an issue. Always verify that your status page is hosted in a different region or on a different cloud provider than your primary application to maintain a redundant path for customer communication.


