

Your monitoring dashboard shows a sea of green, yet the support tickets are flooding in. A service returns a 200 OK status while the actual payload is an empty object or a mangled error string. This silent failure is the reality for teams relying on basic heartbeats. Learning how to monitor api uptime effectively requires moving beyond simple connectivity checks toward functional validation. It involves using synthetic tests to verify that endpoints return the correct data structures within acceptable latency thresholds across global regions.
We agree that false positives lead to alert fatigue and that monitoring authenticated endpoints is often more complex than it should be. You need a system that mimics real user behavior without the complexity of corporate bloat. This technical guide provides the precise steps to implement synthetic monitoring that validates performance, data integrity, and regional availability. We will explore how to configure multi-step checks, handle headers for protected routes, and reduce your Mean Time to Detection (MTTD). By the end, you'll have a blueprint for high-availability services and transparent communication with your stakeholders.
Key Takeaways
- Validate functional integrity beyond simple HTTP 200 status codes to detect silent failures and broken payloads.
- Learn how to monitor api uptime using synthetic tests that simulate real-world interactions from diverse global regions.
- Implement secure monitoring for authenticated endpoints using custom headers, OAuth2, and JWT management.
- Reduce on-call fatigue by configuring smart retry logic and flapping thresholds to filter out transient network blips.
- Automate stakeholder communication by integrating API check results directly with public status pages to improve transparency.
Defining API Uptime Beyond the 200 OK Status
API uptime is the ratio of time an endpoint is both reachable and fully functional. It's a common mistake to treat uptime as a binary state. A service might be accessible over the network while failing to process logic or retrieve data. API availability is a metric of successful business transactions, not just server responsiveness.
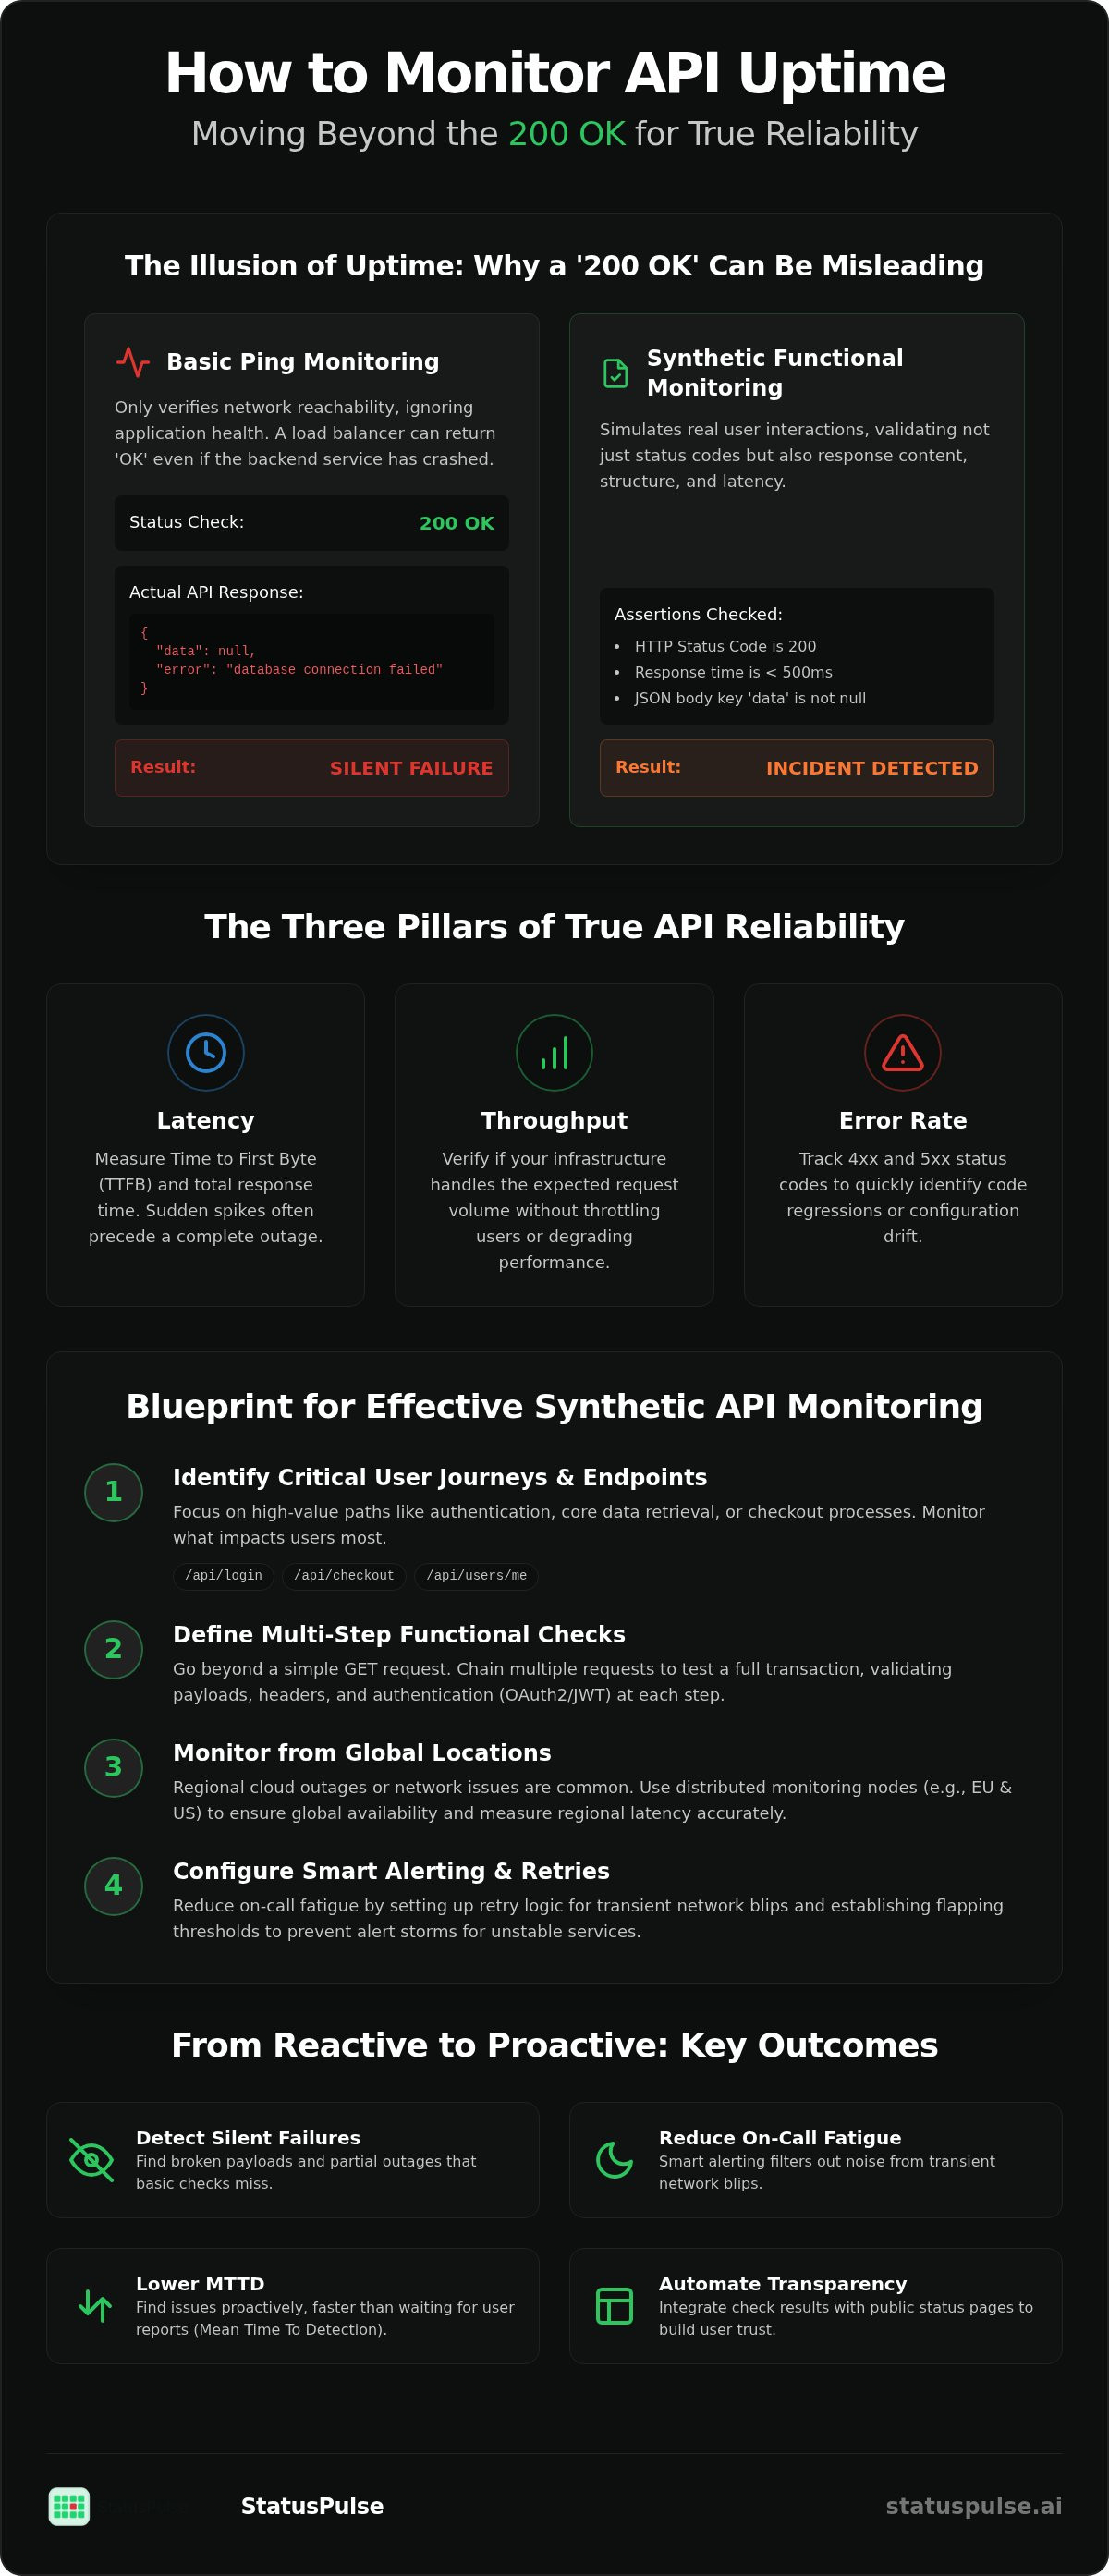
Many legacy systems rely on a 200 OK status code to signal health. This is a dangerous assumption. A backend database could be unreachable, yet the API gateway continues to serve 200 OK responses with an empty payload or a generic error string hidden in the JSON body. Understanding how to monitor api uptime requires moving toward functional validation. This means your monitoring tool must inspect the response time, specific headers, and the structure of the returned body schema.
The Problem with Basic Ping Checks
Basic ping checks only test network reachability. They confirm that a server exists at a specific IP address but offer zero insight into application health. Modern architectures often hide services behind load balancers. These balancers are designed to stay up even when the backend application crashes. They will often return a success code while your users face a broken experience.
Effective API Management and Monitoring strategies prioritize deep inspection over simple heartbeats. You need to validate the actual JSON or XML payloads to ensure the data matches your expectations. If the schema is broken, the API is down. It doesn't matter what the HTTP status code says if the integration fails for the end user.
Key Metrics: Latency, Throughput, and Error Rates
Reliability is built on three pillars: latency, throughput, and error rates. Latency should be measured as both Time to First Byte (TTFB) and total response time. Sudden spikes in latency often precede a complete outage. Throughput identifies if your infrastructure handles the expected request volume without throttling users. Finally, tracking error rates (4xx and 5xx) provides the fastest signal of code regressions or configuration drift.
At StatusPulse, we focus on these granular metrics to provide a truthful view of service health. By validating specific body content and response times, you eliminate the silent failures that traditional ping tools miss. This approach ensures that your status page reflects the actual user experience rather than a misleading network handshake.
Implementing Synthetic API Monitoring for Reliability
Synthetic monitoring removes the guesswork of waiting for logs to populate. It acts as a permanent, automated user that verifies your system's health around the clock. This creates a consistent baseline for performance that isn't skewed by traffic volume or user-side connectivity issues. Understanding how to monitor api uptime effectively means moving from reactive logs to proactive synthetic checks.
The implementation follows a logical progression. First, identify critical endpoints such as authentication, checkout, or core data retrieval. Second, define your expected response schemas and status codes. Finally, set a check frequency. For high-priority APIs, 1-minute intervals are the industry standard to ensure a low Mean Time to Detection (MTTD).
Validating Payloads and JSON Schemas
A successful HTTP status code doesn't guarantee a successful response. Use assertion libraries to check for specific keys within the JSON body. Ensure data types match your documentation. A string where an integer is expected can break a frontend integration just as easily as a 500 error.
This level of detail helps detect partial outages where specific fields return null incorrectly while the rest of the service appears functional. Foundational principles in technical monitoring solution design emphasize that availability is tied directly to these functional successes. If the data is mangled, the API is effectively down for the consumer.
Global Monitoring: Why Region Matters
Latency is a physical reality dictated by distance. A service that responds in 50ms from London might take 200ms from New York. Regional outages are common; a cloud provider's incident in EU-West doesn't always impact US-East. Monitoring from multiple global nodes ensures you catch these localized failures before your customers report them.
Distributed checks also support data sovereignty requirements by allowing you to choose where your monitoring data is processed. At StatusPulse, we provide monitoring from both EU and US locations to give you a truthful view of global performance. You can configure multi-region API monitoring to ensure your services remain reachable and compliant with regional privacy standards without the bloat of enterprise-only tools.
Handling Authentication and Secure Endpoints
Most production APIs don't live in the open. They are protected by OAuth2, JWT, or static API keys to prevent unauthorized access. If you only monitor public endpoints, you miss the failure points that actually impact your revenue. Understanding how to monitor api uptime for secure routes requires a tool that handles dynamic handshakes and custom headers. Expired or misconfigured service tokens are a frequent cause of "silent" downtime that triggers alerts even when the server is healthy.
Avoid the trap of hardcoding credentials into your monitoring scripts. This creates a security liability and makes rotation difficult. Use environment variables or integrated secret vaults to manage sensitive keys. This ensures your monitoring configuration remains portable and secure without exposing production secrets in plain text.
Monitoring OAuth2 and JWT Flows
JWT and OAuth2 flows require the monitor to behave like a legitimate client. The most reliable approach is to configure a pre-request script that fetches a fresh token before the main functional check. This validates that your Identity Provider (IdP) is also responsive. If the token request fails, you catch an authentication outage before it hits your users. Following API monitoring best practices means treating "401 Unauthorized" errors as a distinct alert category. It helps you differentiate between a code regression and a simple credential expiration.
Monitoring these flows also allows you to validate token refresh logic. You can set assertions to check that the returned token contains the expected scopes or claims. This ensures that your authorization logic is functioning as intended, not just granting access blindly. It's a deeper level of validation that moves beyond simple reachability.
Security Best Practices for Monitor Agents
Always use dedicated "monitoring users" with strictly limited read-only permissions. Never use admin-level credentials for uptime checks. If a monitoring node is compromised, the principle of least privilege ensures your data remains protected. You should also whitelist the IP addresses of your monitoring provider in your firewall or WAF. This prevents your security layer from accidentally flagging monitoring traffic as a DDoS attack.
Review your monitoring logs regularly to ensure sensitive data isn't leaked in response bodies or headers. At StatusPulse, we prioritize this balance between visibility and security. Our platform supports custom headers and environment variables, allowing you to monitor protected routes without the complexity of corporate bloat. You get the technical depth needed for secure endpoints while maintaining a clean, ethical footprint in your stack.
Alerting Strategies to Minimize On-Call Fatigue
Alert fatigue is the leading cause of SRE burnout. It happens when a monitoring system cries wolf too often. Eventually, engineers start ignoring notifications, which leads to missing actual critical outages. Learning how to monitor api uptime effectively means building a system that respects your team's time. You need to distinguish between a transient network hiccup and a genuine service collapse.
One of the biggest culprits is "flapping." This occurs when an API rapidly switches between up and down states due to minor latency or congestion. You can prevent this by implementing smart retry logic. Don't alert on the first failure. Instead, set a threshold for consecutive failures. A common rule is to require three failed checks within a three-minute window before triggering a high-priority notification. This simple filter eliminates the noise of temporary blips.
Tier your alerts based on severity to keep your response focused. Slack or Microsoft Teams works well for warnings or non-critical performance regressions. Reserve aggressive tools like PagerDuty or SMS for total service failures that violate your uptime commitments. At StatusPulse, we incorporate AI to summarize incident logs. This gives your team an immediate, readable context of the failure, reducing the time spent parsing raw JSON errors during a 2 AM incident.
Setting Realistic SLAs and SLOs
Your monitoring strategy must be grounded in your commitments. Service Level Agreements (SLAs) are the legal contracts you have with your customers. They define the minimum acceptable performance. Service Level Objectives (SLOs) are your internal goals. They should always be more ambitious than your SLAs. If your SLA promises 99.9% uptime, your internal SLO should target 99.99%. This creates a buffer that allows you to catch issues before they become legal or financial liabilities.
Root Cause Analysis with Monitoring Data
Monitoring is only half the battle. When an API fails, you need to know why. Correlate your uptime data with your deployment timestamps. Most outages are caused by recent changes. Use trace IDs to follow a failed request through your entire stack to see exactly where the logic broke. StatusPulse stores historical data so you can identify recurring performance bottlenecks that might signal technical debt. This long-term visibility is essential for moving beyond firefighting toward a more stable architecture.
You can implement AI-driven incident management to cut through the noise and focus on the technical failures that actually matter to your business.
Integrating Monitoring with Public Status Pages
Detecting a failure is only the first step. If your users discover an outage before you announce it, you've already lost their trust. Communication is the second half of the reliability equation. Mastering how to monitor api uptime involves bridging the gap between technical detection and stakeholder notification. Automating this connection ensures that your status page reflects the real-time health of your services without requiring manual intervention during a crisis.
Manual updates often fail during high-pressure incidents because the team is focused on the fix. StatusPulse connects uptime monitors directly to public status pages to eliminate this delay. This integration ensures that as soon as a synthetic check fails your predefined assertions, the status page shifts to a degraded state automatically. It removes the human bottleneck and provides immediate clarity to your end users.
Building a Culture of Transparency
When an incident occurs, avoid vague marketing language. Technical users prefer directness. State which specific endpoints are affected and provide an estimated time to recovery if known. Use AI-driven assistants to draft these incident reports based on the failure logs. This allows your engineers to stay focused on the root cause while the communication remains professional and accurate. Transparency doesn't just manage expectations; it builds long-term loyalty even when things go wrong.
Effective communication also requires a clear summary of the impact. Tell your users who is affected and if there is a temporary workaround they can implement. Being honest about the scope of a disruption prevents your support queue from being overwhelmed by the same query. It shows that your team is in control of the situation and values the user's time as much as your own.
Choosing a Monitoring Partner
Your choice of a monitoring partner should align with your technical and ethical standards. When deciding how to monitor api uptime for a growing infrastructure, consider the hidden costs of enterprise bloat. Evaluate tools based on their hosting location to support data sovereignty. StatusPulse offers a choice between EU and US hosting to ensure you meet regional compliance requirements without compromise.
We also prioritize flat pricing that doesn't penalize your growth with per-subscriber fees. Reliability should be accessible, not a luxury tied to your user count. For more technical insights on building a resilient system, read our Developer’s Guide to High Availability. Choosing the right partner means finding a team that values precision and privacy as much as you do.
Building a Resilient API Infrastructure
Reliability is a continuous process of validation rather than a one-time configuration. You now have the technical framework for how to monitor api uptime using synthetic tests that verify logic, payloads, and regional availability. Moving beyond simple heartbeats allows you to catch failures before they impact your users. Implementing smart alerting thresholds ensures your team stays focused on genuine incidents instead of transient network noise.
Choosing a monitoring partner that respects your data and your budget is the final step in this journey. StatusPulse provides a straightforward platform with EU/US data sovereignty and AI-powered incident management. We avoid the complexity of corporate bloat by offering a flat pricing model with no per-subscriber fees. This ensures your costs remain predictable even as your audience grows.
Start Monitoring Your APIs with StatusPulse today to build a more transparent and reliable service for your stakeholders. You have the tools to transform technical disruptions into opportunities for building lasting trust. Your users will appreciate the honesty, and your team will appreciate the clarity.
Frequently Asked Questions
What is the difference between uptime and availability in API monitoring?
Uptime is the binary state of your server being powered on and reachable. Availability is a broader metric that confirms the endpoint is functionally usable for its intended purpose. You can have 100% uptime with 0% availability if your application logic is broken or the database is unreachable. Focus on measuring availability through functional assertions rather than simple network pings.
How often should I check my API endpoints for uptime?
High-priority APIs require checks at 1-minute intervals to maintain a low Mean Time to Detection (MTTD). Less critical services or internal tools might use 5-minute or 15-minute intervals to reduce noise. Your check frequency should align with your Service Level Objectives (SLOs) and the financial impact of a potential outage. Frequent checks ensure you catch transient issues before they escalate.
Can I monitor APIs that require multi-step authentication?
Yes, sophisticated tools support pre-request scripts to handle OAuth2 or JWT handshakes before the main functional check. This validates the full authentication flow rather than relying on a static token that will eventually expire. It's a critical part of learning how to monitor api uptime for secure, production-grade environments. Scripts allow your monitor to behave exactly like a legitimate client application.
What should I do if my API monitor reports a false positive?
Verify the failure from a different geographic node to filter out local network congestion. You should also implement retry logic, such as requiring three consecutive failures before triggering a high-priority alert. This prevents "flapping" and reduces on-call fatigue. If the monitor is still too sensitive, adjust your timeout thresholds to better reflect real-world latency under heavy load.
How do I monitor APIs from different geographic regions?
Use a monitoring provider that offers distributed check nodes across multiple continents, including EU and US regions. This helps you identify localized outages that might only affect specific customer segments. Testing from diverse locations provides a truthful view of global latency. At StatusPulse, we offer a choice of hosting regions to help you maintain data sovereignty while ensuring global reachability.
Should I use public or private status pages for API health?
Public status pages are best for external transparency and reducing support ticket volume during major outages. Private status pages are used for internal stakeholder communication during sensitive incidents or maintenance windows. Most teams benefit from a public page to build trust with their users. StatusPulse integrates both options to ensure your communication strategy matches your specific audience and privacy requirements.
How does API monitoring affect my service performance?
Synthetic monitoring has a negligible impact on performance because it involves a single request at fixed intervals. It simulates a single user, which is a rounding error compared to typical production traffic. You should, however, ensure your monitoring agent doesn't accidentally trigger rate limits or security blocks in your WAF. Whitelisting the monitoring IPs is a standard practice to prevent these artificial disruptions.
What are the most common causes of silent API failures?
Silent failures are usually caused by database connection timeouts, broken JSON schemas, or expired third-party integration tokens. These issues often return a 200 OK status while delivering an empty or mangled response body. Understanding how to monitor api uptime requires moving beyond status codes to validate the actual content of the payload. Functional assertions are the only way to catch these regressions before your users do.


