

You hit refresh and the browser hangs. That familiar spike of adrenaline hits. You immediately wonder: is my website down for everyone or just me? It's a high-stakes question. Gartner research suggests the average cost of IT downtime reached $14,056 per minute in 2025. False positives cause unnecessary panic, while missed outages damage user trust and drain revenue.
We've all spent too much time switching between VPNs and mobile hotspots just to verify a local routing issue. This guide moves past manual guesswork. You'll learn how to systematically diagnose whether a connectivity failure is localized to your network or a genuine global service outage. We'll examine how to use tools like cURL 8.22.0 and BIND 9.20 to isolate the specific network segment failing. This process ensures you only trigger an incident response when it's actually required. We'll cover everything from DNS propagation checks to identifying regional routing black holes and determining when a public status update is necessary.
Key Takeaways
- Distinguish between origin server failures and local network path issues to prevent false alarms and unnecessary incident escalations.
- Learn how to use synthetic monitoring to answer if a website is down for everyone or just me without relying on biased local browser results.
- Identify technical bottlenecks like DNS propagation delays and BGP routing loops that create regional access issues.
- Master CLI tools like
curlandmtrto isolate exactly where a connection is dropping in the network stack. - Implement proactive uptime monitoring and public status pages to communicate disruptions before users encounter them.
Down for Me vs. Down for Everyone Distinction
The question "is my website down for everyone or just me" is the starting point for every incident response. Understanding the distinction prevents wasted hours debugging a local network that isn't actually broken. A site is down for everyone when the origin server or the primary CDN edge fails to respond to global requests. This is a systemic failure. If the server is healthy but your local network path is misconfigured, the site is only down for you. Simply asking "is my website down for everyone or just me" doesn't solve the problem, but it defines your troubleshooting path.
Your first indicator is the HTTP status code. Errors in the 5xx range, such as 503 Service Unavailable or 500 Internal Server Error, typically point to server-side distress. Conversely, a "Connection Refused" or "DNS_PROBE_FINISHED_NXDOMAIN" message often suggests the request failed before reaching the infrastructure. Be careful with browser behavior. Browser cache often tricks you into seeing a "live" site that is actually down. The browser serves a local copy of the HTML while the server is offline. Always use a private window or a hard refresh to bypass these local files.
Common Client-Side Failure Points
Local DNS cache issues are a primary cause of false positives. Your operating system might be trying to resolve a domain to an old IP address after a migration. VPN and proxy configurations also introduce points of failure. They can intercept traffic or route it through congested nodes, making a site appear unreachable. Additionally, browser extensions or aggressive local firewalls can block specific scripts. This creates a partial loading failure that looks like a total outage to the end user.
Server-Side vs. Infrastructure Failures
True outages usually stem from resource exhaustion or configuration errors. Origin server crashes often result from OOM (Out of Memory) kills or sustained CPU spikes during traffic surges. These affect every user trying to reach the backend. Expired SSL certificates are another common global failure. They cause "Connection Not Private" errors that stop traffic in its tracks across all browsers. Infrastructure issues can also be regional. CDN-wide outages might affect specific geographic areas while leaving others untouched. This complexity is why we advocate for uptime monitoring that checks from multiple global locations. Testing from a single point is never enough to confirm global availability.
Technical Bottlenecks: Why a Site Appears Down Locally
The internet isn't a single wire. It's a complex web of handoffs where failures often occur in the "middle mile." When you ask, "is my website down for everyone or just me," you're often looking at a path failure rather than a server crash. DNS propagation is a frequent culprit. After updating A or CNAME records, it can take 24 to 48 hours for every ISP globally to update their cache. While your local machine might see the new IP, your colleague across town might still be routed to a decommissioned server.
Routing flaps and BGP (Border Gateway Protocol) issues also create regional "black holes." ISPs may experience routing loops that only affect specific geographic areas. Similarly, CDN cache poisoning can occur at the edge. A single local node might store a 404 error during a brief blip, serving that error to local users while the rest of the world receives a 200 OK. These bottlenecks make binary uptime checks unreliable and lead to false positives that drain engineering resources.
The Role of DNS in Local Outages
Local resolvers are often the weakest link in your connection. You can use dig or nslookup to see exactly what your ISP's DNS server thinks your IP is. If the result is wrong, test against public resolvers like 1.1.1.1 or 8.8.8.8 to bypass your ISP entirely. Stale TTL (Time To Live) records often keep these errors alive longer than necessary. If a public resolver gives the correct IP but your local one doesn't, the site isn't down; your path is just outdated. You can run dig @1.1.1.1 yourdomain.com to verify the record at the source.
ISP and Regional Routing Failures
Network geography matters. A site might be perfectly accessible in Berlin but completely unreachable in New York due to congestion at a specific Internet Exchange Point (IXP). These peering issues happen when two networks fail to pass traffic efficiently. Using a VPN is a quick way to verify this. By switching your exit node to a different country, you can confirm if the issue is restricted to your local ISP. This is a common scenario when asking "is my website down for everyone or just me" during peak traffic hours.
Relying on manual checks during these moments is a recipe for alert fatigue. Implementing global uptime monitoring ensures you get a broader view of your site's health across multiple regions simultaneously. This prevents you from panicking over a localized ISP hiccup that doesn't affect your actual customer base. It's a more ethical approach to on-call management that values your team's time and reduces the stress of technical disruptions.
Verifying Global Status: Tools and Methodologies
Manual browser refreshes provide a narrow view of your site's health. When you're asking "is my website down for everyone or just me," you need data from beyond your local network to rule out ISP-specific routing issues. Synthetic monitoring solves this by executing automated checks from 10 or more global locations. If a node in London sees a 200 OK while a node in Tokyo sees a 503, you aren't looking at a total outage. Instead, you're likely facing a regional routing failure or a CDN synchronization error.
Checking public status pages is a standard step, but these are often lagging indicators. Major providers typically wait to confirm a systemic issue before updating their dashboards. Using specialized uptime monitoring tools provides a real-time heatmap of availability. This allows you to see the outage as it happens rather than waiting for a vendor to admit there's a problem. It gives you the evidence needed to communicate with your users before the support tickets start piling up.
Manual vs. Automated Status Checks
The choice between manual and automated methods involves a trade-off between cost and visibility. Manual checkers are reactive and free, but they lack the historical context needed for root cause analysis. Automated monitoring is proactive, identifying trends before they become total failures. For teams prioritizing data sovereignty, choosing a provider with specific EU or US hosting options ensures monitoring traffic complies with regional privacy standards.
| Feature | Manual Checks | Automated Monitoring |
|---|---|---|
| Accuracy | Low (Single point) | High (Multi-region) |
| Latency Tracking | None | Real-time trends |
| Regional Coverage | Limited | Global (10+ locations) |
| Cost | Free | Subscription-based |
Relying on basic checkers is risky for developers because they are prone to false positives. Multi-region website availability monitoring is the only way to confirm a backend failure with confidence. It allows you to distinguish between a total crash and a localized network hiccup that only affects a subset of your users.
Interpreting Global Response Times
Differentiating between "Down" and "Slow" is essential for effective incident response. High latency often feels like an outage to a user, but the troubleshooting steps are different. If your global heatmap shows 200 OK responses but response times have tripled, your backend is likely bottlenecked. SSL handshake times are a specific metric to watch. A sudden spike in handshake duration across all regions often indicates a failing load balancer or an overloaded SSL termination point. If you see 5xx errors consistently across multiple continents, you've moved past the "is my website down for everyone or just me" stage and into a confirmed backend failure.
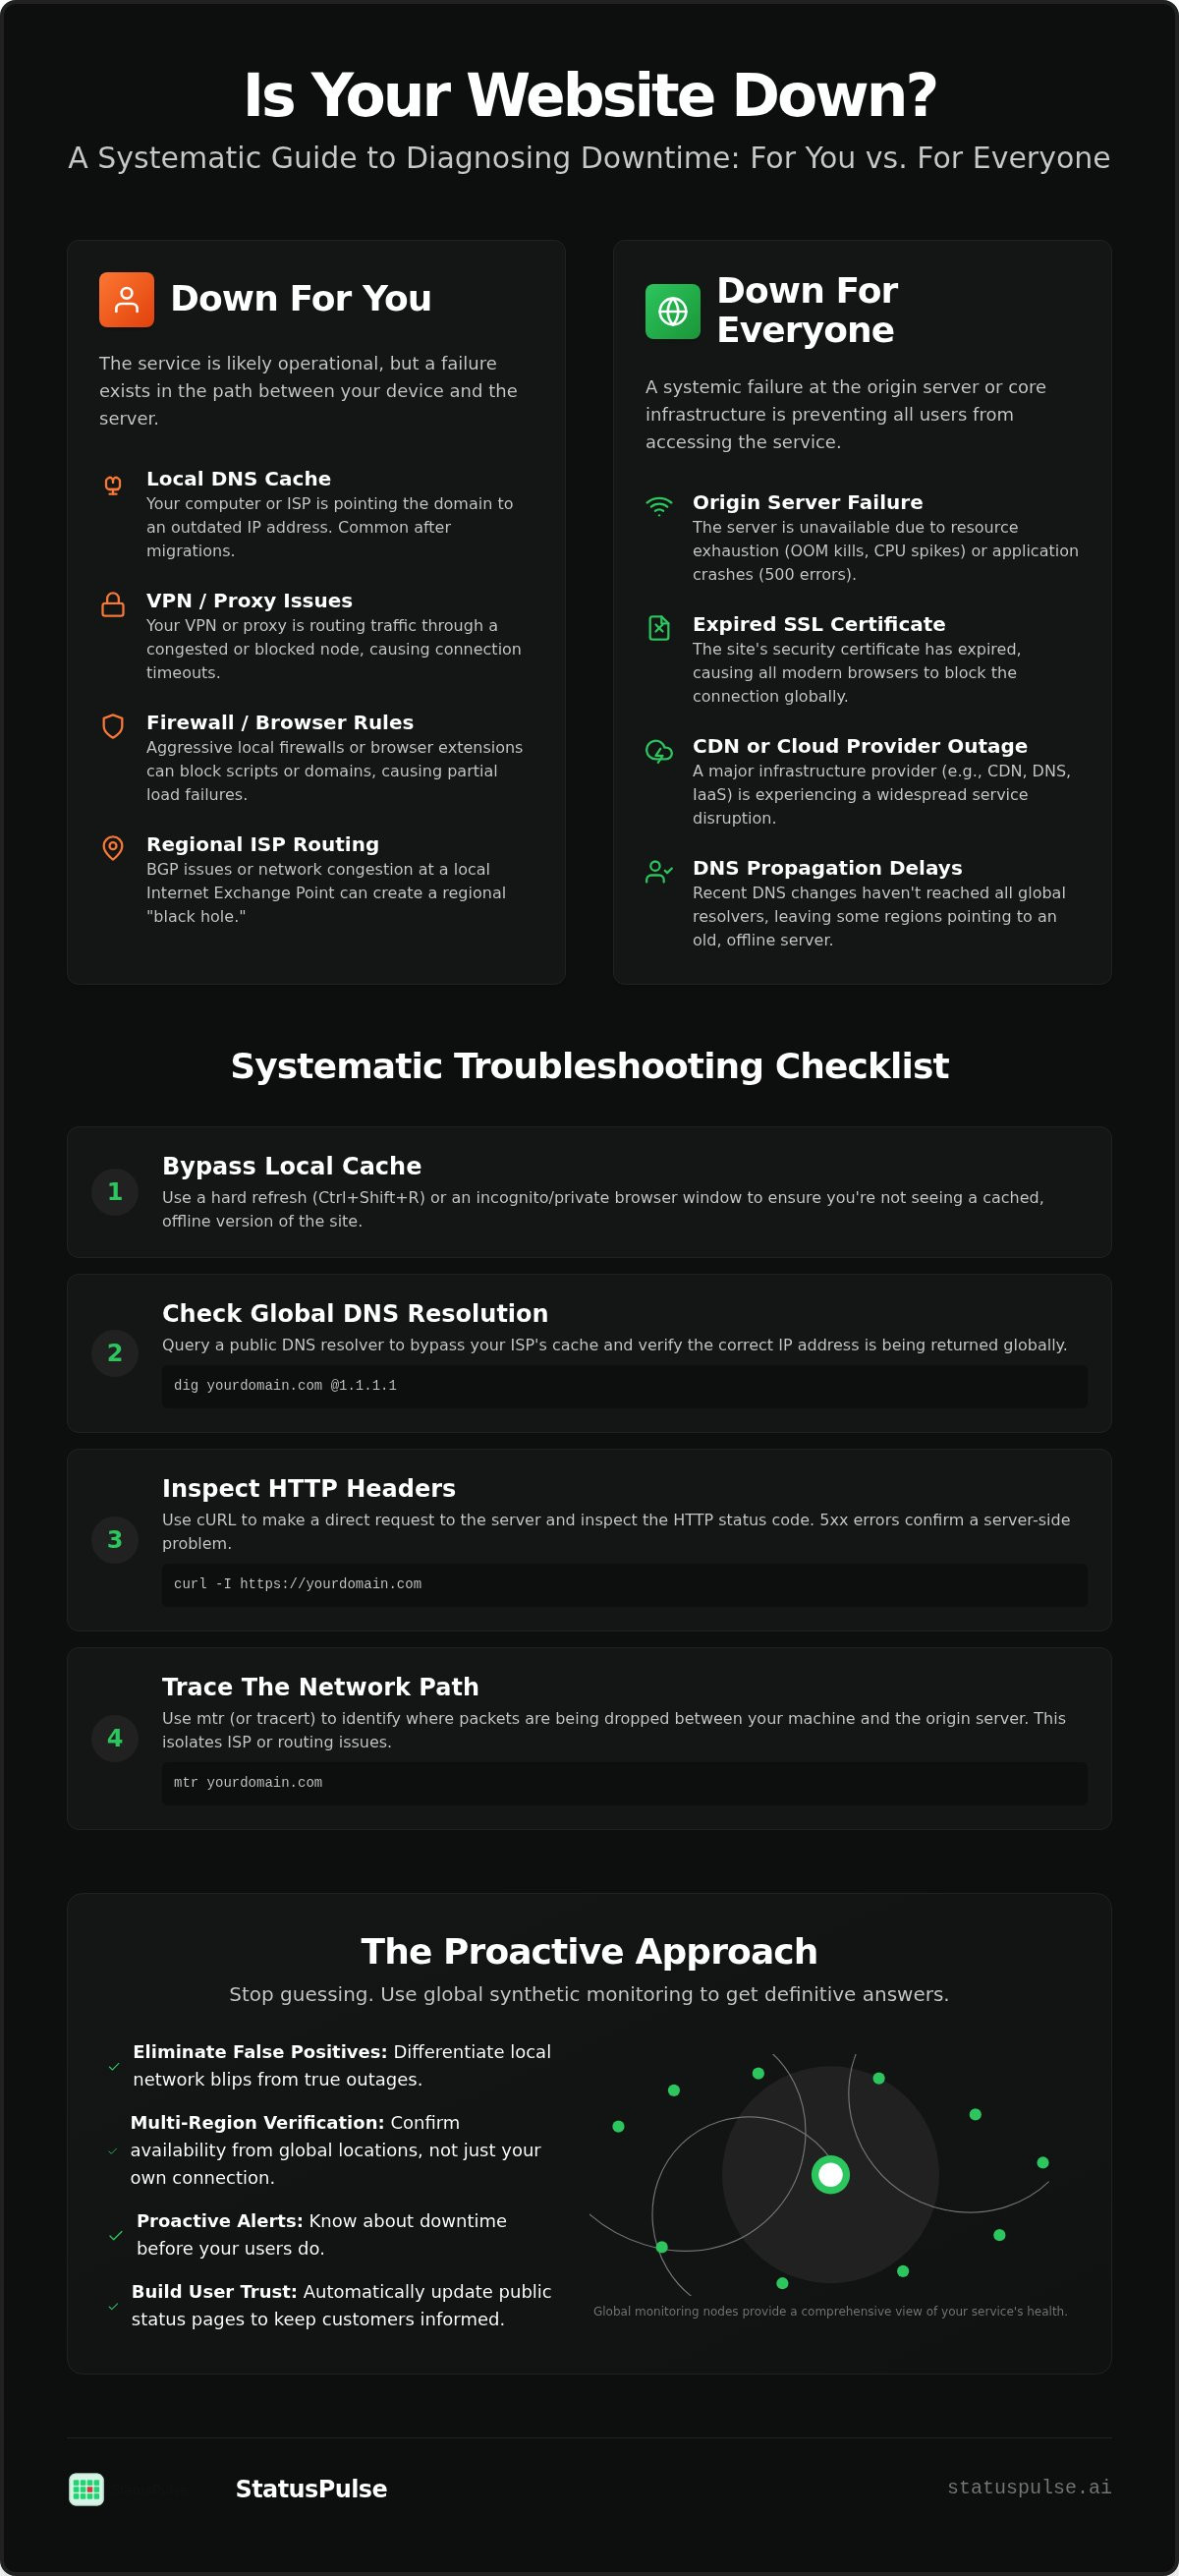
Systematic Troubleshooting Checklist for Developers
Browsers are high-level tools that often obscure the root cause of a connection failure. To determine if your site is down for everyone or just me, you must strip away the UI and test the network stack directly. A systematic approach prevents the "panic-refresh" cycle and leads to a faster resolution. Follow this sequence to isolate exactly where the request is failing.
- Step 1: Use
curl -I [URL]to inspect the HTTP headers. This verifies the server response without the overhead of rendering JavaScript or CSS. - Step 2: Run
tracerouteormtrto find where the packet is being dropped. This identifies if the failure is local, at your ISP, or at the origin. - Step 3: Flush local DNS. Use
dscacheutil -flushcacheon macOS oripconfig /flushdnson Windows to remove stale records. - Step 4: Check the public status page software of your hosting provider to see if they've acknowledged a broader infrastructure issue.
- Step 5: Verify SSL health using
openssl s_client -connect domain.com:443to rule out expired or misconfigured certificates.
Using CURL for Precise Diagnosis
The curl utility is the most reliable way to bypass browser cache and local extensions. Using specific flags allows you to measure the timing of each stage in the request lifecycle. This helps you identify if the delay is in the DNS lookup, the TCP handshake, or the server's time to first byte (TTFB).
curl -vso /dev/null -w "Connect: %{time_connect} TTFB: %{time_starttransfer} Total: %{time_total}\n" https://example.comAnalyze the output carefully. If the connection time is low but the total time is high, your server is struggling to process the request. If you suspect an SSL issue is the only thing blocking the connection, use the -k flag to ignore certificate errors temporarily. This allows you to confirm the underlying server is still reachable even if the certificate has expired.
Network Path Analysis with MTR
A standard ping only tells you if a host is reachable. It doesn't tell you where the path breaks. mtr (My Traceroute) combines ping and traceroute to provide a live view of packet loss across every hop between you and the server. This is essential when trying to figure out if a site is down for everyone or just me due to regional routing failures.
Differentiating between a local router failure and an ISP backbone issue is critical. If packet loss starts at hop 1 or 2, the problem is your office hardware. If it appears at a major exchange point, it's a peering issue. Be aware that some routers use ICMP rate-limiting. This can look like 100% packet loss at a specific hop while subsequent hops show 0% loss. In that case, the node is healthy; it's simply ignoring your diagnostic packets.
Stop reacting to outages after they've already impacted your users. You can automate these checks and provide instant transparency with an uptime monitoring platform that respects your data sovereignty and your team's time.
Proactive Monitoring with StatusPulse
By the time a developer manually asks "is my website down for everyone or just me," the damage is already done. Users have likely encountered errors, and trust has begun to erode. Waiting for a manual checker is a reactive strategy that increases Mean Time to Recovery (MTTR). Shifting to a proactive model means identifying failures before they are reported by your customer base or detected by a third-party ping tool.
Implementing server uptime monitoring with 1-minute check intervals ensures that disruptions are caught in seconds. This frequency is necessary for high-traffic applications where even a few minutes of downtime can result in significant revenue loss. StatusPulse allows you to choose between EU or US hosting to align with your specific data sovereignty requirements. This choice ensures that your monitoring metadata resides in the jurisdiction that matches your legal and privacy standards. This transparency is a core part of our mission to provide a fair and ethical alternative to bloated enterprise tools.
Automating Transparency
Public status pages act as a primary defense against support ticket spikes. When users see an acknowledged incident, they are less likely to flood your inbox with the same inquiry. Beyond basic uptime, integrating API monitoring allows you to catch silent failures, such as a broken authentication endpoint, before the frontend crashes. SSL certificate monitoring further reduces risk by sending alerts weeks before an expiry causes a global outage. These tools function as technical assistants, providing the data needed for a final human decision.
Incident Communication for Dev Teams
Effective response requires more than just a fix; it requires clear communication. The architecture of incident communication transparency focuses on delivering accurate updates without manual overhead. StatusPulse utilizes AI to draft incident summaries when a global outage is confirmed. This removes the burden of writing status updates while the engineering team is focused on remediation. Using automated alerts prevents the need for users to wonder "is my website down for everyone or just me" by providing a definitive answer on your status page.
These AI-powered summaries help non-technical stakeholders understand the impact and progress without requiring a constant stream of manual reports. It is a logical, streamlined approach to incident management that respects the developer's time. You can begin improving your reliability today by taking control of your infrastructure visibility. Build your first public status page with StatusPulse and move beyond manual troubleshooting.
Moving Beyond Manual Troubleshooting
Distinguishing between a local routing failure and a global outage is the first step toward reducing on-call stress. By using CLI tools like curl and mtr, you move past the limitations of browser cache and local DNS issues. These methods provide the technical precision required to isolate the specific network segment that is failing. Identifying whether a problem is systemic or localized prevents unnecessary panic and allows you to focus on genuine remediation.
Stop asking "is my website down for everyone or just me" only after the browser hangs. Proactive visibility is the only way to maintain trust with your users. StatusPulse provides a reliable alternative to bloated enterprise software. We offer EU and US hosting options to support your data sovereignty requirements. Our platform includes AI-powered incident management and transparent pricing with no per-subscriber fees. Stop guessing and start monitoring with StatusPulse to ensure your services remain available across every region. You have the technical checklist; now you can automate the oversight.
Frequently Asked Questions
How can I check if a website is down for everyone or just me?
Use a multi-region synthetic monitoring tool or a public status checker to verify connectivity from diverse global locations. If these tools report a successful response while your browser hangs, the issue is restricted to your local network or ISP. To answer is my website down for everyone or just me, you must bypass local caches and DNS resolvers by testing from nodes in different geographic regions.
Why is a website down for me but works on my phone?
Your phone likely uses a cellular connection that bypasses your local Wi-Fi router and ISP. This discrepancy often points to a local DNS cache issue, a misconfigured firewall, or a regional routing loop in your home network path. Switching to a mobile hotspot is a reliable way to confirm that the origin server is healthy while your primary wired connection is experiencing a localized disruption.
What is the best free tool to check website status?
While manual checkers provide quick binary results, developers often prefer CLI utilities like curl or mtr for deeper diagnosis. For automated tracking, many services offer limited free tiers for basic uptime pings. However, a professional setup requires multi-region checks and API monitoring to catch silent failures. StatusPulse provides transparent, flat pricing for teams that need reliable global visibility without the complexity of traditional enterprise models.
How do I clear my DNS cache to fix a "down for me" issue?
You can flush your local DNS cache using terminal commands specific to your operating system. On macOS, run sudo dscacheutil -flushcache; sudo killall -HUP mDNSResponder. On Windows, use ipconfig /flushdns in the Command Prompt. This forces your machine to request a fresh IP address for the domain from the authoritative nameserver, resolving issues caused by stale A records following a server migration or DNS update.
Can a VPN fix a website being down?
A VPN can resolve a "down for me" scenario if the issue is caused by a regional routing failure or an ISP-specific block. By routing your traffic through a different geographic exit node, you bypass the problematic network segment. If the origin server is crashing with a 5xx error, a VPN will not fix the outage. It serves as a diagnostic tool to verify path integrity rather than a solution for server-side failures.
How do I know if my ISP is blocking a website?
Use the mtr utility to see exactly where your connection packets are being dropped. If the trace stops at a node owned by your service provider and never reaches the public internet, your ISP may have a routing error or a specific block. Testing against public DNS resolvers like 1.1.1.1 can also reveal if the restriction is occurring at the DNS level rather than the IP level.
What does it mean if a website is down only in certain regions?
Regional outages often stem from CDN synchronization delays, BGP routing flaps, or congestion at specific Internet Exchange Points (IXPs). A site might be reachable in London but fail in Singapore if a local edge node is serving a cached error or if a transoceanic path is experiencing high packet loss. This is why testing from a single location is insufficient. You need a global availability heatmap to identify these geographic bottlenecks.
How can I get notified automatically when my website goes down?
Implementing a dedicated uptime monitoring service allows you to receive instant alerts via Slack or email when a failure is detected. StatusPulse offers 1-minute check intervals and specialized API monitoring to ensure you are the first to know about a disruption. By integrating these alerts with a public status page, you can automate transparency and reduce support volume by informing users before they encounter the error themselves.


