

It's 3 AM. Your pager goes off. You jump into a debug session only to find your site is perfectly healthy. A single monitoring node in a distant data center failed. It triggered a false alarm and cost you sleep. This is the reality of fragile alerting systems that lack consensus. Effective multi-location website monitoring shouldn't mean babysitting your tools or chasing ghosts in the machine.
You know that local testing often hides regional latency issues. Your dashboard might show green in London while users in New York face a Time to First Byte (TTFB) well over the 0.8 second benchmark. Legacy tools often make these regional insights difficult to extract. They bury them under complex configurations and opaque pricing. You need visibility that respects your time and your data sovereignty.
This guide explains how to implement a resilient global monitoring strategy that eliminates false positives. We will cover how to use consensus-based checks to ensure accuracy. You'll learn how to maintain clear visibility into regional performance and automate incident communication. The goal is a stack that remains available across all regions without the usual corporate bloat.
Key Takeaways
- Understand how multi-location website monitoring uses distributed check-nodes to catch regional outages that local testing misses.
- Eliminate false positives by implementing a consensus algorithm that requires multiple nodes to confirm a failure before alerting.
- Select the right check type—Ping, TCP, or HTTP/HTTPS—to monitor different layers of your global infrastructure effectively.
- Map your critical endpoints to specific geographic regions to align monitoring with actual user traffic patterns.
- Maintain data sovereignty by selecting monitoring nodes that comply with regional regulations like GDPR and NIS2.
What is Multi-Location Website Monitoring?
Multi-location website monitoring is a distributed system that verifies endpoint availability from multiple geographic regions simultaneously. Website monitoring usually starts with a basic uptime check from a single server. However, relying on one node to watch your site creates a dangerous blind spot. This approach provides a realistic view of how your stack performs for a global user base by simulating user requests from different networks.
Developers often fall for the "it works on my machine" fallacy. Your site might load perfectly in your local browser or from a monitoring node in the same data center. Users in a different hemisphere might see a connection timeout. Single-point monitoring is fragile; if that specific node loses its connection, you get a false alarm. Distributed monitoring requires consensus from multiple nodes. This filters out local glitches and prevents unnecessary 3 AM pages.
The Role of Regional ISP and BGP Issues
Network health is rarely uniform across the globe. BGP leaks can reroute traffic through suboptimal paths. This causes specific regions to lose access while others remain unaffected. Localized ISP congestion or routing loops can also throttle performance for specific clusters of users. These routing errors often occur at the autonomous system level, making them invisible to standard traceroute tools used in local debugging. For example, a peering dispute between two major providers in Frankfurt might break your site for German users. Your US-based monitor would report 100% uptime. You'd remain blind to a significant regional outage without regional checks.
Why Latency Variance Matters for UX
Latency is a critical component of perceived availability. Google updated its guidance in November 2025 to state that a Time to First Byte (TTFB) over 1.8 seconds is poor. If your server is in London, a user in Tokyo might experience high latency that triggers an application-level timeout. This makes the site effectively "down" for them. Research from July 2026 shows that 53% of mobile visitors will leave a page that takes longer than three seconds to load. CDN propagation delays also complicate this. Updates to your edge cache might not reach all regions at once. Using multi-location website monitoring ensures you catch these regional performance dips before they impact your conversion rates.
The Mechanics of Global Monitoring Nodes
The polling cycle is the heartbeat of any multi-location website monitoring system. Most technical teams configure checks at one-minute or five-minute intervals. Shorter intervals catch transient spikes but increase load on the target server. Each node executes these checks independently based on a central schedule. This distributed approach ensures that a single network hiccup near one node doesn't trigger a false alarm across your entire system.
ICMP vs. HTTP Checks: Choosing the Right Protocol
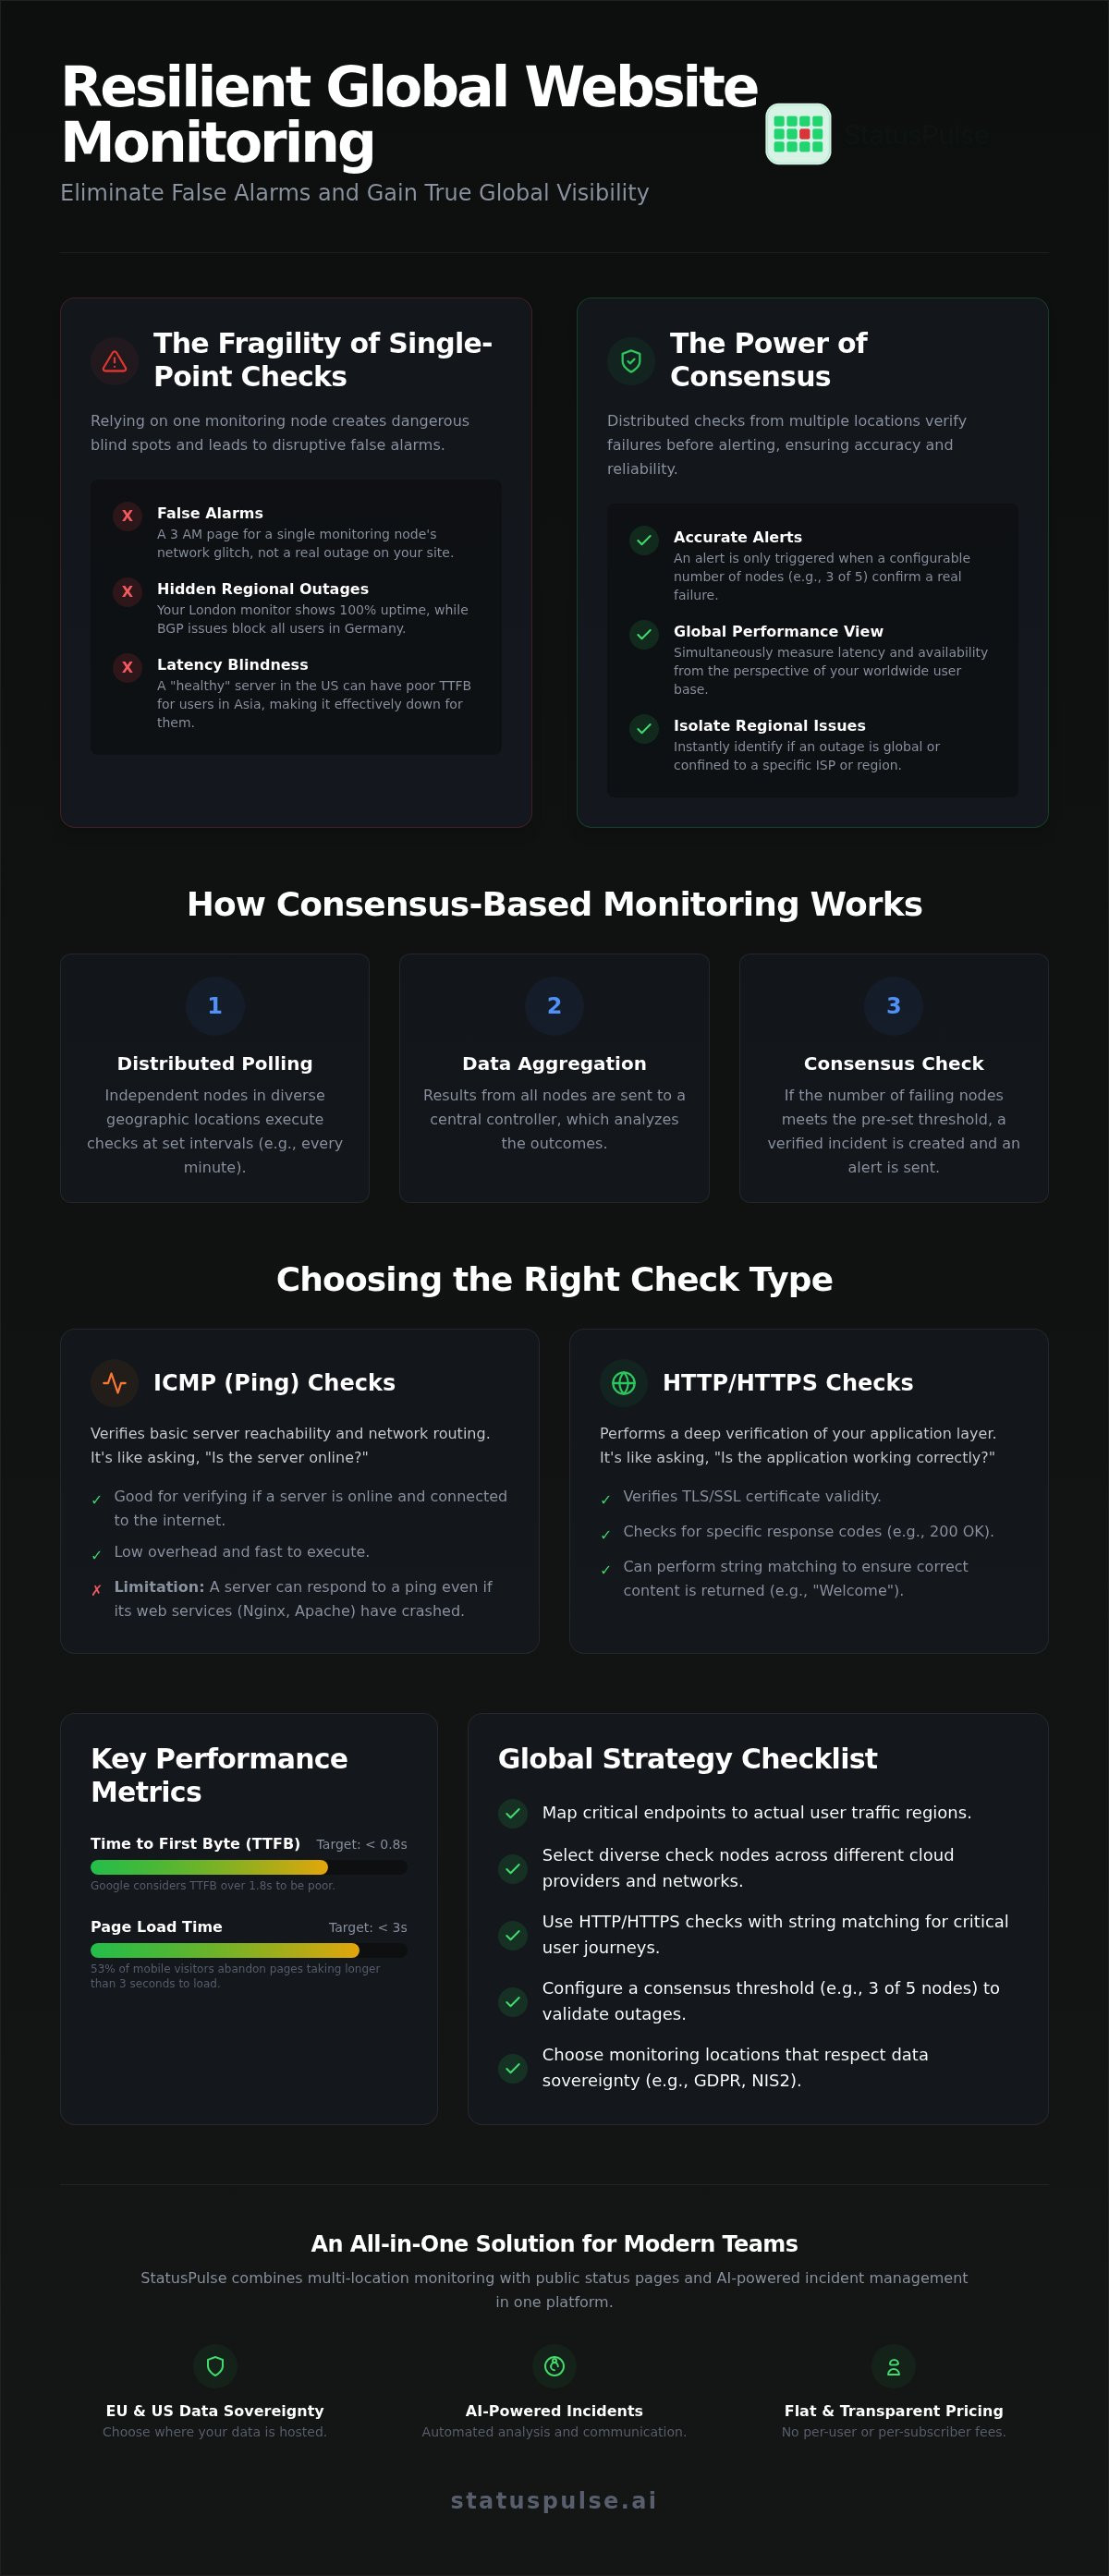
ICMP (Internet Control Message Protocol) is useful for verifying basic routing. It follows standard network monitoring principles by sending a packet and waiting for an echo reply. However, ICMP is limited. A server can respond to a ping while the web service, like Nginx or Apache, is completely crashed. HTTP/HTTPS checks go deeper. They initiate a full TLS handshake and request a specific resource. This verifies that your SSL certificate is valid and your application logic is actually functioning.
An HTTP check doesn't just look for a connection. It evaluates the response payload. You can configure nodes to look for specific status codes, usually a 200 OK. You can also perform string matching. If your database fails, your homepage might still load but display an error message. A string match for "Welcome" or "Dashboard" ensures the content is actually present. Custom headers, like a specific User-Agent, help you identify monitoring traffic in your access logs.
Distributed Polling and Node Architecture
Most global systems use a hub-and-spoke architecture. Regional nodes, the spokes, perform the heavy lifting and send results back to a central controller, the hub. This controller aggregates data to determine if an outage is regional or global. Node diversity is critical here. If all your nodes reside in a single cloud provider's region, a provider-specific backbone issue will blind your entire monitoring stack. Using a mix of data centers ensures that local infrastructure failures don't skew your global availability data.
Reliable nodes don't require massive hardware. They need stability and low-latency network paths. Most nodes run on lightweight Linux instances with optimized network stacks. The focus is on precision and consistency rather than raw processing power. If you are tired of complex setups and corporate bloat, StatusPulse offers a straightforward way to manage these global checks with high precision. It provides the technical depth you need without the unnecessary overhead found in legacy enterprise tools.
Solving the False Positive Problem with Consensus
A false positive occurs when a single monitoring node reports a failure that doesn't exist for the rest of the world. This usually happens due to local network congestion at the node's data center or a provider-specific routing glitch. If your monitoring tool alerts you based on this single data point, it's a false alarm. These glitches are common in global networking. Relying on a single source of truth is a recipe for broken sleep and wasted engineering hours.
To solve this, multi-location website monitoring relies on a consensus algorithm. Instead of trusting one node, the system polls multiple locations simultaneously. An alert only triggers if a specific number of nodes confirm the failure. This follows a scalable network monitoring architecture where data from independent sources is aggregated before any action is taken. This filtering layer is what separates professional-grade tools from basic ping scripts.
Every team faces a trade-off between alert speed and alert accuracy. If you require ten nodes to agree, your alert might be delayed while the system gathers data. If you require only one, you get noise. Most teams find a balance by setting a "Retries" threshold. A node must fail multiple times in a row, and at least one other node must confirm that failure, before the system fires a notification. This ensures the issue is persistent and global rather than a transient blip.
The 2/3 Agreement Rule
The 2/3 rule is a common standard for high-availability systems. If you have three nodes monitoring a site, at least two must report a failure to confirm downtime. Consensus is the process where independent nodes must validate a failure before notification. This approach prevents "flapping" alerts where a site appears to go up and down rapidly due to minor packet loss. StatusPulse distinguishes between node isolation and genuine downtime by cross-referencing results across its global network. If only one node is isolated, the system marks that node as unhealthy, keeping your status page green.
Reducing Alert Fatigue for DevOps Teams
False alerts carry a high psychological cost. Every unnecessary page erodes trust in your monitoring stack. SRE teams eventually start ignoring alerts if the noise-to-signal ratio is too high. This leads to alert fatigue, where a real outage might be missed because the team assumes it's just another false positive. Smart thresholds help ignore momentary network blips. Dependency monitoring also silences redundant alerts. If your core API is down, you don't need separate alerts for every service that depends on it. A well-configured system suppresses these child alerts to keep your incident response focused.
Implementing a Global Monitoring Strategy
Building a resilient monitoring stack requires a logical roadmap. You don't need to toggle every global region available. Start by mapping your actual user base to specific geographic areas. If 80% of your traffic originates in the EU, focus your resources there. Multi-location website monitoring is most effective when it mirrors real traffic patterns rather than arbitrary global coverage.
Next, define your critical endpoints. Your landing page matters for SEO, but your authentication API and checkout services are the lifeblood of your business. Categorize these by priority. This allows you to set more aggressive check frequencies for high-value services while maintaining longer intervals for static content.
Selecting Monitoring Regions
Efficiency is a technical virtue. Monitoring from a region where you have no users is a waste of resources and generates unnecessary data. Use "Home Region" nodes to monitor the health of your origin server. Deploy "Global Edge" nodes to verify performance at the points where users actually connect. This balance prevents your monitoring dashboard from becoming a cluttered mess of irrelevant metrics.
Configure your check frequency based on your Service Level Agreements (SLAs). If you promise high availability, five-minute polling is insufficient. You need one-minute resolution to catch transient issues. Finally, integrate your notification channels. Use Slack for immediate team awareness and Webhooks to trigger automated failover scripts or incident response workflows.
Defining "Up" for Your Application
A 200 OK status code is a low bar for availability. It only proves the web server is reachable. It doesn't guarantee the application logic is functioning. You must verify the response payload. Look for specific JSON keys in API responses or unique HTML strings on your frontend. If a critical database connection fails, your server might still return a 200 OK with an empty data array. String matching catches these silent failures.
Performance thresholds are equally vital. Google's 2025 guidance defines a "good" Time to First Byte (TTFB) as 0.8 seconds or less. If your TTFB exceeds 2 seconds in a specific region, your users will likely abandon the session. You can learn more about API monitoring best practices to ensure your thresholds reflect real-world user needs. To implement these technical standards without corporate bloat, set up your global monitoring strategy with StatusPulse.
StatusPulse: Global Monitoring with Data Sovereignty
StatusPulse is a technical-first platform built for specialists who value precision over corporate bloat. It provides multi-location website monitoring without the complex pricing models of industry incumbents. You get to choose where your data lives. StatusPulse offers dedicated hosting nodes in both the EU and the US. This choice supports your data sovereignty and helps meet regional compliance standards like GDPR and the UK Data (Use and Access) Act 2025.
Most monitoring tools operate as isolated silos. StatusPulse integrates uptime monitoring, API checks, and SSL tracking with public status pages. When a consensus-confirmed outage occurs, the system moves beyond simple alerting. It connects directly to your incident management workflow. This reduces the time between detecting a failure and notifying your users. It ensures your response is as fast as your detection.
Transparency Through Public Status Pages
Support tickets spike the moment a service goes dark. StatusPulse automates the transition from "Down" to "Incident Reported" on your public page. This provides a single source of truth for your users and stakeholders. You can find more detail in our guide on The Architecture of Incident Communication Transparency.
AI-assisted drafting helps you create clear, technical incident updates quickly. The AI analyzes the error logs and node data to suggest a summary. It acts as an assistant, but you maintain final human agency over every published update. This reduces the stress of manual communication during a technical disruption.
Flat Pricing and Ethical Scaling
Many competitors use per-subscriber fees that penalize you for growing your audience. We believe this is an unethical cost function. StatusPulse uses a flat pricing model. Your costs remain predictable regardless of how many users follow your status updates. This transparency builds trust and simplifies budget planning for DevOps teams. It removes the friction of managing subscriber limits during a crisis.
Honesty requires acknowledging trade-offs. If you are a massive global enterprise requiring 500+ monitoring nodes across every obscure ISP, legacy enterprise tools might be a better fit for that specific scale. However, for modern SaaS companies and agile technical teams, StatusPulse is optimized for speed and clarity. It provides the depth of multi-location website monitoring you need without the unnecessary overhead of corporate-bloated software. You get a reliable tool that respects your time and your ethics.
Build a Resilient Global Stack
Regional availability is not a luxury. It's a technical requirement for any global SaaS. By implementing a consensus-based architecture, you move past the "it works on my machine" fallacy. This ensures that your multi-location website monitoring strategy produces actionable data rather than noise. You protect your team from alert fatigue while maintaining a precise view of regional latency and ISP-specific routing issues.
Your choice of tools should reflect your technical ethics. StatusPulse offers a focused alternative to corporate-bloated incumbents by prioritizing transparency and data sovereignty. You can choose between EU or US hosting nodes to meet your specific compliance needs. With AI-powered incident management and a flat pricing model that eliminates per-subscriber fees, you can focus on resolving issues instead of managing costs. This approach keeps your stack available and your operations lean.
Monitor your global availability with StatusPulse. Reliable monitoring should be straightforward and honest. You have the tools to build a more resilient system today.
Frequently Asked Questions
What is the difference between single-location and multi-location monitoring?
Single-location monitoring relies on one server to verify your site's availability. This approach is fragile because a local network glitch at that specific node can trigger a false alarm. Multi-location website monitoring uses a distributed network of nodes to check your site from different global regions. This provides a realistic view of how your stack performs for a global user base. It prevents unnecessary pages caused by local ISP blips that don't affect your actual customers.
How many monitoring locations do I actually need?
Most technical teams find that three to five strategic locations are sufficient for a global SaaS. You should map these locations to your primary user clusters. If most of your traffic is in Europe and North America; monitoring from Asia or South America might add unnecessary noise. Focus on regions where you have high traffic volume. This ensures your monitoring data reflects the actual experience of your most valuable users and keeps your dashboard focused.
Can multi-location monitoring detect CDN issues?
Yes, it is the most effective way to catch CDN-specific failures. CDNs cache content at the edge; these edge servers can fail or serve stale data in specific regions while others remain healthy. By checking your site from multiple global nodes, you can identify when a specific Point of Presence (POP) is underperforming. This allows you to troubleshoot regional caching issues that a local check from your origin server would never see during standard testing.
How does consensus prevent false positive alerts?
Consensus requires multiple independent nodes to validate a failure before an alert is triggered. In a multi-location website monitoring setup, a single node reporting a failure is treated as a warning. The system then cross-references this with other regional nodes. If a majority of nodes agree the site is unreachable, the system confirms the outage. This logic filters out transient network congestion at a single data center. It saves your team from the stress of alert fatigue.
What is the ideal check frequency for a production SaaS?
One-minute intervals are the standard for production-grade services. This frequency provides a high-resolution view of uptime without overwhelming your server with requests. For less critical internal tools, five-minute or ten-minute intervals are often sufficient. You should align the frequency with your Service Level Agreement (SLA). If you promise 99.9% uptime, you need frequent checks to detect and resolve blips quickly. This ensures your availability metrics remain accurate and your users stay informed.
Does multi-location monitoring impact my website performance?
The performance impact is negligible for most modern web architectures. Each check is usually a single HTTP HEAD or GET request that takes only a few milliseconds to process. Unless you are running hundreds of checks per second on an underpowered server, your users will not notice any slowdown. It is a small trade-off for the security of knowing your site is available globally. You can also filter this monitoring traffic in your access logs using specific headers.
How do I handle maintenance windows in a global monitoring setup?
You should use scheduled maintenance windows within your monitoring tool to pause alerts. This prevents your status page from showing a "down" state during planned upgrades. StatusPulse allows you to define these windows in advance. The system will continue to collect data but will suppress notifications. This keeps your uptime statistics accurate. It also ensures that your public status page remains a trusted, transparent source of truth for your users while your team works on the stack.


