

A 3 AM alert wakes you up. Your dashboard shows a critical failure in Frankfurt. You check the logs and find that everything is fine. It was just a regional network blip. Choosing a global uptime monitoring service shouldn't mean babysitting your alerts or paying for "ghost" outages. Most engineers are tired of legacy tools that prioritize complexity over accuracy.
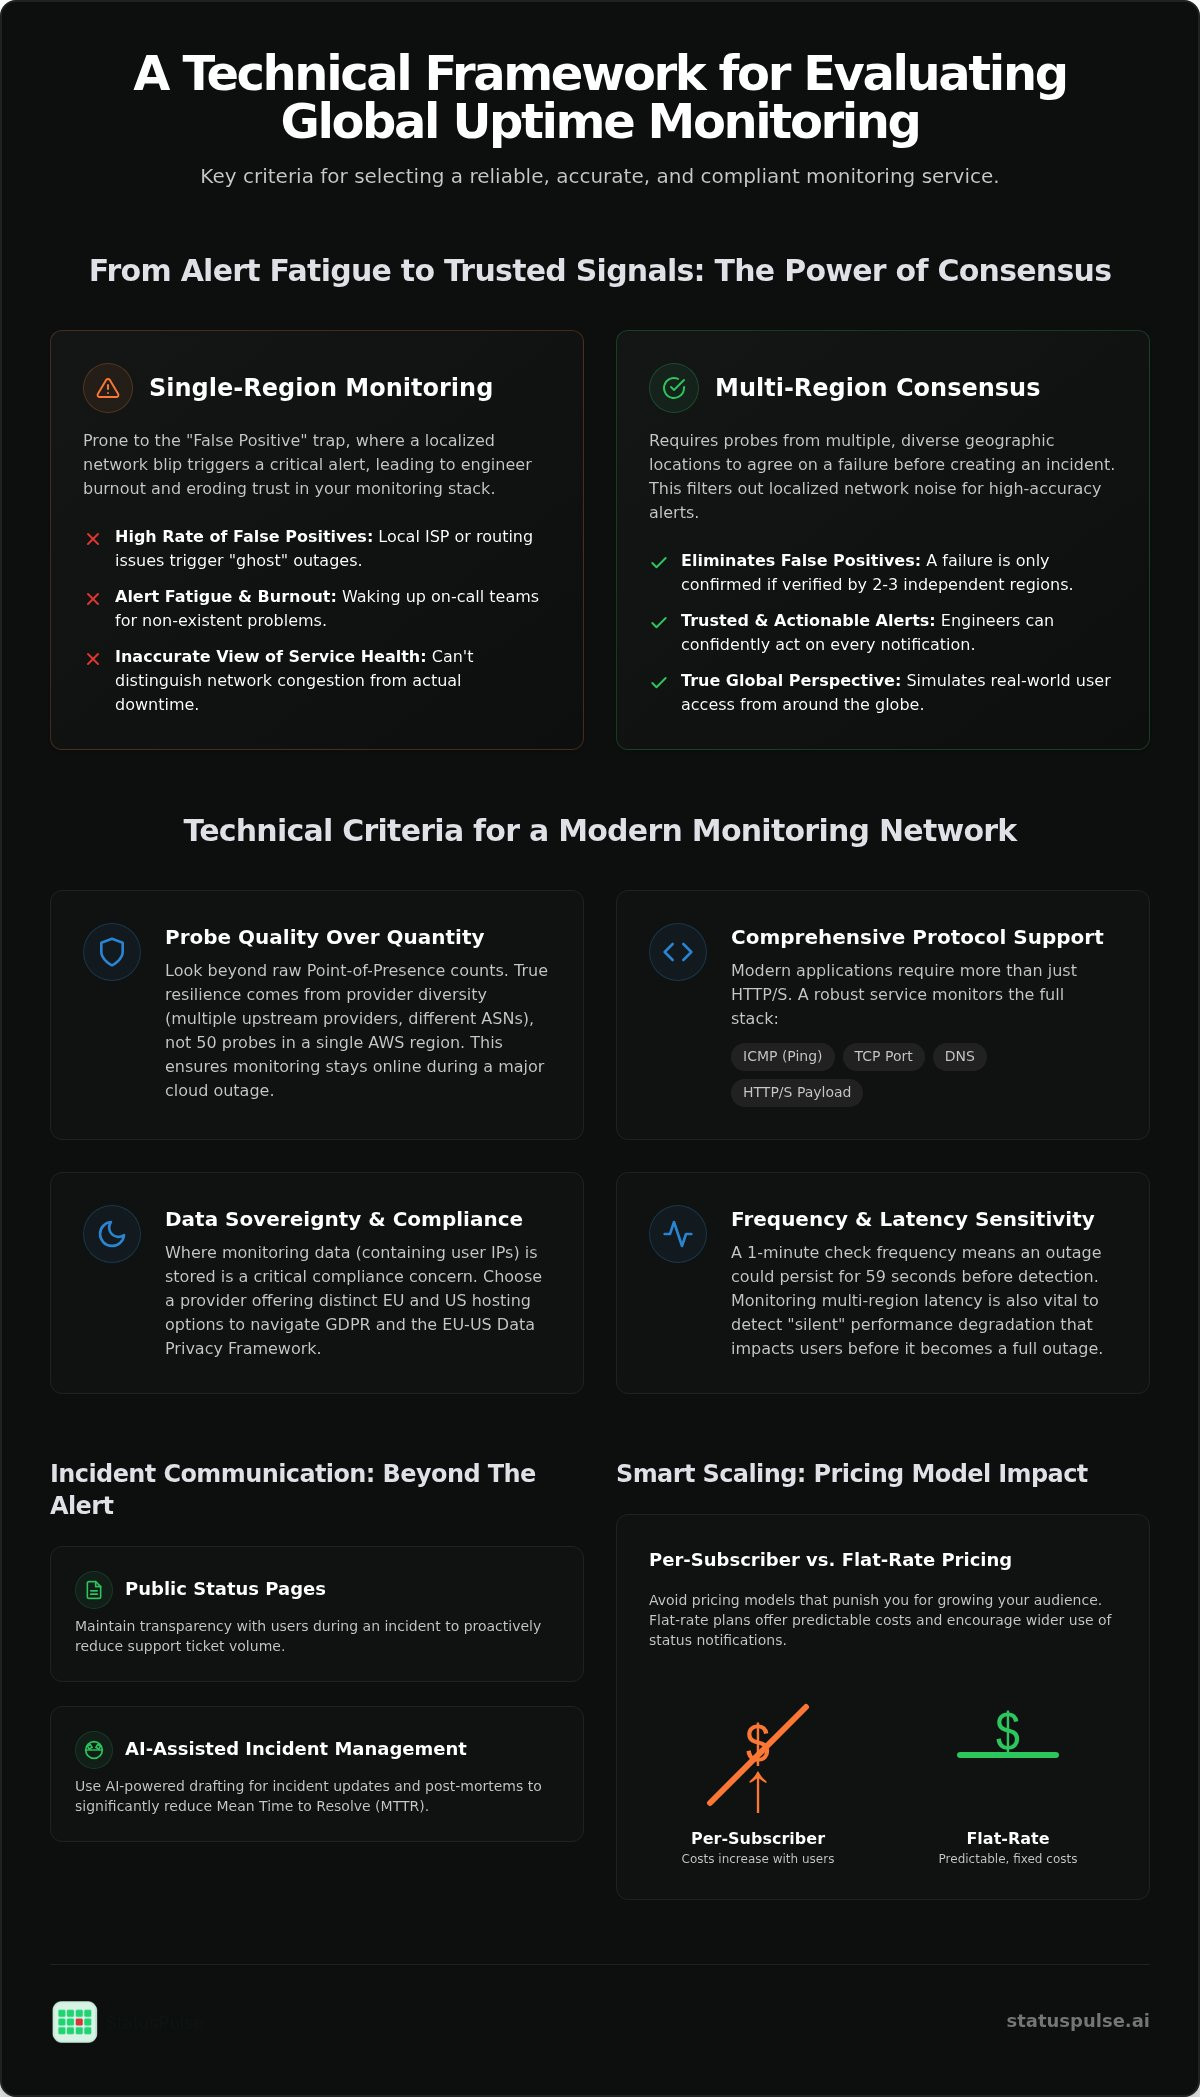
Reliable global monitoring requires multi-region consensus. This is a system where probes from different geographic locations must agree on a failure before an incident is created. This methodology eliminates the false positives that lead to alert fatigue. You likely want high reliability and predictable costs, not per-subscriber pricing models that punish you for growing your audience.
This guide provides a technical framework for evaluating monitoring networks in 2026. We will examine how to manage multi-region latency and maintain transparency during outages. You will also learn how to navigate the instability of the EU-US Data Privacy Framework following the Trump v. Slaughter decision. We'll show you how to achieve 99.99% monitoring reliability and reduce mean time to resolve (MTTR) using AI assistance.
Key Takeaways
- Learn how multi-region consensus prevents false positives by requiring multiple geographic nodes to verify a failure before triggering an alert.
- Evaluate any global uptime monitoring service by analyzing probe quality and provider diversity instead of focusing on raw point-of-presence counts.
- Navigate the complexities of data sovereignty by choosing between EU and US hosting to meet specific GDPR or regional compliance requirements.
- Reduce support ticket volume during incidents by using public status pages and AI-assisted drafting to maintain transparency with your users.
- Identify cost-effective scaling strategies by opting for flat-rate pricing models that avoid the complexity and high cost of per-subscriber fees.
The Limitations of Single-Region Monitoring
Global uptime monitoring is a network of distributed probes verifying availability from multiple geographic Points of Presence (PoPs). It moves beyond checking if a server is "up" from a single data center. Instead, it simulates real-world access from the locations where your users actually live. A reliable website monitoring strategy relies on this distributed architecture to provide a truthful view of service health.
Single-region setups are prone to the "False Positive" trap. A local ISP outage or a minor routing glitch in a single data center can trigger a critical alert. This leads to "ghost" incidents. The technical cost is high. Beyond immediate revenue loss, these false alarms cause significant developer burnout. When an on-call engineer is woken up at 2 AM for a non-existent outage, their trust in the monitoring stack erodes. This fatigue is a primary reason teams seek a dedicated global uptime monitoring service that prioritizes accuracy over raw alert volume.
Basic ICMP "ping" tests are insufficient for modern applications. A server might respond to a ping while the application layer is throwing 500 errors or failing to connect to a database. Modern stacks require more sophisticated checks that perform full HTTP/S handshakes and validate specific response payloads from multiple regions simultaneously.
Network Congestion vs. Actual Downtime
Regional routing issues, such as BGP leaks or undersea cable cuts, often mimic server outages. These events are outside your control but look like downtime to a single-region probe. This is why consensus is critical. A failure should only be confirmed if it's verified by at least 2 or 3 other independent regions. Consensus-based monitoring is a mechanism to reduce alert fatigue by filtering out localized network noise. It ensures that you only wake up your team when the service is truly unreachable for a significant portion of your users.
The Impact of CDN Caching on Monitoring Accuracy
CDNs can hide origin server failures. If an edge location has a cached version of your homepage, a monitor might report a successful status even if your database is down. Global probes must bypass these layers to see the truth. Using headers like Cache-Control: no-cache or unique query strings ensures you're testing the origin. There's a technical trade-off here. You must decide between monitoring the end-user experience, which includes the CDN, or monitoring the raw infrastructure health. Most high-performing teams do both.
Technical Criteria for Evaluating a Global Monitoring Network
Evaluating a global uptime monitoring service requires looking past raw node counts. Marketing materials often highlight hundreds of locations. However, probe quality matters more than density. If a provider hosts 50 nodes in a single AWS region, a localized AWS outage will trigger 50 alerts simultaneously. True diversity comes from using multiple upstream providers across different ASNs. This ensures your monitoring remains active even if a major cloud provider experiences a regional failure.
Protocol support is another differentiator. Your stack needs more than basic HTTP/S checks. ICMP (ping) is useful for network layer health, while TCP port monitoring helps verify specific services like databases or mail servers. DNS monitoring is often overlooked but essential. If your DNS records are hijacked or misconfigured, your site is effectively offline regardless of server health. A comprehensive global uptime monitoring service should include native tracking for all these layers.
Data sovereignty is now a primary technical requirement. The legal stability of the EU-U.S. Data Privacy Framework is currently under scrutiny following the 2026 Trump v. Slaughter decision. If you choose US-based hosting, you must also navigate a patchwork of 20 different state-level privacy laws that went into effect as of January 1, 2026. Since monitoring logs often contain user IP addresses, where your monitoring provider stores its data is a compliance concern. Many European teams now prefer providers that offer dedicated EU hosting to simplify GDPR requirements.
Frequency and Latency Sensitivity
Check frequency affects your reported SLA. A 1-minute check frequency means an outage could persist for 59 seconds before your system even attempts a verification. For businesses with strict SLAs, this delay is unacceptable. Monitoring multi-region latency is equally important. It helps detect "silent" performance degradation where the site is up but painfully slow for users in specific geographies. This data is vital for optimizing CDN routing or identifying underperforming regional ISP peers.
The Importance of Native SSL and API Checks
Uptime is about more than a 200 OK status code. SSL certificate monitoring is a critical subset of availability. An expired certificate or a configuration error will trigger "Connection Not Private" warnings, which are effectively downtime for your users. Automated tracking ensures you catch these issues weeks before they cause a service interruption.
API monitoring must go deeper than basic connectivity. You need to validate JSON response payloads to ensure the data is correct, not just present. Validating specific keys or values prevents a scenario where your API returns a 200 status but an empty or corrupted body. For a deeper look at these requirements, see our API Monitoring: The Developer’s Guide. If you need a platform that integrates these technical checks into a single dashboard, consider evaluating an all-in-one monitoring tool that balances precision with simple pricing.
Data Sovereignty: EU vs. US Hosting for Monitoring
Choosing a global uptime monitoring service is no longer just a network latency decision. It's a legal one. The invalidation of Privacy Shield and the introduction of the US Cloud Act have fundamentally changed how European teams handle monitoring data. If your monitoring provider is based in the US, your server logs and probe metadata fall under US jurisdiction. This can create friction with strict GDPR requirements, especially for financial or healthcare services.
There is a common belief that hosting your monitoring dashboard in the same region as your origin server improves detection speed. This is a myth. Uptime monitoring is inherently distributed. The location of the dashboard doesn't impact the speed of the probes. However, the location of the database where those results are stored is critical for data residency. US-based services often provide a higher density of local PoPs but may default to broader data collection. EU-based services prioritize stringent privacy and local data storage.
Compliance Requirements for SREs
SREs must identify where monitoring metadata like IP addresses and request logs are stored. Even "anonymous" monitoring requests contain metadata that can be classified as PII. The current EU-U.S. Data Privacy Framework aims to bridge this gap. However, its legal stability is currently under threat following the 2026 Trump v. Slaughter decision. Because of this uncertainty, StatusPulse offers a choice between EU and US hosting. This allows teams to pin their data to a specific jurisdiction that matches their internal compliance posture.
Privacy-First Monitoring Architecture
Building a privacy-first stack requires more than just picking a region. You should configure your probes to minimize PII in monitoring logs. This includes stripping user-specific headers and using dedicated IP ranges for your probe network. Following a framework for Information Security Continuous Monitoring (ISCM) helps ensure availability checks don't become a security liability. Using fixed IP addresses for your global uptime monitoring service allows you to whitelist probes in your firewall. This reduces the risk of skewing your security logs with thousands of external requests. It also prevents your WAF from blocking legitimate health checks during a traffic spike.
Incident Communication: Beyond the Alert
Detecting a failure with your global uptime monitoring service is only the first step of incident response. If your team is aware of an outage but your users are not, the support desk will be overwhelmed with duplicate reports. This gap between detection and communication is where trust is often lost. Silence during a service disruption suggests a lack of control, whereas a proactive update signals professional competence.
Transparency is a powerful retention tool. Users are generally forgiving of technical failures if they receive honest, timely updates. Providing a public view of your system health proves that you are in control of the situation. It shifts the perception of your brand from a faceless corporation to a disciplined team of specialists. This grounded approach to communication prevents customer churn by treating users as informed peers rather than passive observers.
The Architecture of a Status Page
A professional status page should go beyond a simple "All Systems Operational" banner. It requires component-level granularity so users can see exactly which services are affected, such as the API, the dashboard, or the CDN. Historical uptime charts provide proof of reliability over time. This is essential for enterprise customers who need to verify their SLAs without digging through private logs.
Manual status updates are slow and error-prone during a crisis. Integrating your global uptime monitoring service directly with your status page ensures that incident logs are created the moment a failure is confirmed by multiple regions. This automation reduces the stress on the on-call engineer. For a technical breakdown of these systems, read our guide on The Architecture of Incident Communication Transparency.
AI-Assisted Incident Management
Outages are high-pressure events. Drafting a clear explanation of a complex infrastructure failure for a non-technical audience is difficult when you're also trying to fix the root cause. AI can assist by drafting these summaries based on the raw error logs and monitoring data. It helps translate a "database connection pool exhaustion" into a readable status update for your customers.
Human agency remains a core virtue in this process. We recommend a human-in-the-loop approach where AI drafts the content but a specialist performs the final review. AI shouldn't post to status pages automatically. Automated posts often feel clinical or miss the specific nuance of the incident. A final human action ensures the tone remains appropriate and the facts are correct.
Effective updates focus on the "what" and "when" rather than generic apologies. Users want to know what is broken and when it will be fixed. By stripping away corporate bloat and using AI as a drafting assistant, you can maintain a fast-paced communication rhythm. If you need a tool that combines monitoring with automated drafting, evaluate our AI incident management features to streamline your response.
Building a Reliable Stack with StatusPulse
Consolidation reduces complexity. It's that simple. By housing your uptime monitoring, API checks, and status pages under one roof, you eliminate the friction of data silos and fragmented alerting. StatusPulse provides a unified global uptime monitoring service that handles the heavy lifting of multi-region verification. This ensures that your status page reflects the actual state of your infrastructure without manual intervention during a crisis.
Setting up your first global check takes less than five minutes. You'll begin by entering your endpoint URL and selecting your preferred probe regions. From there, you'll configure the consensus rules. StatusPulse requires multiple geographic nodes to verify a failure before it triggers an incident. This technical safeguard is what eliminates the false positives discussed earlier in this guide. You can also enable SSL certificate monitoring at this stage to track expiry dates automatically.
Flat Pricing vs. Per-Subscriber Bloat
Legacy enterprise tools often use pricing models that penalize your success. While an incumbent might start at [VERIFY: competitor X price], many charge additional fees for every status page subscriber or integration. This per-subscriber bloat makes costs unpredictable as your SaaS grows. We believe this is an unethical approach to infrastructure tools. StatusPulse uses a flat-rate model with no per-subscriber fees, ensuring your monthly bill remains predictable regardless of how many customers follow your updates.
Integrations shouldn't be a luxury feature. Your monitoring stack needs to communicate with Slack, PagerDuty, and custom webhooks to be effective. We provide unlimited integrations across all tiers because we value human agency. These tools act as assistants that deliver the data you need to take the final human action required to resolve an incident. You don't have to choose which team members get alerts based on a seat-based budget.
Next Steps for DevOps Teams
Start by auditing your current monitoring frequency. If you're still running 5-minute checks from a single region, you're likely missing intermittent failures and regional routing issues. Moving to a distributed 1-minute check frequency provides the granularity needed for modern SLAs. You should also verify where your monitoring data is stored to ensure it aligns with your regional compliance requirements for 2026.
Migrating your status pages doesn't have to mean losing your historical uptime data. Most teams can transition their existing components and incident logs to a more transparent platform in a single afternoon. If you're ready to move away from corporate bloat and toward a more principled monitoring stack, you can start monitoring your global uptime with StatusPulse today. Focus on precision, maintain your data sovereignty, and keep your costs flat as you scale.
Future-Proofing Your Availability Strategy
Reliable uptime in 2026 isn't about collecting the most alerts. It's about filtering the noise through multi-region consensus and maintaining data sovereignty. You've seen how single-region checks fail and why technical teams are moving toward EU-based hosting to simplify compliance. A modern global uptime monitoring service must provide technical depth without the unnecessary complexity of legacy enterprise tools.
Integrity in pricing and transparency in communication are no longer optional. By choosing a platform that offers AI-assisted incident drafting and a choice between EU or US hosting, you can focus on resolving issues rather than managing your monitoring stack. You don't have to deal with per-subscriber fees that penalize your growth. If you're ready to build a more resilient and ethical monitoring environment, you can start your 14-day trial of StatusPulse. Take control of your infrastructure health today.
Frequently Asked Questions
What is a global uptime monitoring service?
A global uptime monitoring service is a network of distributed probes that verify the availability and performance of a website or API from multiple geographic locations. It simulates real-world user access across different continents. This setup ensures that your service is reachable globally, not just from your local data center. It helps identify regional outages, ISP routing issues, or CDN failures that a single-region check would miss.
How do I prevent false positives in multi-region monitoring?
You prevent false positives by implementing a consensus-based monitoring architecture. Instead of alerting on a single failure, the system requires two or more geographic regions to confirm the outage simultaneously. This filters out localized network blips or ISP-specific congestion that doesn't represent a true service failure. By requiring agreement between probes, you reduce alert fatigue and ensure your on-call engineers only respond to verified incidents.
Is EU-based monitoring better for GDPR compliance?
EU-based monitoring is often preferred for GDPR compliance because it ensures that monitoring metadata, such as IP addresses and request logs, remains within European legal jurisdiction. This avoids the complexities of the EU-US Data Privacy Framework and the potential reach of the US Cloud Act. For teams handling sensitive data, choosing a provider with dedicated EU hosting simplifies data residency audits and aligns with the principle of data sovereignty.
Can I monitor private APIs with a global service?
Yes, you can monitor private or internal APIs by whitelisting the dedicated IP ranges used by your monitoring provider's probe network. This allows the probes to bypass your firewall while keeping the endpoint closed to the general public. You can also use custom headers or secret tokens in your monitoring requests to authenticate the probes. This ensures your global uptime monitoring service can validate the health of your internal infrastructure securely.
How much does a global uptime monitor cost?
Costs vary significantly between providers. Legacy enterprise tools often use complex pricing models based on the number of seats or status page subscribers. This can lead to unexpected bills as your audience grows. StatusPulse uses a transparent, flat-rate pricing model that includes unlimited integrations and subscribers. This approach is more ethical for growing SaaS companies. It allows you to scale your monitoring without worrying about per-subscriber bloat or hidden fees.
What is the difference between uptime and availability?
Uptime refers to the binary state of your server being powered on and running. Availability is a broader metric that measures whether a user can successfully complete a specific action, such as logging in or making an API call. A server might be "up" while the application is "unavailable" due to database failures or network routing issues. High-performing teams focus on availability by using sophisticated checks that validate response payloads.
Why do I need a public status page if I have internal alerts?
Internal alerts notify your team, but a public status page informs your customers. When an outage occurs, users will naturally flood your support desk with duplicate tickets. A status page serves as a single source of truth that reduces this volume by proactively communicating the incident status. Transparency during a failure builds trust and prevents customer churn. It proves you are aware of the issue and are actively working toward a resolution.
How does AI incident management work in StatusPulse?
AI incident management in StatusPulse functions as a drafting assistant for technical teams. During an outage, the system analyzes raw error logs and monitoring data to generate a concise summary of the technical impact for non-technical stakeholders. We maintain a human-in-the-loop requirement. This means a specialist must review and approve the AI-generated draft before it's posted to your status page. This process ensures accuracy while saving valuable time during high-stress incidents.


