

You wake up to a Slack channel overflowing with unread messages because an SSL certificate expired at 3:00 AM. It's a preventable disaster that erodes user trust and drains your engineering team. We've all been there. Managing distributed systems often feels like waiting for the next silent API failure to trigger a support spike you aren't prepared to handle. Establishing a Zero Surprises operational policy is the only way to break this cycle.
You can eliminate these technical blind spots by combining automated monitoring with a direct approach to transparency. In this article, we'll outline a strategy to build a reliable uptime monitoring stack and automated incident communication. We'll also look at maintaining compliance with EU and US data sovereignty standards. You'll learn how to transition from reactive firefighting to a controlled, proactive environment that respects both your team's time and your users' expectations.
This proactive philosophy isn't just for infrastructure; for managing the people behind the code, Humae provides an AI-powered HR platform that streamlines workforce management for modern teams, ensuring that your human resources are as resilient as your technical ones.
Key Takeaways
- Establish a Zero Surprises operational policy by automating visibility into technical blind spots like SSL chain validity and API schema changes.
- Differentiate between fundamental monitoring and complex observability to focus your team's resources on the most impactful reliability metrics.
- Implement a proactive communication cadence using public status pages to build user trust and lower support overhead during service disruptions.
- Leverage AI-driven incident management to draft technical updates that are honest, precise, and human-centric.
- Ensure regulatory compliance by selecting monitoring infrastructure that supports specific EU or US data sovereignty requirements.
The Anatomy of a Technical Surprise: Why Uptime Monitoring Fails
A Zero Surprises policy isn't about achieving 100% uptime. That's a statistical impossibility. Instead, it's a commitment to ensuring that the first person to know about a system failure is never your customer. In the context of Site Reliability Engineering (SRE), this means aligning your monitoring stack with actual user experiences rather than just infrastructure health. When your dashboard shows green but your users see errors, you've failed the most basic test of reliability; in such cases, having a simplified reporting mechanism like FeedbackGraph allows users to instantly flag issues that automated systems might have missed.
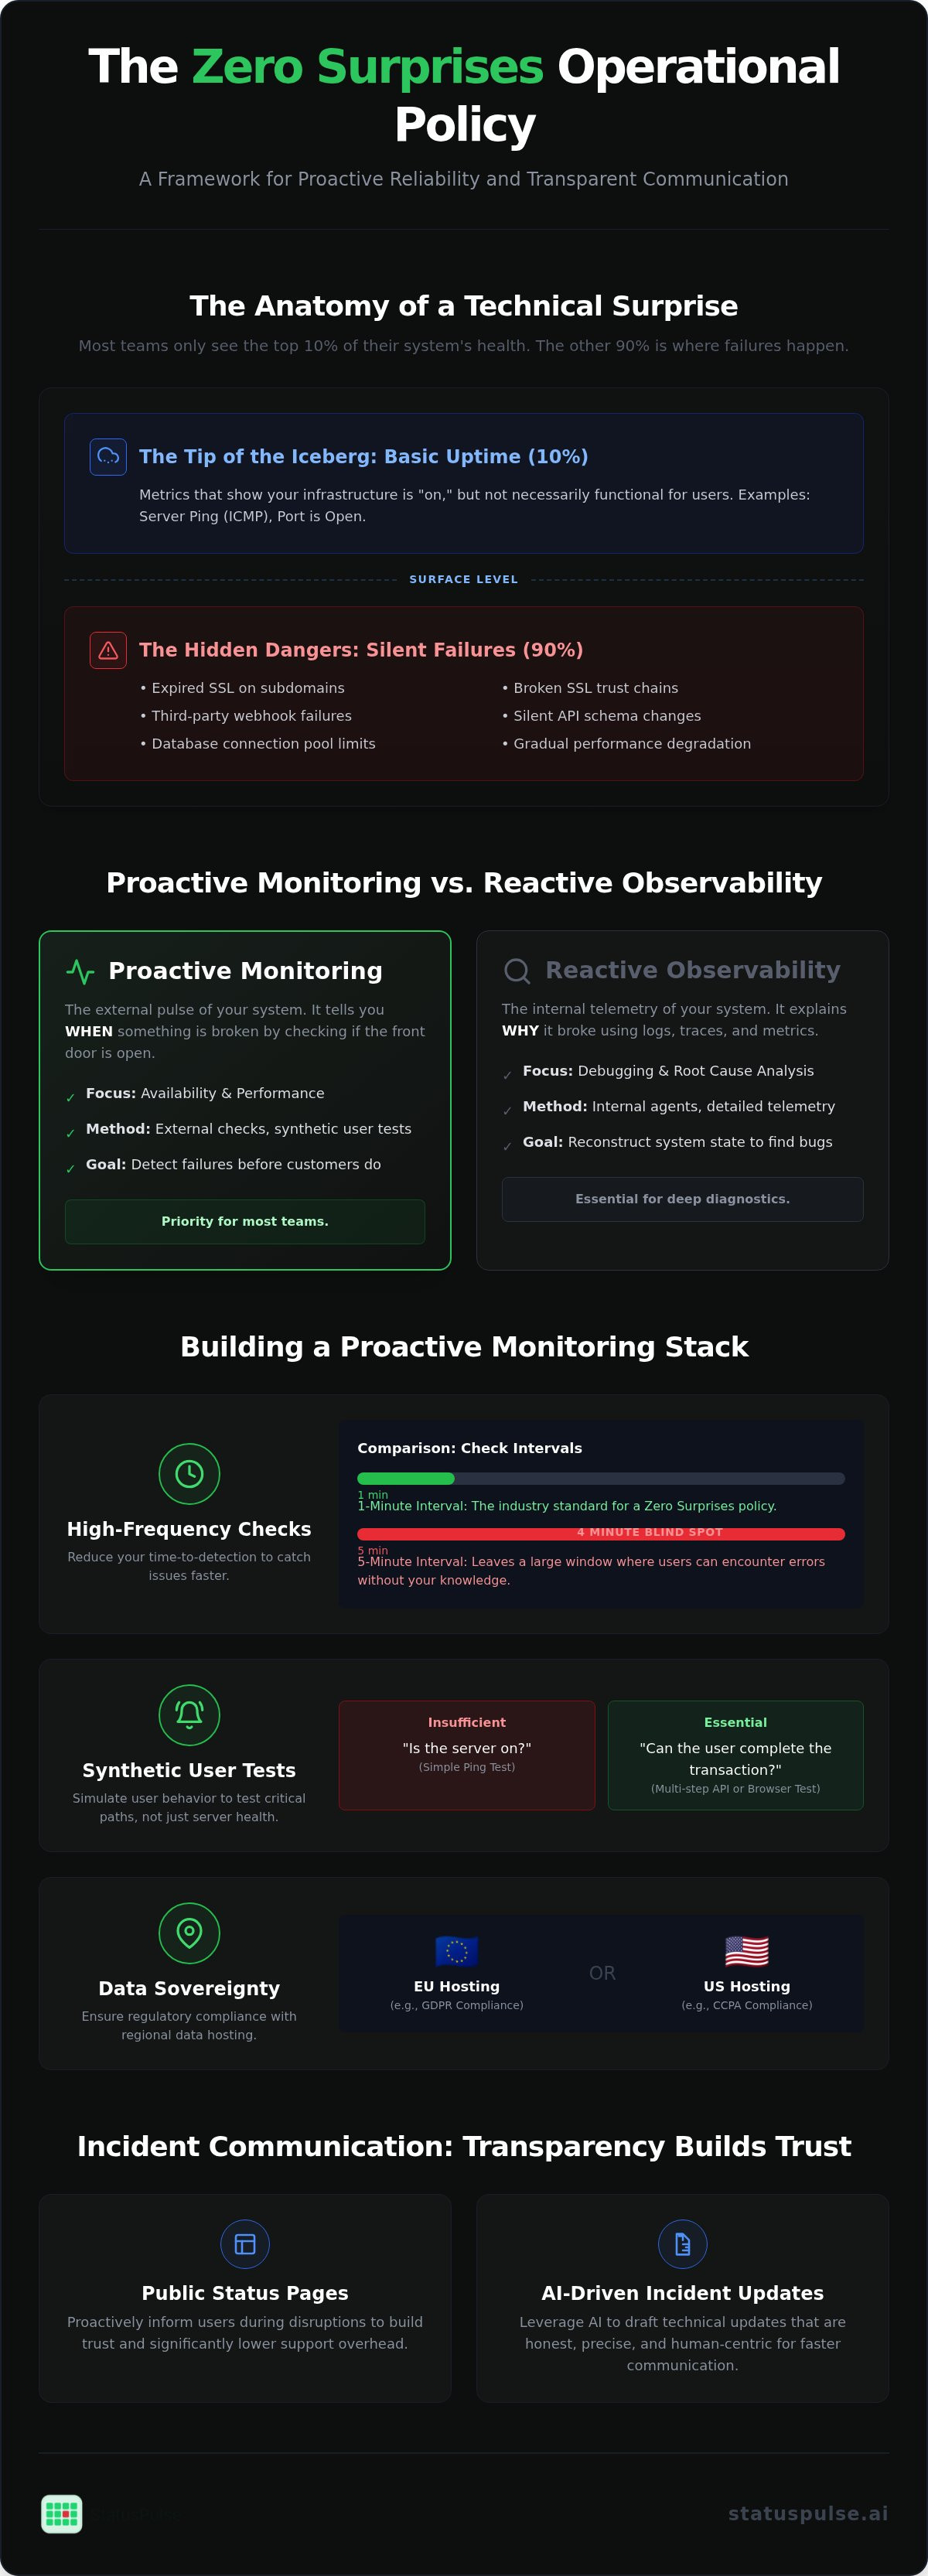
Most technical teams suffer from the "Iceberg of Ignorance." You see the top 10% of your system health: the server is powered on and the port is open. But 90% of failures happen in the shadows. These include database connection pools hitting their limits, third-party webhooks failing silently, or expired certificates on subdomains you've forgotten. When these issues go uncommunicated, the damage to brand equity is far greater than the downtime itself. Silence suggests a lack of control. Effective Incident Management starts with visibility. Moving to a proactive visibility stack ensures that your team is alerted before the support tickets start piling up.
The Three Pillars of Operational Surprises
SSL certificate traps are classic surprises. It's rarely just about the expiration date; broken trust chains or deprecated cipher suites can lock users out even if the date is valid. Silent API failures are equally dangerous. A service might return a 200 OK status code while delivering an empty JSON payload or a malformed schema. Finally, latency creep acts as a silent churn driver. If a page load moves from 500ms to 5 seconds, your dashboard might stay green, but your business is effectively down.
Why Traditional Check-Based Monitoring is Not Enough
Simple ping tests are insufficient for modern distributed systems. A server can respond to an ICMP request while the application layer is completely unresponsive. You need to tune alert sensitivity to find the balance between alert fatigue and missing critical events. Synthetic monitoring is a proactive simulation of user behavior designed to test critical paths before real users encounter errors. By shifting your focus from "is the server on?" to "can the user complete the transaction?", you move closer to a true Zero Surprises environment.
Proactive Monitoring vs. Reactive Observability
Monitoring and observability are often used interchangeably, but they serve different functions in a Zero Surprises strategy. Monitoring is the external pulse of your system. It tells you when something is broken by checking if the front door is open. Observability is the internal telemetry that explains why it broke, using logs, traces, and metrics to reconstruct the state of the system. For most teams, knowing exactly when a service fails is more urgent than having a high-resolution trace of the failure itself.
Small teams should prioritize robust monitoring before investing in complex observability suites. High-end observability tools often introduce significant "tool sprawl," requiring multiple dashboards and specialized training to interpret. A pull-based monitoring architecture is often superior for external uptime. In this model, an external agent periodically requests your endpoint, mimicking actual user behavior. This provides a clean, objective view of availability that push-based systems, which rely on the application itself to report health, can sometimes miss during a total process hang.
Establishing a baseline is the first step toward proactive visibility. You must define "normal" for your specific stack by measuring the 95th percentile of response times over a seven-day period. Anything outside this range should trigger a warning before it escalates into a full outage. This data-driven approach ensures your alerts are grounded in reality rather than arbitrary thresholds.
Comparison: Monitoring Stacks for Small vs. Large Teams
Large enterprises often tolerate fragmented dashboards, but for smaller teams, this creates a dangerous "Iceberg of Ignorance." Managing five different tools leads to alert fatigue and missed signals. Ethical pricing also matters. Usage-based models can lead to "pricing surprises" when a traffic spike occurs. Choosing a flat-rate platform ensures your costs remain predictable. Additionally, you should consider data sovereignty. Whether you require EU or US hosting, your monitoring data should reside in a region that aligns with your legal and privacy requirements.
Avoiding fragmented data is a universal challenge; in the education sector, Rise addresses this by offering a unified platform for tracking student performance and activity through a real-time dashboard, ensuring educators have a single source of truth.
The Role of 1-Minute Uptime Checks
Checking your site every five minutes leaves a four-minute blind spot where users can encounter errors without your knowledge. A 1-minute check interval is the industry standard for a Zero Surprises policy. You should also configure multi-region checks. This helps distinguish between a global outage and a localized ISP routing issue. Following established server uptime monitoring practices ensures your team stays ahead of regional disruptions.
Just as the National Incident Management System (NIMS) provides a standardized framework for physical emergency response, technical teams need a consistent structure for digital incidents. Implementing a straightforward tool like StatusPulse allows you to consolidate your monitoring and communication into a single, logical workflow.
Eliminating Silent Killers: SSL and API Monitoring
Basic uptime checks often miss the nuanced failures that lead to a Zero Surprises policy violation. Your server might be reachable, but if the SSL certificate has a broken trust chain or your API returns an empty JSON object, the user experience is effectively dead. These "silent killers" bypass simple ping tests because they occur at the application and presentation layers rather than the network layer. Automating domain expiry lookups is also necessary to prevent catastrophic "site not found" errors that occur when a registrar's auto-renew fails or a credit card on file expires.
A 200 OK status code is a low bar for reliability. True API health requires validating that the response body matches your expected schema and that the transaction completes within an acceptable latency window. By moving beyond binary up/down checks, you ensure that your monitoring stack reflects the actual health of your business logic.
SSL Certificate Health Checklist
SSL monitoring must go deeper than checking the expiration date. You need a system that validates the entire certificate chain to ensure intermediate certificates are correctly installed. This prevents errors on mobile browsers that are often less forgiving than desktop versions. Your alerting thresholds should be tiered: notifications at 30 days provide time for procurement, while 14 and 7-day alerts serve as urgent escalations for the engineering team. A mismatched SSL SNI configuration often results in the server serving the wrong certificate for a specific hostname, causing browser security warnings despite a valid certificate being present on the server.
Advanced API Monitoring Strategies
Synthetic API probes allow you to simulate complex user journeys. For authenticated endpoints, your monitor should perform a multi-step handshake: first requesting an OAuth token, then using that token to query a protected resource. Configuration for a robust synthetic probe should include specific JSON schema assertions. For example, your monitor shouldn't just check for a 200 status; it should verify that response.body.data.items is an array and that its length is greater than zero. This level of API monitoring is what allows teams to maintain 99.99% availability.
Monitoring third-party dependencies is equally critical. If your checkout page relies on an external payment gateway, you should monitor that gateway's endpoint directly. This prevents your team from being blamed for an outage that is outside your control. When you can point to a failed synthetic probe on a third-party service, you maintain a Zero Surprises environment by providing immediate, accurate context to your stakeholders and customers.
For businesses in the car rental sector looking to apply similar proactive oversight to their pricing, they can explore RateMonitor Elite to automate rate monitoring and maintain a Zero Surprises approach to their margins.
Incident Communication: Transparency as a Reliability Strategy
Incident communication is the final step in closing the visibility gap. While the previous sections focused on detecting failure, this section focuses on managing the human impact of that failure. A Zero Surprises policy requires that you communicate before the user has to ask. Transparency is a reliability strategy because it shifts the narrative from "the system is broken" to "the team is in control."
Public status pages are the front line of customer trust. When an outage occurs, users want immediate confirmation that you're aware of the issue. Providing this information through automated status alerts can reduce support ticket volume by 40%. This allows your engineering team to focus on resolution rather than answering redundant queries. Maintaining a Zero Surprises communication cadence means updating early and often, even if the update is simply to state that the investigation is ongoing.
Honest post-mortems are the final piece of the puzzle. Avoid corporate jargon. If a migration script failed, say so. If a load balancer misconfiguration caused the downtime, describe the technical root cause. This level of honesty builds a foundation of trust that "marketing-speak" can't replicate. It shows your users that you value their time and understand the technical implications of your service's availability.
The Architecture of a Status Page
Choosing between a native status page and a third-party provider involves clear trade-offs. A native page is often easier to manage but risks going down alongside your primary infrastructure. A third-party page hosted in a different region provides the necessary isolation to remain accessible during a total site failure. Many industry incumbents use per-subscriber pricing models, which can lead to unexpected costs during high-traffic incidents. For a deeper dive into these structures, see The Architecture of Incident Communication Transparency.
Best Practices for Incident Updates
Effective updates follow a "Triage-Action-Resolution" framework. First, acknowledge the problem and define the scope. Second, explain what's being done to fix it. Finally, confirm when the service is restored and provide a summary of the fix. Avoid hype words like "seamless" or "revolutionary." These terms don't belong in an outage update. Instead, use specific technical details. Mentioning that you're "re-indexing the primary database cluster" builds more credibility with a developer audience than saying you're "working hard to fix the issue."
To implement these strategies without the complexity of enterprise observability suites, you can launch a public status page that integrates directly with your monitoring stack.
Implementing the Zero Surprise Policy with StatusPulse
Achieving a Zero Surprises environment requires a unified view of your stack. StatusPulse consolidates uptime, SSL, and API monitoring into a single dashboard. This prevents fragmented visibility by surfacing issues across different layers of your infrastructure. By centralizing these checks, your team spends less time context-switching between disparate tools.
AI Incident Management helps bridge the gap between detection and communication. During an active outage, the stress of the "blank page" often delays updates to your users. StatusPulse uses AI to draft technical updates that sound human and maintain technical honesty. These drafts act as assistants that require a final human action, keeping you in total control of the narrative.
Privacy and regulatory compliance are core virtues of the platform. You can configure your StatusPulse instance for either EU or US hosting. This ensures compliance with regional data sovereignty standards. It's a principled choice for specialists who value regional integrity as much as system performance.
Pricing transparency is a bold signature of the brand's value proposition. Many incumbents use per-subscriber billing that effectively penalizes you for growing your audience or communicating during a crisis. StatusPulse uses flat-rate plans. This is a more ethical approach for teams that value predictable costs and straightforward service over corporate bloat.
Automating Your Monitoring Workflow
You can set up 1-minute checks in under five minutes. Integration with Slack, Discord, and PagerDuty is straightforward. No complex configurations are required to get alerts where your team already works. Public status pages are fully customizable to match your brand's technical aesthetic, ensuring a consistent experience for your users.
The StatusPulse Edge for DevOps Teams
The platform follows an API-first design. You can manage your monitoring via code or use the clean UI for manual adjustments. This flexibility respects the human agency of the specialist. It's built for those who prefer precision and truthfulness over traditional enterprise software complexity. Start monitoring for zero surprises today with StatusPulse.
Transitioning to Proactive Operations
Moving from reactive firefighting to a proactive visibility stack is both a technical and ethical shift. You've seen how silent failures in SSL chains or API schemas can bypass traditional checks and damage user trust. By implementing a Zero Surprises policy, you prioritize the actual user experience over misleadingly green dashboards. This requires a commitment to granular monitoring and honest, automated communication.
Reliable incident management shouldn't be gated by corporate bloat or per-subscriber pricing traps. You need a platform that respects your data sovereignty and your operational budget. StatusPulse provides a straightforward approach with a choice between EU and US hosting. Our flat-rate plans ensure your costs remain predictable even as your audience grows. AI-powered incident drafting further reduces the stress of manual updates, allowing your engineers to focus on the technical resolution.
It's time to replace technical blind spots with a reliable, all-in-one monitoring solution. Build your Zero Surprise monitoring stack with StatusPulse. Take control of your system health today and start building long-term trust through radical transparency.
Frequently Asked Questions
What is a "Zero Surprise" policy in technical operations?
A Zero Surprises policy is an operational framework where the engineering team is always the first to know about a failure. It relies on automated visibility and proactive communication to eliminate the gap between an incident occurring and a user discovering it. By prioritizing transparency, you ensure that your team remains in control of the narrative rather than reacting to unexpected support spikes.
Why should I monitor SSL certificates if they auto-renew?
Auto-renewal processes are not infallible. They can fail due to DNS misconfigurations, expired payment methods, or registrar errors that go unnoticed in your primary dashboard. Monitoring validates the actual certificate served to the browser. This ensures you catch broken trust chains or expiration issues before they block your users from accessing your service.
How does API monitoring differ from standard uptime monitoring?
Standard uptime monitoring typically only checks if a server is reachable at the network level. API monitoring validates the application layer by verifying JSON schemas, response payloads, and specific status codes. It ensures that your business logic is functioning correctly, not just that your server is powered on and responding to pings.
Can StatusPulse host my data in the EU for GDPR compliance?
Yes, you can choose between EU and US hosting for your monitoring data. This flexibility supports data sovereignty and allows you to meet specific regional regulatory requirements. It's a principled approach to privacy that avoids the centralized models used by many corporate-bloated enterprise suites.
How do public status pages help reduce support tickets?
Public status pages act as a single source of truth during an incident. When users can see an acknowledged outage on your status page, they are less likely to open a manual support ticket for the same issue. This can reduce your ticket volume by approximately 40%, allowing your team to focus on resolving the root cause.
Does StatusPulse charge per subscriber for status page alerts?
No, StatusPulse uses flat-rate pricing with no per-subscriber fees. This prevents pricing surprises during high-traffic incidents when your subscriber count might spike. It's an ethical alternative to the complex, usage-based models used by many industry incumbents who charge more when your service is struggling.
How does AI help in incident management without sounding like a bot?
AI drafts technical updates by summarizing logs and system metrics into a clear, human-readable narrative. It acts as an assistant that requires a final human review and action before publication. This ensures the communication remains honest and technically accurate while reducing the cognitive load on engineers during a crisis.
Is 1-minute monitoring necessary for all web applications?
For any customer-facing application, 1-minute monitoring is the industry standard for a Zero Surprises environment. Checking at 5-minute intervals leaves a significant blind spot where users can encounter errors long before your team is alerted. While longer intervals might work for internal staging, they are insufficient for maintaining high-availability production systems.


