

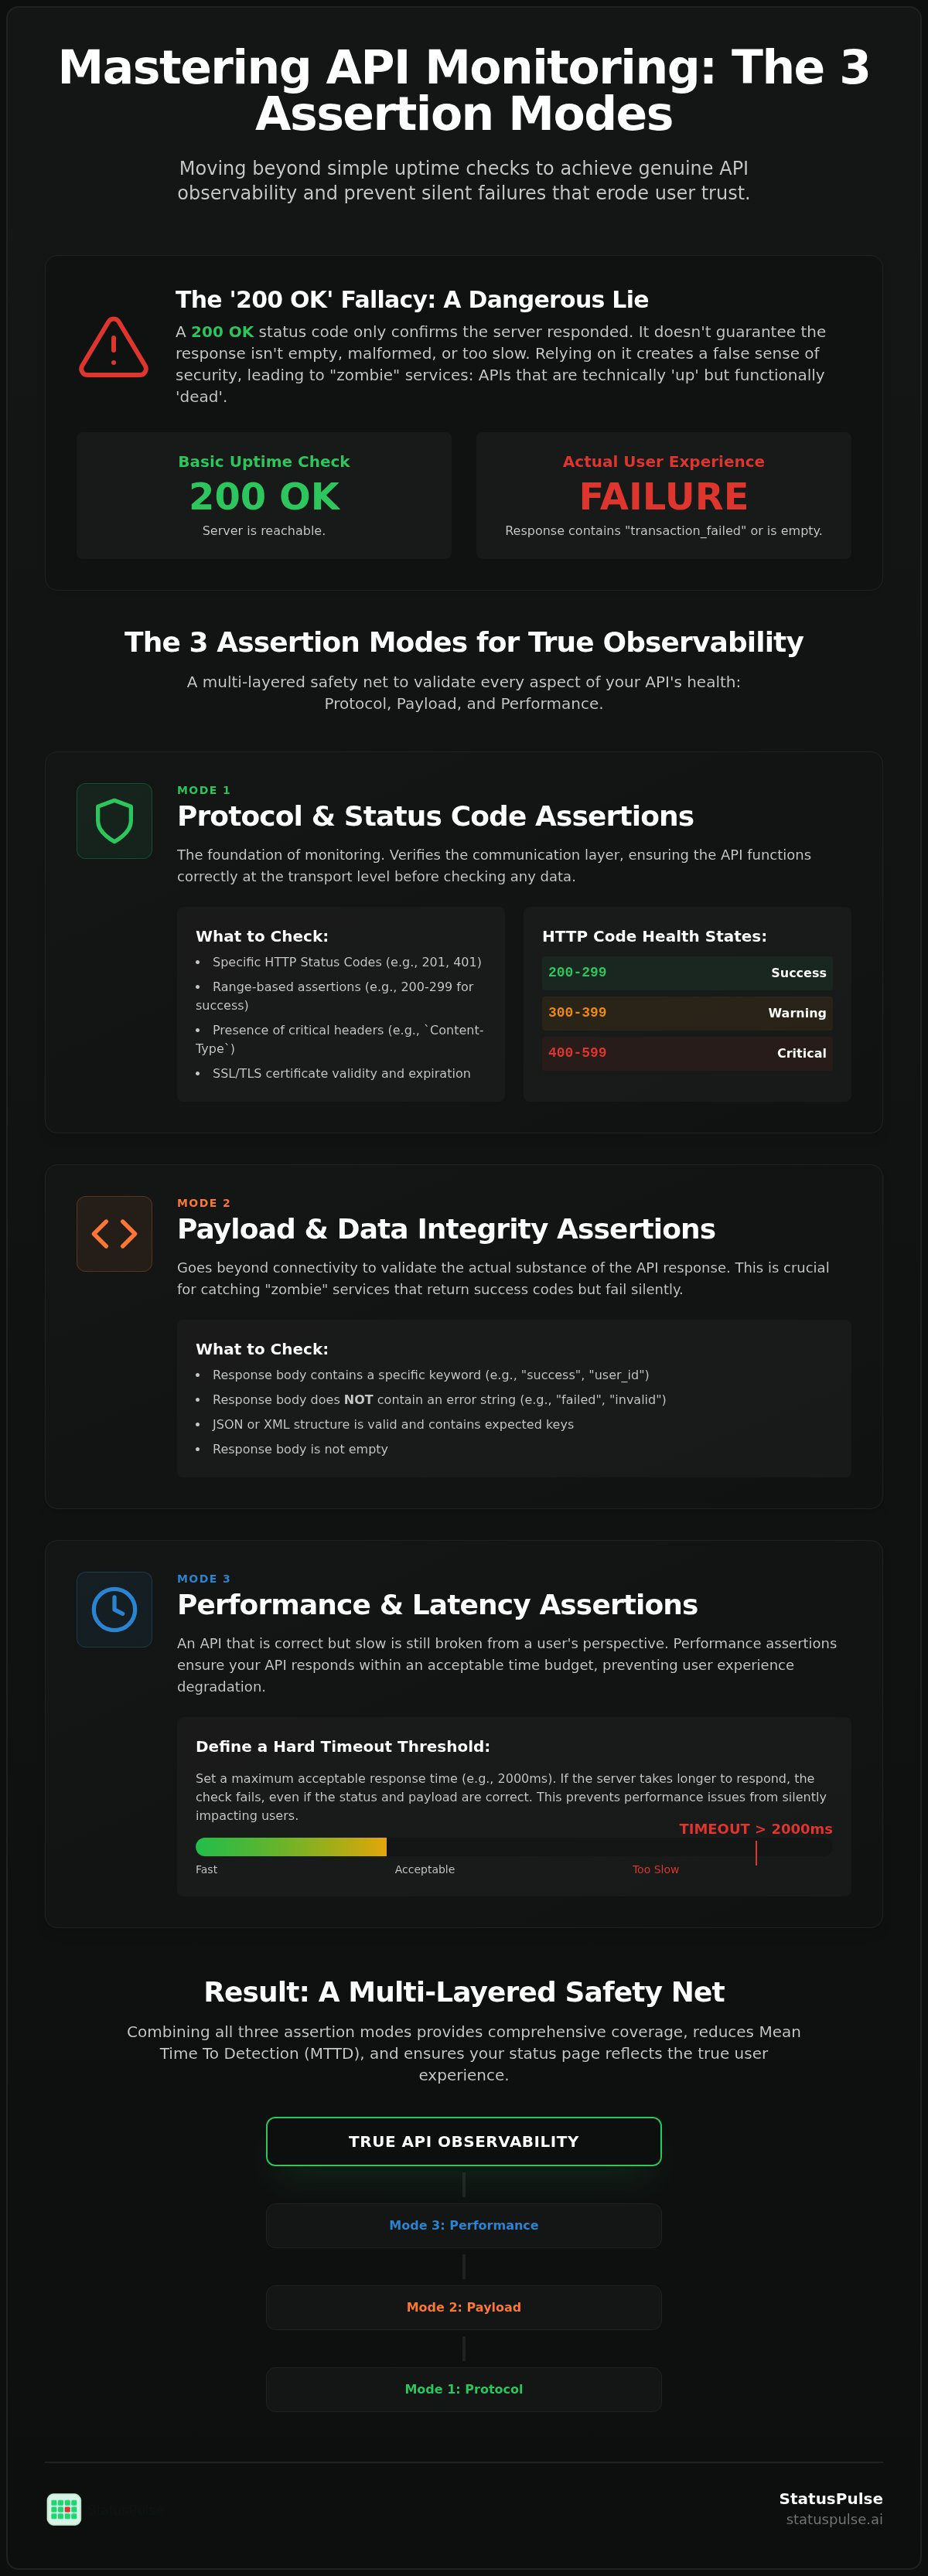
A "200 OK" status code is frequently a lie. It confirms the server responded. It doesn't guarantee the response body isn't empty, malformed, or three seconds too late. For SREs and developers, relying solely on basic uptime checks creates a false sense of security while silent failures erode user trust. Mastering the 3 Assertion Modes is the only way to move from simple pings to genuine API observability.
We agree that alert fatigue is a productivity killer and that complex monitoring configurations often cause more stress than they solve. This article provides a clear framework for multi-layered validation to reduce your Mean Time to Detection (MTTD). We examine how to implement protocol, payload, and performance assertions. This ensures your public status page reflects the true experience of your users.
Key Takeaways
- Understand why a 200 OK status code can hide critical failures and how to detect "zombie" services that return empty data.
- Master the 3 Assertion Modes to validate protocol, payload integrity, and performance latency within a single monitoring check.
- Implement keyword-based assertions to ensure your API returns expected strings rather than malformed or generic error bodies.
- Define hard timeout thresholds to prevent performance degradation from quietly impacting your user experience without triggering standard alerts.
- Automate incident communication by linking assertion failures directly to your public status page for immediate, honest transparency.
What are Assertion Modes in API Monitoring?
An API assertion is a logic-based rule applied to a network response to verify it meets specific criteria. Most basic monitoring tools only check for a heartbeat. They tell you if the server is reachable. They don't tell you if the server is actually working. Mastering the 3 Assertion Modes allows technical teams to move from binary uptime checks to deep observability.
In computer science, an assertion is a predicate that ensures a condition remains true during execution. In the context of API monitoring, this means testing every response against a set of expectations. If any condition fails, the monitor fails. This approach identifies "zombie" services; APIs that are technically "up" but functionally "dead" because they return incorrect or empty data.
The '200 OK' Fallacy
A "200 OK" status code is the most dangerous lie in web development. It confirms the HTTP handshake was successful. It does not confirm the application logic succeeded. We've seen payment gateways return a 200 status while the response body contains a "transaction_failed" error. Without deep assertions, your dashboard stays green while your revenue drops to zero.
Silent failures like these ripple through microservices. A frontend might receive a 200 OK but an empty JSON object. The UI breaks. The user leaves. The uptime monitor remains silent. This gap in visibility is why standard uptime checks are no longer sufficient for production environments. You need a way to validate the actual substance of the response.
Anatomy of an API Assertion
Every assertion consists of a trigger and a validator. The trigger is the HTTP request your monitor sends. The validator is the logic you apply to the response. Modern tools like StatusPulse use logical operators like "Equals," "Contains," or "Regex" to inspect different parts of the network packet. An assertion is a boolean test applied to a network response.
- The Status: Does the code match your expectation?
- The Body: Does the response contain specific keys or strings?
- The Timing: Did the server respond within your performance budget?
By combining these checks, you create a multi-layered safety net. This strategy covers the three essential categories of API health: Protocol, Payload, and Performance. Each mode addresses a different failure state, ensuring that your public status page reflects the actual user experience rather than just a server's ping response.
Mode 1: Protocol and Status Code Assertions
Protocol assertions are the foundation of any monitoring strategy. They verify the communication layer between the client and server. This first layer ensures the API functions as intended at the transport level. Within our framework of 3 Assertion Modes, protocol checks act as the initial gatekeeper. If the handshake fails or the status code is unexpected, downstream payload validation is irrelevant.
Standard Status Assertions
Most monitors default to a generic "200 OK" check. Professional setups require more nuance. You should use range-based assertions (200-299) for standard success. Use specific codes like 201 Created for resource generation or 204 No Content for successful deletions. Negative testing is also critical. Asserting a 401 Unauthorized for an unauthenticated endpoint proves your security layer is active. Redirects (3xx) can be tricky. You must decide if your monitor should follow the redirect or assert the redirect code itself.
| HTTP Code | Health State | Description |
|---|---|---|
| 200-299 | Success | Request processed correctly. |
| 300-399 | Warning | Resource moved or redirected. |
| 400-599 | Critical | Client or server-side failure. |
Beyond the Status Line
Validation doesn't end at the status code. Headers provide essential metadata. Check for Content-Type: application/json to prevent malformed responses. Verify security headers like Strict-Transport-Security are present to maintain compliance. For performance-heavy APIs, asserting an X-Cache: HIT header ensures your CDN is working. This protects your origin server from unnecessary load. The protocol layer also includes the SSL/TLS handshake. A successful connection doesn't matter if the certificate is about to expire. Integrating SSL Certificate Monitoring into your protocol checks prevents outages before they happen.
StatusPulse allows you to configure these protocol assertions in seconds. It gives you immediate confidence in your API baseline connectivity. By mastering this first of the 3 Assertion Modes, you eliminate the most common cause of downtime: simple connectivity failure. Once the protocol is stable, you can move to validating the actual data being exchanged.
Mode 2: Payload and Data Integrity Assertions
Protocol checks confirm the connection exists. Payload assertions confirm the data is correct. Even if a server returns a 200 OK, the response body might be empty or contain a generic error message. API monitoring is the process of validating that the actual substance of the response matches your expectations. This is the second pillar of the 3 Assertion Modes, designed to catch silent failures that status codes miss.
Keyword and String Matching
Keyword assertions are the simplest way to verify data integrity. You can use "Contains" logic to look for specific strings like "status": "success" or "order_id". Conversely, "Does Not Contain" assertions help you identify error messages that shouldn't appear in a healthy response. Be careful with case sensitivity. A check for "Success" will fail if the API returns "success". We recommend using case-insensitive matching where possible to avoid brittle monitors that trigger false positives over minor formatting changes.
Regex (Regular Expression) assertions provide more power for dynamic data. You can't always predict a specific ID, but you can predict its format. A UUID assertion ensures the API returns a valid identifier rather than a null value or an empty string. This level of detail is essential for maintaining high reliability in modern distributed systems. For a deeper look at these strategies, check our comprehensive API Monitoring Guide.
JSON Path and Schema Validation
Modern APIs often return deeply nested JSON objects. Checking the entire body is inefficient and prone to failure when unrelated fields change. JSON Path allows you to target specific nodes. You can assert that $.user.profile.email contains an "@" symbol. This ensures that the most critical parts of your data structure remain intact even as the API evolves. [VERIFY: specific JSON path syntax supported by StatusPulse].
Schema validation takes this a step further by checking data types. You can assert that a "price" field is always a number and never a string or null. This prevents "type drift" where a backend update accidentally changes a data format, breaking your frontend or downstream microservices. Combining these techniques ensures that your monitoring is as robust as your code. It moves you beyond basic pings into true observability. Mastering this second of the 3 Assertion Modes protects your users from broken data even when the server says everything is fine.
Mode 3: Performance and Latency Assertions
Performance assertions are the final pillar of the 3 Assertion Modes. While protocol and payload checks ensure accuracy, latency assertions ensure usability. In modern distributed systems, "slow is the new down." A response that arrives after a client's timeout is functionally identical to a 500 Internal Server Error. If your API takes ten seconds to return a valid JSON body, your users have already abandoned the request.
Latency assertions allow you to define a performance budget for every endpoint. This moves monitoring from a simple binary state to a nuanced view of service health. By setting hard thresholds, you ensure that performance degradation triggers the same level of urgency as a total outage. This is critical for maintaining high confidence in your public status page accuracy.
Defining Performance Thresholds
Determining an acceptable response time requires an understanding of your specific stack. You must distinguish between Time to First Byte (TTFB) and total response time. TTFB typically measures server-side processing and database query efficiency. Total response time includes the network overhead of transferring the payload. For most RESTful microservices, a common configuration involves asserting that total_time < 500ms.
- P95 Latency: The threshold where 95% of your users experience faster response times.
- P99 Latency: The worst-case scenario for the remaining 1% of users, often highlighting edge-case bottlenecks.
- Network Jitter: Brief, random spikes in latency caused by internet routing that can cause false positives.
Setting strict thresholds involves a trade-off. If your assertion is too aggressive, minor network jitter will trigger alert fatigue. We recommend basing your assertions on historical P95 data to ensure alerts only fire during genuine performance regressions. [VERIFY: maximum timeout allowed for performance assertions].
Latency Drift and Alerting
Performance assertions are uniquely suited to catching latency drift. This is the gradual slowing of an API over time, often caused by growing database tables or unoptimized code. By using Website Performance Monitoring Tools, you can correlate these spikes with deployment timestamps. This allows your team to identify exactly which commit introduced a bottleneck before it impacts all users.
When a performance assertion fails, it should act as a trigger for automated incident communication. Tools like StatusPulse can use these failures to draft honest incident reports, keeping your stakeholders informed without manual intervention. This proactive approach significantly reduces your Mean Time to Detection (MTTD) for partial outages. Stop guessing about your API speed and configure performance assertions on StatusPulse to protect your user experience today.
Implementing Multi-Mode Assertions with StatusPulse
StatusPulse integrates the 3 Assertion Modes into a single, unified check interface. You don't need separate tools for uptime, payload validation, and performance monitoring. Everything happens in one request. This consolidation reduces complexity. It ensures your monitoring logic remains consistent across your entire stack without the bloat of enterprise suites.
Configuring these checks is straightforward. You define your protocol, payload, and performance criteria within the dashboard. Accuracy depends on geography. You can choose between EU or US-based monitoring nodes to ensure latency assertions are measured from locations relevant to your users. This also supports data sovereignty requirements for European teams who prioritize privacy and compliance.
From Assertion Failure to Status Update
A failed assertion should do more than just trigger a notification. It should inform your users. StatusPulse maps specific assertion failures to your public status page components. If a protocol check fails, the component shows as "Down." If a payload check fails but the server is reachable, it indicates a "Partial Outage." This distinction provides immediate clarity to your customers.
Our AI Incident Management feature drafts transparent updates based on these failed checks. If an API responds with a 200 OK but fails a keyword assertion, the AI suggests a report stating: "API responding but returning incorrect data." This is more honest than a generic "investigating" message. You maintain human agency. You review the draft, make any necessary adjustments, and publish the truth to your status page.
Best Practices for Minimal Noise
Alert fatigue is a significant pain point for SRE teams. We recommend the "Retry" rule to maintain high confidence in your alerts. Set your monitor to retry at least once before triggering an incident. This simple step filters out transient network blips that don't represent a genuine service failure. It keeps your team focused on real problems.
Group your assertions logically to prevent redundant notifications. If an API fails both its status code check and its payload validation, StatusPulse groups these into a single incident report. You get the full technical context in one place rather than a flood of separate emails. This streamlined approach mirrors our commitment to simplicity and efficiency.
Reliable observability shouldn't be expensive or complex. Our flat pricing model ensures you won't be penalized with per-subscriber fees as your audience grows. Start monitoring with StatusPulse today to implement a multi-layered validation strategy that protects your users and your reputation.
Strengthening Your API Observability Strategy
Relying on status codes alone leaves your services vulnerable to silent failures and performance drift. True reliability comes from inspecting the full response cycle. Mastering the 3 Assertion Modes ensures that every monitoring check validates the protocol, the payload integrity, and the latency thresholds your users expect. This multi-layered approach eliminates the "200 OK" fallacy and provides a truthful view of your system health.
Effective monitoring should simplify your workflow, not complicate it. StatusPulse offers a straightforward platform with transparent flat pricing and the choice of EU or US-based hosting for data sovereignty. Our AI-powered incident drafting uses failed assertions to create honest, technical updates for your stakeholders. This reduces the stress of manual communication during a crisis. You don't have to settle for basic pings when you can have deep, actionable insights.
It's time to move beyond simple uptime and protect your user experience with precision. Build a more reliable API monitoring strategy with StatusPulse. Your team and your users deserve a monitor that tells the whole story.
Frequently Asked Questions
What is the difference between a status assertion and a payload assertion?
Status assertions verify the HTTP response code while payload assertions inspect the actual data returned in the body. A status check tells you the server responded; a payload check tells you the server responded correctly. Using these together is part of the 3 Assertion Modes framework to catch "zombie" services that return success codes with empty or broken data. This distinction is the core of moving beyond simple pings.
Can I use multiple assertion modes on a single API check?
Yes, combining multiple modes on a single monitor is a best practice for comprehensive observability. You can simultaneously validate the status code, specific JSON fields, and the response latency. This multi-layered approach ensures that a monitor only reports a "Success" state if the API is reachable, accurate, and performing within your defined budget. It reduces the risk of missing partial failures that only affect specific data points.
How do Regex assertions help with dynamic API responses?
Regex assertions allow you to validate response data that changes frequently but follows a specific pattern. Instead of looking for a static value, you can ensure a field contains a valid UUID, an ISO-formatted timestamp, or a specific email structure. This is essential for monitoring production APIs where IDs and timestamps are generated in real-time and cannot be hard-coded. It makes your payload assertions more flexible and less prone to false positives.
What happens to my public status page if a performance assertion fails?
If a performance threshold is exceeded, StatusPulse can automatically update your status page to show a "Degraded Performance" state. This provides transparency to your users without claiming the entire service is down. Because our AI Incident Management drafts these updates based on the specific failure, your status page remains an honest reflection of the current user experience. It helps maintain trust by communicating the exact nature of the slowdown.
Are there performance overheads when using complex JSON path assertions?
The overhead of parsing JSON path assertions is negligible for the vast majority of API responses. Modern monitoring engines process these queries in milliseconds, which won't impact the accuracy of your latency measurements. However, for exceptionally large payloads, we recommend targeting specific nodes rather than scanning the entire body to maintain maximum efficiency. [VERIFY: specific JSON path syntax supported by StatusPulse]. This ensures your checks remain fast and reliable regardless of payload size.
Should I assert against 4xx or 5xx error codes in my monitoring?
You should assert against error codes when performing negative testing to verify security or error-handling logic. For example, asserting a 401 Unauthorized code on a protected endpoint confirms your authentication layer is working. This type of protocol assertion is just as valuable as checking for success codes when ensuring your API's overall reliability. It proves that your API fails gracefully and securely when presented with invalid credentials or malformed requests.
How does StatusPulse handle assertions for authenticated API endpoints?
StatusPulse allows you to configure custom headers and bearer tokens to monitor authenticated endpoints securely. You can apply the 3 Assertion Modes to these private requests just as you would for public ones. This ensures your core business logic, which often sits behind authentication layers, remains accurate and performant while respecting your existing security protocols. It provides full visibility into the parts of your application that matter most to your paying customers.


