

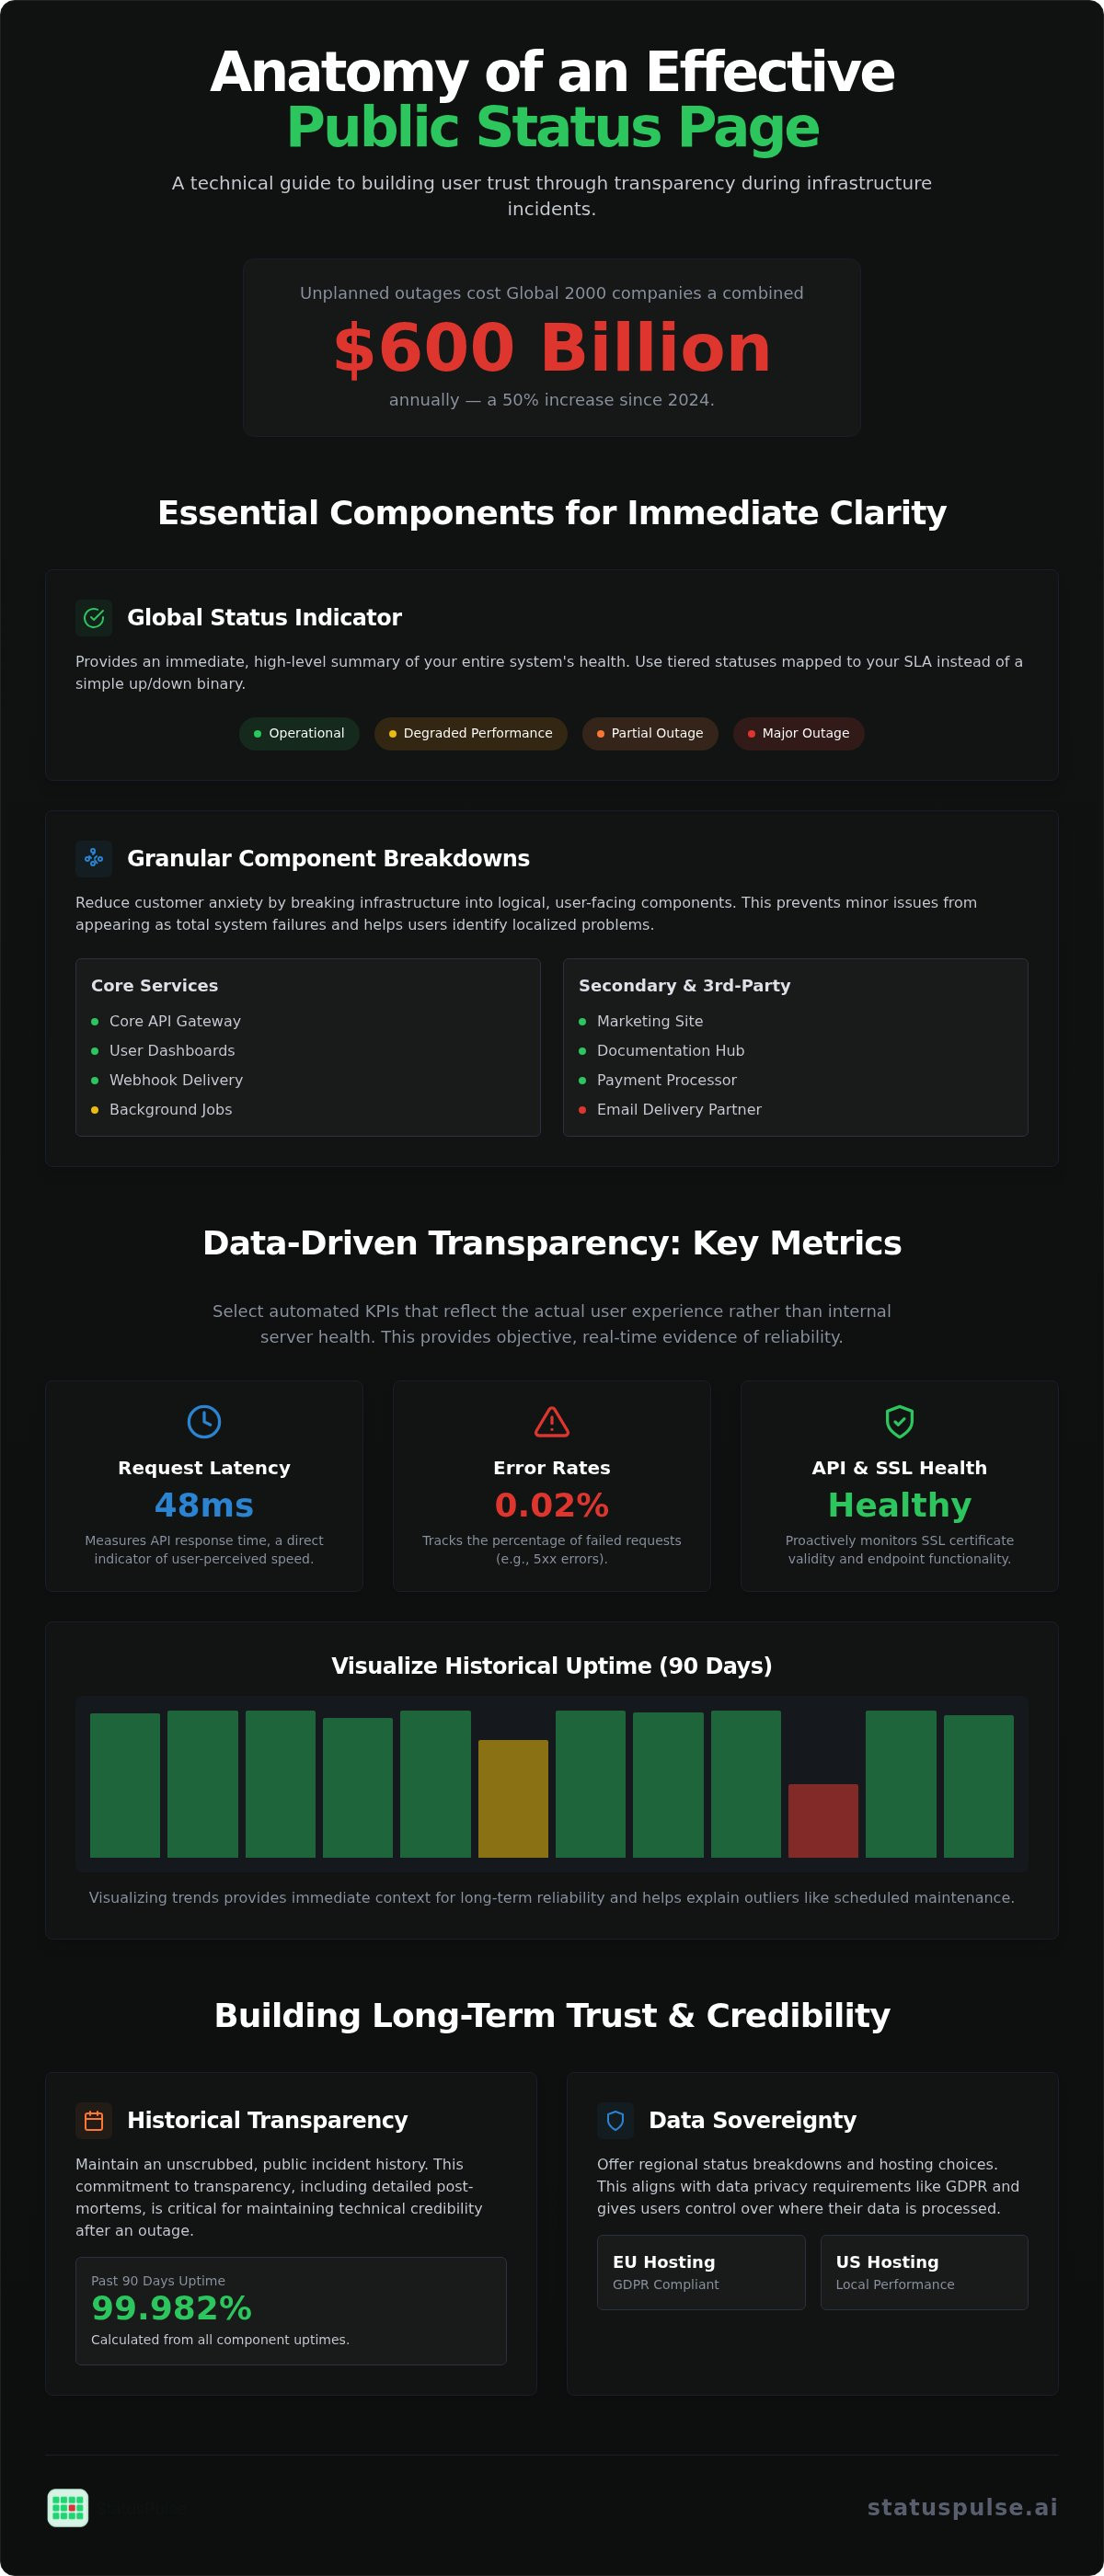
Unplanned outages now cost the Global 2000 a combined $600 billion annually, which is a 50% increase since 2024. To maintain technical credibility, knowing what to include in a public status page is essential: a global health indicator, granular component breakdowns, real-time performance metrics, and a transparent incident log. These core elements provide the immediate clarity users need when infrastructure fails.
You've likely felt the pressure when a core service fails. Support tickets spike instantly, and the manual task of updating customers feels like a distraction from fixing the bug. Transparency shouldn't be a chore that adds to your mean time to resolution during an active incident. It should be a streamlined part of your response workflow.
This guide provides the specific technical components and communication protocols required to build a transparent status page. We will cover how to automate updates, reduce customer anxiety, and draft professional post-mortems using specialized assistants. These steps turn technical failures into opportunities for building long-term trust with your users.
Key Takeaways
- Identify the visual indicators and granular component breakdowns required to provide immediate clarity on system health.
- Learn exactly what to include in a public status page to balance automated uptime metrics with human-verified incident narratives.
- Reduce support ticket volume by establishing communication protocols for the "investigating" phase of an outage.
- Maintain technical credibility by preserving an unscrubbed incident history and calculating precise uptime percentages.
- Navigate data sovereignty by selecting hosting regions that align with GDPR and subscriber privacy requirements.
Essential Components of a Public Status Page
A status page is a technical contract of transparency. It requires a structured hierarchy of data to be effective. When determining what to include in a public status page, you must move beyond a simple green light. Your page needs to provide enough context for an SRE to understand the scope of an issue without needing to contact your support team. This starts with a global health indicator followed by granular component states.
The Global Status Indicator
The global indicator provides an immediate summary of your entire stack. Using tiered statuses is more effective than a binary up or down toggle. Common states include Operational, Degraded Performance, Partial Outage, and Major Outage. These states should be mapped directly to your Service-Level Agreement (SLA). For example, if your API latency exceeds a specific threshold, the status should automatically shift to "Degraded Performance" rather than waiting for a total failure.
A standard JSON schema for a status component might look like this:
{
  "component_id": "api-gateway-eu",
  "name": "Core API Gateway",
  "status": "degraded_performance",
  "region": "eu-west-1",
  "metadata": {
"current_latency_ms": 480,
"p99_threshold_ms": 300
  }
}
Service Component Mapping
Granularity reduces customer anxiety. Instead of listing a single "System" status, break your infrastructure into logical components. Grouping by region, such as EU-West-1 or US-East-1, helps users identify if a problem is localized. This is a core feature for teams using public status pages to maintain data sovereignty across different jurisdictions. You should also separate core services from secondary tools like documentation or your marketing site to prevent minor issues from appearing as total system failures.
Core Component Checklist
To ensure your page provides maximum value during a crisis, verify that it includes these specific elements:
- Global Health Bar: A prominent visual summary of current system state.
- Regional Breakdowns: Separate status indicators for EU and US hosting environments.
- Functional Components: Individual health tracking for APIs, Dashboards, and Webhooks.
- Third-Party Dependencies: Status indicators for critical upstream providers like payment processors.
- Historical Ledger: A transparent view of the last 90 days of performance.
Determining what to include in a public status page is a balance of technical depth and clarity. By providing these granular details, you reduce the "coordination tax" on your engineering team. This allows them to focus on remediation while the status page handles stakeholder communication.
Performance Metrics and Real-Time Uptime Data
Transparency relies on data. When deciding what to include in a public status page, metrics serve as the objective evidence of your reliability. Raw data can be overwhelming. You must select Key Performance Indicators (KPIs) that reflect the actual user experience rather than your internal server health. Focus on request latency, error rates, and success percentages. These three pillars tell a story that your customers can understand without needing access to your internal dashboards.
Automation is the standard for 2026. Manual reporting is slow and prone to human error during high-stress incidents. Automated systems pull data directly from your monitoring stack to provide real-time updates. Visualizing this data helps users spot trends quickly. A 90-day bar chart or sparkline provides immediate context for your long-term uptime. If a metric spikes due to scheduled maintenance, use annotations to explain the outlier. This prevents users from assuming a failure occurred during a planned window.
API and SSL Monitoring Integration
Your status page should provide a complete view of your security and connectivity. SSL certificate health is often overlooked. An expired certificate is a major outage that users perceive as a total system failure. Including SSL status proactively builds trust. Synthetic API checks are equally vital. They simulate real-world user paths to verify that your endpoints are not just up but functional. Monitoring your site status ensures that the front door to your business remains open and reliable.
Avoiding Metric Overload
There is a danger in exposing too much. Internal metrics like CPU usage or disk I/O are noise to your customers. They distract from the core question of whether the service is working. Determining what to include in a public status page requires a strict filter to avoid this metric noise. Aggregate your backend data into a single health score. This simplifies the user experience while maintaining technical depth. For global services, report latency across different continents separately. A user in Berlin doesn't care about a latency spike in Sydney. Using automated monitoring tools allows you to filter this data so that only the most relevant, ethical metrics reach your public page.
Incident Update Protocols and Communication
Communication is the most difficult part of incident response. When a system fails, engineers naturally prioritize the fix over the status page. This delay creates a vacuum that customers fill with frustration. Deciding what to include in a public status page during an active outage starts with the "Investigating" phase. You don't need all the facts to hit publish. Acknowledging a problem within 15 minutes of detection builds more trust than a perfect explanation delivered two hours too late.
Tailoring your message requires a balance between technical depth and readability. Your internal SREs need stack traces and error codes, but your customers need to know if they can still process payments or access their data. Use clear, plain language for the primary update. Save the high-level technical precision for the final post-mortem. This approach ensures your communication is accessible to stakeholders while remaining credible to the technical peers who depend on your infrastructure.
Drafting Updates with AI Assistance
Modern incident management utilizes AI to bridge the gap between technical logs and customer-facing updates. AI agents can ingest complex telemetry data and draft a concise summary for human review. It's a specialized assistant that requires a final human action before going live. This ensures integrity and prevents the generic feel of fully automated bots. Using ai incident management reduces drafting time during a crisis, giving your team back valuable minutes to focus on remediation.
The Incident Lifecycle Workflow
A structured workflow prevents communication gaps. Start with an initial acknowledgment that defines the suspected scope. Move into periodic updates at set intervals, such as every 30 or 60 minutes. Even if there's no new technical information, tell your users you're still there. Silence is often interpreted as neglect. Finally, provide a resolution update that confirms services are stable. This cycle keeps the pressure off your support team by providing a single source of truth for all stakeholders.
Every major incident must conclude with a transparent post-mortem. This document should detail the root cause, the specific impact on users, and the remediation steps you've taken to prevent a recurrence. Honest post-mortems are a core element of what to include in a public status page to turn a failure into a long-term trust-building exercise. Acknowledging trade-offs in your architecture during these reviews shows a level of integrity that larger, faceless corporations often avoid.
Historical Transparency and Trust Building
Trust is a technical asset. It takes years to build and minutes to destroy. One of the most critical decisions regarding what to include in a public status page is how you handle your historical data. Some teams "scrub" their history after a difficult quarter. This is a mistake. It signals to users that your transparency is conditional. According to 2026 consumer reports, 74% of users say transparent communication about technical issues directly influences their loyalty. A complete, unedited incident history is a ledger of your integrity.
Uptime percentages must be precise. 99.9% uptime allows for approximately 8.77 hours of downtime per year. Moving to 99.99% reduces that window to just 52.6 minutes. If your status page claims four nines but your history shows eight hours of outages, you lose credibility. Distinguish between planned maintenance and unexpected outages. Planned downtime shows a mature operations team that respects user schedules. Unplanned outages are a reality of complex systems that require honest documentation.
The Ethics of Uptime Reporting
Honest communication prevents churn more effectively than hiding failures. When a service "flaps"—rapidly cycling between operational and degraded states—don't hide the oscillation. Document each state change clearly. Using incident communication transparency builds a long-term brand moat. It differentiates your team from larger, faceless corporations that prioritize marketing optics over technical truth. Honesty about trade-offs in your infrastructure helps users plan their own mitigation strategies.
Managing Subscriber Expectations
Notifications should be surgical. Don't spam your entire user base for a localized API issue that only affects a specific region. Provide granular subscription options for email, Slack, or Webhooks. This allows users to opt-in only for the components they use. It also manages notification fatigue. We believe in ethical pricing for these services. Charging per-subscriber fees is a tax on your success. Flat-rate models are more principled and predictable for growing teams. You can build a transparent status page that respects both your users and your budget.
Pushing updates through multiple channels ensures your message reaches users where they work. Slack integrations are standard for DevOps teams, while Webhooks allow enterprise customers to ingest your status data into their own internal monitoring. Managing "quiet hours" for non-critical updates shows respect for your subscribers' work-life balance. This level of detail in what to include in a public status page turns a simple monitoring tool into a sophisticated communication platform.
Technical Implementation and Data Sovereignty
Implementation is where strategy meets infrastructure. While visual components are important, the underlying architecture determines your regulatory compliance. When mapping out what to include in a public status page, technical implementation must account for data residency. You cannot treat the location of your status data as an afterthought. It is a core part of your security posture and legal obligation. For organizations that need to bolster their infrastructure, M.I.S. Support, Inc. provides proactive security and managed IT services to handle these compliance challenges.
European companies face a unique set of challenges in 2026. The EU Digital Operational Resilience Act (DORA) is now in full effect, requiring standardized incident reporting for financial entities. This makes regional hosting a priority rather than a preference. The legal instability of the EU-U.S. Data Privacy Framework, exacerbated by the June 2026 Trump v. Slaughter decision, has created fresh uncertainty regarding data transfers. Many CTOs now require that subscriber data and incident logs remain within European borders.
StatusPulse addresses these concerns by allowing users to choose between EU and US hosting. This ensures that your status page infrastructure aligns with your regional compliance needs. Privacy standards are a core part of what to include in a public status page for any global enterprise. Subscriber emails are personal identifiable information (PII). They must be stored and processed in a way that respects GDPR and local privacy laws without compromising notification speed.
Integrating Status into the DevOps Stack
A status page is only useful if it is accurate. Manual updates are the first thing to fail during a major outage. You should integrate your page with your existing website performance monitoring tools to automate status changes. Using API triggers or monitoring webhooks allows your page to reflect reality in real time. This reduces the coordination tax on your SREs and ensures customers are notified before they have time to open a support ticket.
- Custom Domains: Use a subdomain like status.yourdomain.com to maintain brand consistency.
- SSL Management: Ensure your status page is served over HTTPS to protect subscriber data.
- Registration Tracking: Utilize Whoisvibe to monitor the expiration and status of your domain names to prevent service interruptions.
- Embedded Widgets: Place status indicators directly in your main application to inform users of issues before they leave your product.
Start with a simple, reliable page. As your infrastructure grows, automate the reporting of specific service components. StatusPulse offers an all-in-one platform that combines uptime monitoring with automated status pages. This reduces tool sprawl and ensures your incident response workflow is logic-driven and efficient. Building a technical contract of transparency requires the right tools and a commitment to honest, regionalized communication.
Building a Foundation of Technical Trust
A status page is more than a dashboard. It's a technical contract of transparency between your team and your users. In 2026, knowing what to include in a public status page means balancing automated metrics with regional data sovereignty. Trust isn't built when things are perfect. It's built when things break and you provide a clear, honest path to resolution.
Automation and AI assistants now handle the heavy lifting of incident drafting. This allows your engineers to focus on the fix. By choosing infrastructure that offers a choice of EU or US hosting, you ensure compliance without sacrificing performance. Ethical pricing models that avoid per-subscriber taxes make this level of transparency accessible to every growing team.
You can build a transparent status page with StatusPulse to start managing incidents with quiet confidence. Our platform offers flat pricing, unlimited subscribers, and the precision your SREs require. Take the stress out of downtime and start building a more resilient, honest brand today.
Frequently Asked Questions
What is the difference between a public and private status page?
A public status page is a customer-facing site designed to communicate service health and build transparency. A private status page is an internal tool used by your engineering and management teams. It often includes sensitive telemetry data and internal incident logs that aren't suitable for the general public. While both tools track uptime, the public version focuses specifically on user impact and high-level service availability.
How often should I update the status page during an active incident?
You should update your status page every 15 to 30 minutes during a major outage. Even if you don't have new technical facts, a simple update confirms that your team is still actively investigating. Silence during a crisis often leads to increased support ticket volume and customer anxiety. Consistent communication proves that your team is in control and respects the user's time.
Should I include third-party service outages on my status page?
You should include third-party outages if they directly affect your application's functionality. When a cloud provider or payment gateway fails, your users experience it as your failure. Listing these dependencies as part of what to include in a public status page clarifies that the root cause is upstream. This approach prevents users from blaming your codebase for issues outside your immediate control.
What metrics are too technical to show on a public status page?
Avoid showing internal metrics like CPU utilization, memory pressure, or specific database query times. These data points are noise to most customers and can expose security vulnerabilities. Focus instead on request success rates and average latency. Determining what to include in a public status page requires filtering for metrics that directly reflect the user experience rather than your raw server health.
Can I automate my status page updates directly from my monitoring tool?
You can and should automate your status page updates using monitoring triggers or an API. Manual updates often fail when engineers are busiest fixing the actual problem. Automation ensures that your system health is reflected in real time without human intervention. This setup reduces the risk of "All Systems Operational" appearing on your page while your main application is actually down.
How does a status page help with GDPR compliance?
A status page helps with GDPR compliance by providing a secure way to manage subscriber PII and offering regional data residency. Choosing a provider that allows EU-based hosting ensures that subscriber emails aren't transferred to jurisdictions with different privacy standards. This regionalized approach supports data sovereignty. It also helps meet transparency requirements under regulations like the Digital Operational Resilience Act (DORA).
What is a post-mortem and why should I publish it publicly?
A post-mortem is a technical document that analyzes the root cause, impact, and remediation steps of an incident. Publishing it publicly demonstrates a commitment to technical integrity and long-term improvement. It turns a service failure into a trust-building exercise by showing users exactly how you'll prevent the issue from recurring. Honest post-mortems are highly valued by technical peers and enterprise stakeholders.
Is it better to host my status page on a separate infrastructure?
Yes, it's a best practice to host your status page on infrastructure entirely separate from your primary application. If your main cloud provider suffers a total region outage, your status page must remain accessible to communicate with users. Using a geographically distinct hosting region, such as the EU if your main stack is in the US, provides the redundancy needed for reliable incident communication.


