

A status page isn't a trophy case for your 99.99% uptime. It's a shield for your engineering team when things actually break. Analyzing public status page examples shows that the best communicators don't just post a green checkmark. They use these pages to deflect support tickets and maintain user trust during the 0.1% of the time when things go wrong. Most technical teams know the dread of a minor API flicker turning into a flood of identical inquiries. It's frustrating to explain the same database lag forty times while you're trying to fix the root cause.
You likely want to focus on the recovery, not on repetitive inbox management. This article analyzes real-world patterns from companies that handle incidents with technical integrity. You'll learn how to structure updates that satisfy curious users and reduce support volume without the bloat of legacy enterprise tools. We'll break down effective communication patterns, look at cost-effective alternatives to complex pricing models, and provide templates you can use during your next high-pressure outage. By the end, you'll have a clear strategy to maintain trust even when your services are down.
Key Takeaways
- Identify the core technical components of a high-trust status page, including system health indicators and subscription options that deflect repetitive support inquiries.
- Analyze public status page examples from infrastructure leaders like Cloudflare and SaaS platforms like Slack to understand modular component reporting.
- Master incident communication patterns for the "Investigating" phase that prioritize technical honesty and clear status updates over marketing-heavy language.
- Evaluate the architectural risks of self-hosting status pages on your primary infrastructure and the benefits of using a dedicated, third-party monitoring provider.
- Learn how to automate transparency by integrating uptime monitoring with AI-assisted incident drafting to maintain consistency during high-pressure outages.
The Architecture of a High-Trust Public Status Page
A public status page is a technical communication hub. It is not a marketing asset designed to mask infrastructure failures. Its primary job is to provide high-fidelity data to users when your systems falter.
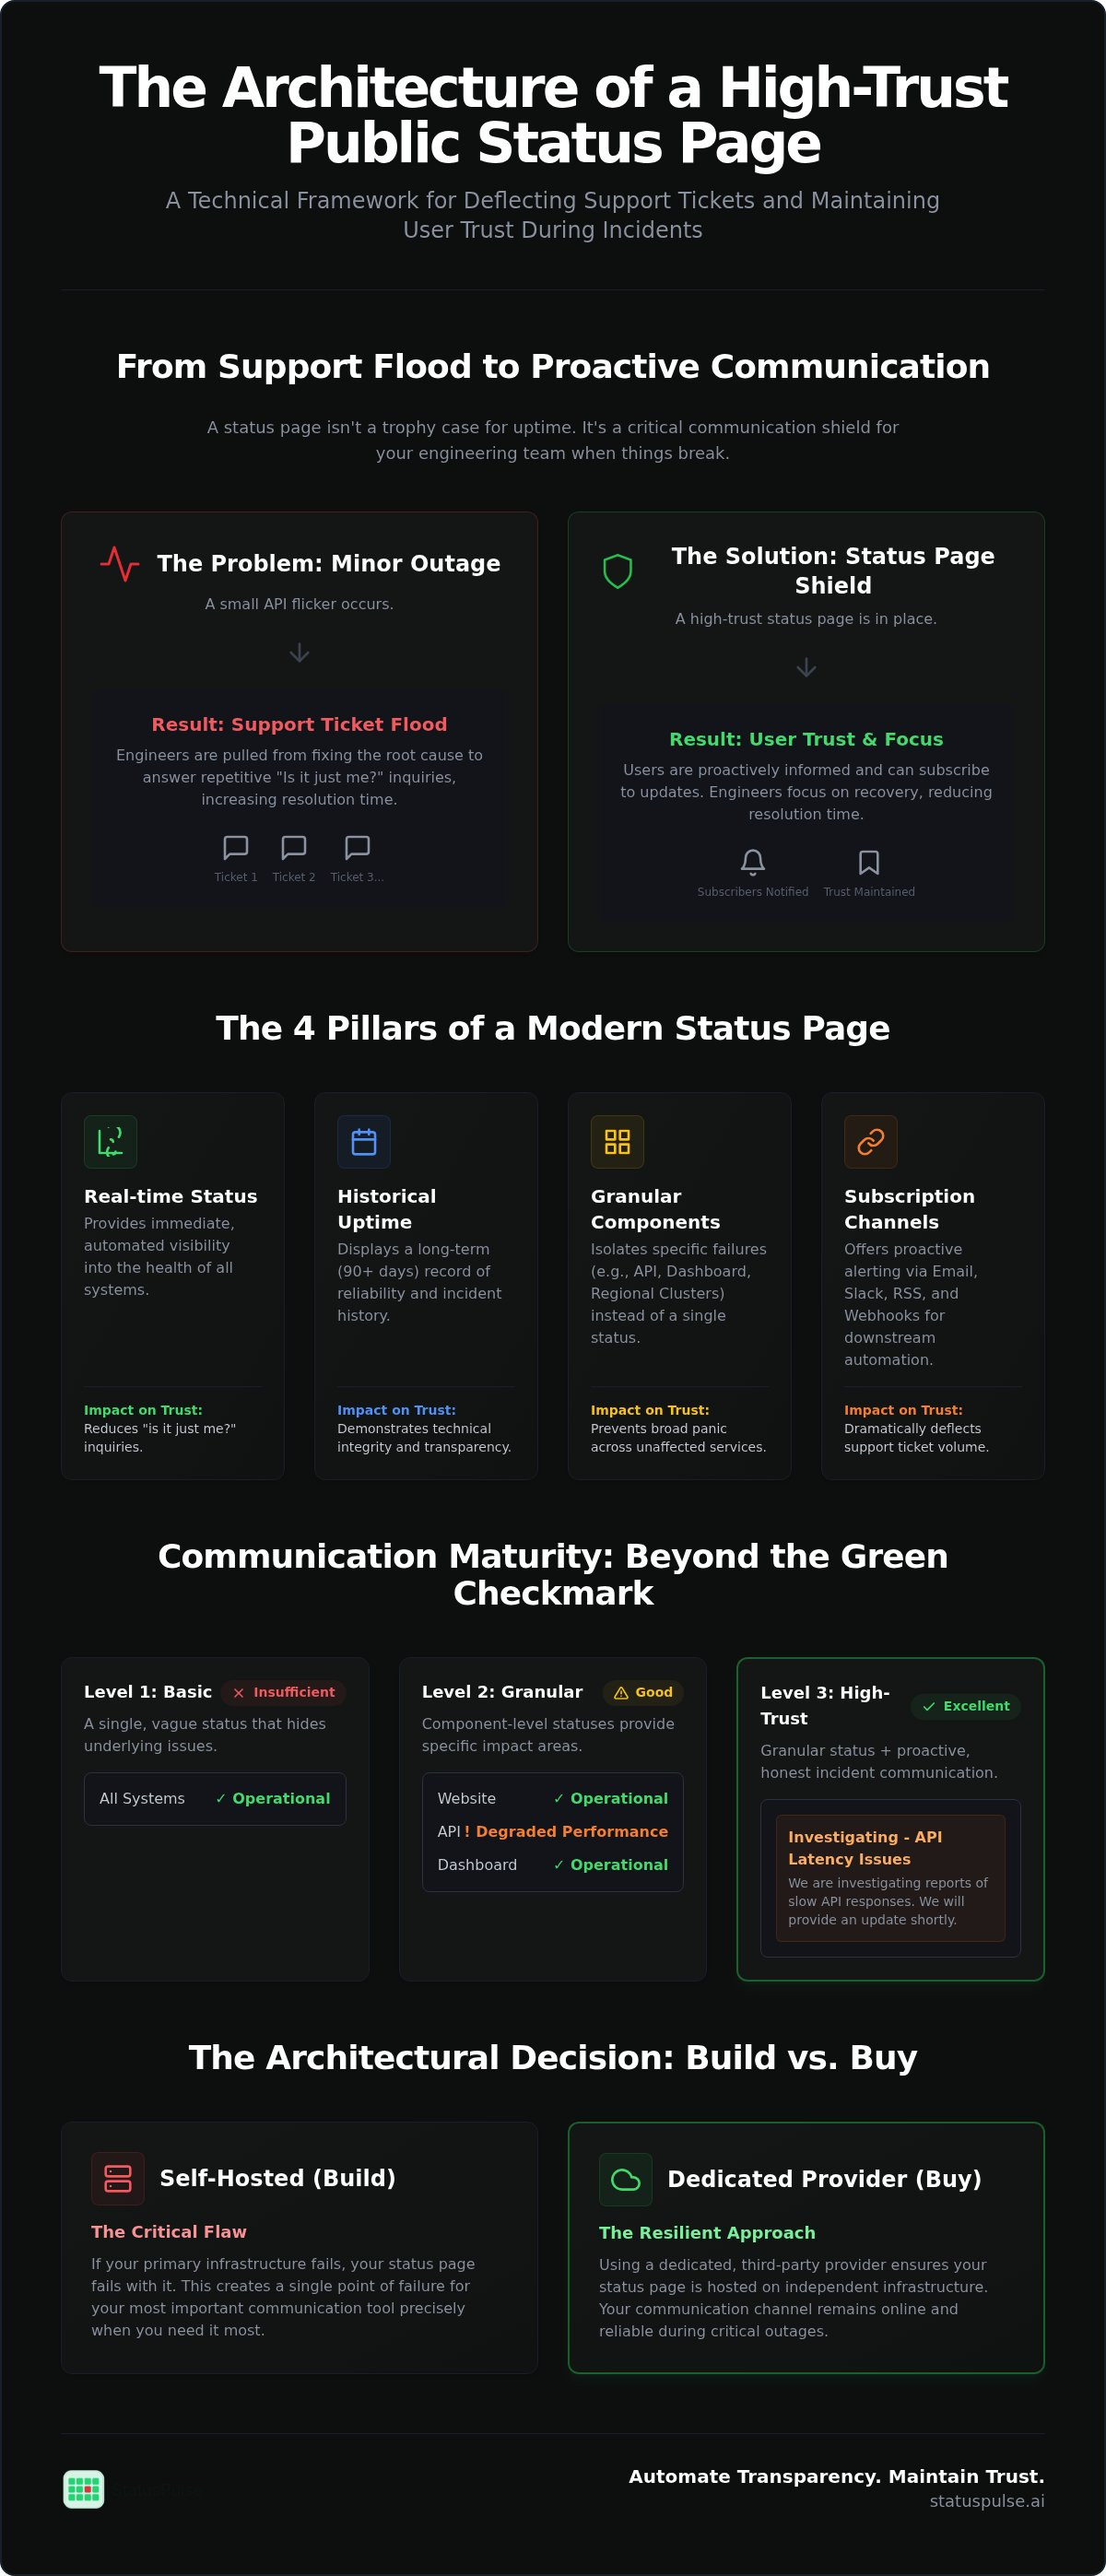
| Component | Technical Purpose | Impact on Trust |
|---|---|---|
| Real-time Status | Immediate health visibility | Reduces "is it just me?" inquiries |
| Historical Uptime | Long-term reliability record | Demonstrates technical integrity |
| Granular Components | Isolation of specific failures | Prevents broad panic across services |
| Subscription Channels | Proactive user alerting | Deflects support ticket volume |
Relying on a single green checkmark is no longer sufficient for modern, API-driven services. Users need to know exactly which component is failing. Effective public status page examples show that granular reporting builds more trust than a vague "operational" status.
Proactive communication deflects the repetitive inquiries that flood inboxes during a minor outage. By providing this transparency, technical teams can significantly reduce incoming support ticket volume. This allows engineers to focus on fixing the root cause rather than managing the inbox.
Functional Requirements for Technical Teams
Technical teams require component-level granularity. Separate the API, the web dashboard, and specific regional clusters. This allows developers to see if their specific integration is affected.
Displaying at least 90 days of history shows a commitment to integrity. It proves that you don't scrub the record when things get messy. Automation is equally vital; health indicators should reflect actual system performance without human delay. StatusPulse solves this by integrating uptime monitoring directly with your status page.
The Developer UX of a Status Page
The user experience of a status page should prioritize discovery and speed. Use a standard URL structure like status.yourdomain.com. This makes it the first place a developer looks when an endpoint returns a 500 error.
Support for RSS feeds and Webhooks is mandatory for automated downstream notifications. These tools allow your users to pipe your status updates directly into their own internal Slack channels. This reduces the "coordination tax" for your customers. Ensure the design is mobile-responsive for SREs who check status on-the-go.
Designing for transparency means acknowledging that downtime is inevitable. This architectural foundation ensures your status page remains a reliable source of truth when your primary infrastructure is under stress.
Analysis of Top Public Status Page Examples in 2026
Examining public status page examples reveals a clear divide between enterprise bloat and technical clarity. Infrastructure giants like Cloudflare and AWS manage communication at a massive scale. They don't just show a status; they provide global network maps. This level of detail helps SREs determine if a packet loss issue is global or confined to a specific peering point. These leaders prioritize data over design, ensuring that even during a peak traffic surge, the status page remains lightweight and accessible.
Infrastructure and DevTools Examples
GitHub provides a masterclass in managing expectations during complex CI/CD degradations. Instead of a generic "error" message, they specify which Actions runners or API endpoints are affected. DigitalOcean uses regional maps to show localized impact, which is essential for developers managing multi-region clusters. Vercel takes this further by linking status updates directly to deployment logs. This allows teams to see if their specific build failed due to a platform outage or an internal code error. This level of integration reduces the "is it just me?" anxiety that often follows a deployment failure.
High-Volume B2B SaaS Examples
SaaS leaders like Notion and Slack use modular component reporting. They break down services by function, such as "Search," "File Uploads," or "Messaging." Intercom groups services by logical user functions, helping non-technical stakeholders understand the impact on their daily workflows. Shopify demonstrates resilience by handling high-concurrency events like Black Friday with real-time throughput metrics. Loom provides specific updates on video processing delays, distinguishing between a total site outage and a background task bottleneck. These public status page examples succeed because they provide enough context to be useful without overwhelming the reader.
Fintech requires even higher precision. Coinbase uses localized status pages for global markets, acknowledging that a banking integration failure in Europe doesn't affect users in the US. This prevents unnecessary panic in unaffected regions. Most of these pages succeed because they prioritize honesty over aesthetics. They acknowledge that systems are complex and failures are inevitable.
Many teams find these enterprise dashboards too complex to maintain. If you want to replicate this level of transparency without the coordination tax, using StatusPulse allows you to automate these updates through direct monitoring integrations. It provides the same technical depth as the industry leaders but stays focused on simplicity and developer-friendly workflows. This approach ensures your communication remains as reliable as your monitoring.
Incident Communication Patterns: Beyond the Green Checkmark
Silence is the primary enemy of trust during an outage. Most public status page examples prioritize speed over perfect information. You don't need a full Root Cause Analysis (RCA) to post your first update. Use the "Investigating" status immediately to signal that your team is active.
Honesty beats hype every time. Avoid calling a total database failure a "minor hiccup." Technical users value precise language like "degraded performance" or "increased latency" because it helps them understand the scope of the impact.
Frequency matters as much as content. During a multi-hour outage, aim for updates every 30 to 60 minutes. Even if you have no new technical details, tell your users that the investigation is ongoing. This prevents the "zombie status page" effect where users wonder if the team has gone home.
Once the incident is resolved, the communication isn't over. Publishing a technical post-mortem directly on the status page demonstrates accountability. It shows you've identified the failure point and are implementing specific guardrails to prevent a recurrence.
Drafting Effective Technical Updates
Every update should follow a predictable anatomy: Status, Impact, and Next Steps. Clearly state what is broken, who is affected, and what your team is doing right now. This structure removes the guesswork for your users.
Avoid internal jargon that doesn't help the customer. Instead of saying "Node 4 in cluster B is OOMing," say "We are scaling our processing layer to handle a memory exhaustion issue." For a deeper dive into these strategies, see our guide on The Architecture of Incident Communication Transparency.
Managing User Expectations via Subscriptions
Communication is only effective if it reaches the user. Developers often prefer Slack or Webhook notifications over email. SMS is useful for P0 emergencies but can lead to alert fatigue if overused.
High-quality public status page examples allow for segmented notifications. Users should be able to subscribe only to the components they use. This precision protects your reputation and ensures your alerts are taken seriously.
StatusPulse manages these subscriptions without per-subscriber fees. This allows you to scale your communication as your user base grows without worrying about a ballooning bill. This flat pricing model encourages you to be more transparent, not less.
Building vs. Buying: Technical Trade-offs and Implementation
Choosing between a custom-built solution and a managed service involves more than just a cost calculation. DIY status pages are tempting for small projects, but they often suffer from circular dependencies. If you host your status page on the same infrastructure as your primary application, an outage likely takes both offline. A status page that is down during a crisis is worse than having no page at all. While you can mitigate this by hosting a static site on a separate cloud provider, you lose the technical depth found in professional public status page examples, such as automated component transitions and subscriber management.
Managed solutions offer reliability through infrastructure isolation. However, many industry incumbents introduce corporate bloat through complex pricing. Charging per-subscriber is a common practice that penalizes transparency. If your user base grows, your communication costs shouldn't spike. For technical teams in Europe, data sovereignty is another non-negotiable factor. Many US-based providers don't offer a choice of hosting region, which can create compliance friction. A modern approach involves using website uptime monitoring tools that allow you to select your data residency while keeping your status page independent from your app's health.
Implementation Checklist for DevOps Teams
- CNAME and SSL: Configure a dedicated subdomain like status.example.com. Ensure your provider handles SSL certificate rotation automatically.
- Monitoring Integration: Connect your uptime monitors directly to your status components. This removes the manual coordination tax during an incident.
- Incident Lead: Define who owns the communication. This person should be separate from the engineer fixing the root cause to ensure updates stay frequent.
Comparing Legacy vs. Modern Status Tools
Legacy providers are often characterized by high entry costs and per-subscriber fees. Their interfaces can feel dated and clunky for modern SRE workflows. Modern, developer-friendly tools prioritize API-first architectures and AI-assisted drafting for incident updates. These tools treat status pages as a functional extension of your monitoring stack rather than a standalone marketing site. If you're tired of unpredictable billing and want a tool built by specialists, you can launch a status page with StatusPulse today. It offers flat pricing and the choice between EU or US hosting to respect your data sovereignty requirements.
Automating Transparency with StatusPulse
Automation in public status page examples often fails due to a lack of direct integration between monitors and health indicators. When health checks are decoupled from the display layer, the status page becomes a manual burden during a P0 incident. Integrating these layers ensures that status transitions occur based on actual probe results in real-time.
Choosing between EU and US hosting is a critical architectural decision for data sovereignty. European teams often face legal friction when incident data is stored exclusively on US-based infrastructure. Dedicated regional hosting allows you to maintain compliance while keeping communication low-latency for your local user base.
Scaling incident communication often hits a "transparency tax" when using legacy tools that charge per-subscriber. This pricing model forces teams to decide which users are important enough to receive alerts. StatusPulse avoids this by offering flat pricing, ensuring your communication remains as wide-reaching as your monitoring.
AI-Assisted Incident Drafting
During high-pressure outages, SRE cognitive load is a major bottleneck for clear communication. Engineers often struggle to translate raw monitor logs into readable updates while actively debugging a root cause. AI tools can act as assistants by parsing these logs to generate initial draft summaries.
A human-in-the-loop approach is essential for maintaining technical accuracy and a consistent brand voice. The AI drafts the update, but a human lead verifies and publishes the final text. This ensures that the technical integrity of your public status page examples remains high without slowing down the response time.
The All-in-One Monitoring Stack
Consolidating API and SSL monitoring into the same dashboard as your status page reduces the coordination tax during an incident. You can link API Monitoring directly to public components for real-time visibility. This automation ensures that certificate expirations or endpoint failures are reported before they become critical outages.
Managing your infrastructure communication shouldn't be as complex as the infrastructure itself. You can start your transparent status page with StatusPulse to unify your monitoring and communication workflows. It provides the technical depth of an enterprise tool with the simplicity required for fast-moving DevOps teams.
Standardizing Your Incident Response Patterns
A reliable status page is more than a technical requirement; it's a commitment to your users. High-quality public status page examples demonstrate that transparency is a competitive advantage, not a liability. By moving away from manual updates and adopting automated monitoring, you significantly reduce the support burden on your SREs. You also ensure that your customers receive the technical precision they expect during an outage. This architectural shift allows your team to focus on the recovery instead of managing an overflowing inbox.
Managing these incidents shouldn't involve corporate bloat, complex pricing, or per-subscriber fees. You can maintain data sovereignty with a choice between EU or US hosting while utilizing AI-powered incident drafting to keep your updates consistent. This approach respects your team's time and your users' privacy. It's a straightforward way to replace legacy enterprise tools with a solution built for technical integrity. By prioritizing honesty over marketing hype, you turn every disruption into an opportunity to prove your reliability.
If you're ready to simplify your stack and maintain your reputation under pressure, you can build an honest status page with StatusPulse today. Standardize your communication and start building deeper trust with every update.
Frequently Asked Questions
What should be included in a public status page?
A high-trust status page must include component-level health indicators, a transparent incident history, and clear subscription options for users. Components should be granular, separating the API from the web dashboard or regional clusters. Including 90 days of uptime history builds credibility. Subscription methods like Slack, email, or webhooks ensure users receive updates on their preferred channels. These elements are standard in effective public status page examples used by industry leaders.
How often should I update my status page during an incident?
You should update your status page every 30 to 60 minutes during a major outage. Even if there is no new technical progress, a brief post stating that the investigation continues prevents user anxiety. Silence suggests your team is inactive. Frequent updates maintain the "heartbeat" of the incident. This rhythm keeps stakeholders informed and reduces the pressure on your support team while engineers focus on the root cause.
Should I automate my status page updates?
Automating status transitions from "Operational" to "Degraded" is highly recommended to ensure real-time accuracy. Human intervention during a P0 incident often leads to delays. However, incident descriptions should remain manual or human-verified to provide technical context. StatusPulse integrates uptime monitoring directly with status components to handle these transitions automatically. This hybrid approach ensures the page reflects reality without sacrificing the nuance of human communication during a crisis.
Is it better to host a status page on a separate domain?
It's safer to host your status page on a separate domain and infrastructure. If your primary app and status page share the same environment, a total infrastructure failure will take both offline. Using a CNAME like status.yourdomain.com pointed to a third-party provider ensures the page remains accessible when your users need it most. This architectural isolation is a common pattern in public status page examples from resilient SaaS companies.
How do I reduce support tickets using a status page?
Reducing support tickets requires proactive updates and granular component reporting. When users see that you've already acknowledged an issue with a specific API endpoint, they're less likely to open a duplicate inquiry. Placing a prominent link to your status page in your help center and app header deflects "is it just me?" questions. Clear communication during the "Investigating" phase can reduce ticket spikes by significant margins during an active incident.
What is a post-mortem and should I post it publicly?
A post-mortem is a technical Root Cause Analysis that explains why an incident happened and how you'll prevent it. Posting these publicly demonstrates accountability and technical maturity. It transforms a service failure into a trust-building exercise. A good public post-mortem includes a timeline, the identified failure point, and specific remediation steps. This transparency reassures enterprise customers that your team is meticulous and principled about platform reliability.
Can AI help with incident communication?
AI can assist by drafting incident updates based on monitor logs and error patterns. This reduces the cognitive load on SREs who are under pressure. However, the AI should function as an assistant, not an autonomous agent. A human should always verify and publish the draft to ensure the tone remains professional and accurate. StatusPulse uses AI incident management to help teams maintain a consistent communication cadence during stressful disruptions.
What is the difference between a public and private status page?
A public status page communicates health to your end-users and the general public. A private status page is restricted to internal stakeholders or specific enterprise clients via authentication. Private pages often include more sensitive technical details or internal-only components. While public pages focus on transparency and trust, private pages serve as a coordination tool for internal teams and account managers during service degradations or maintenance windows.


