

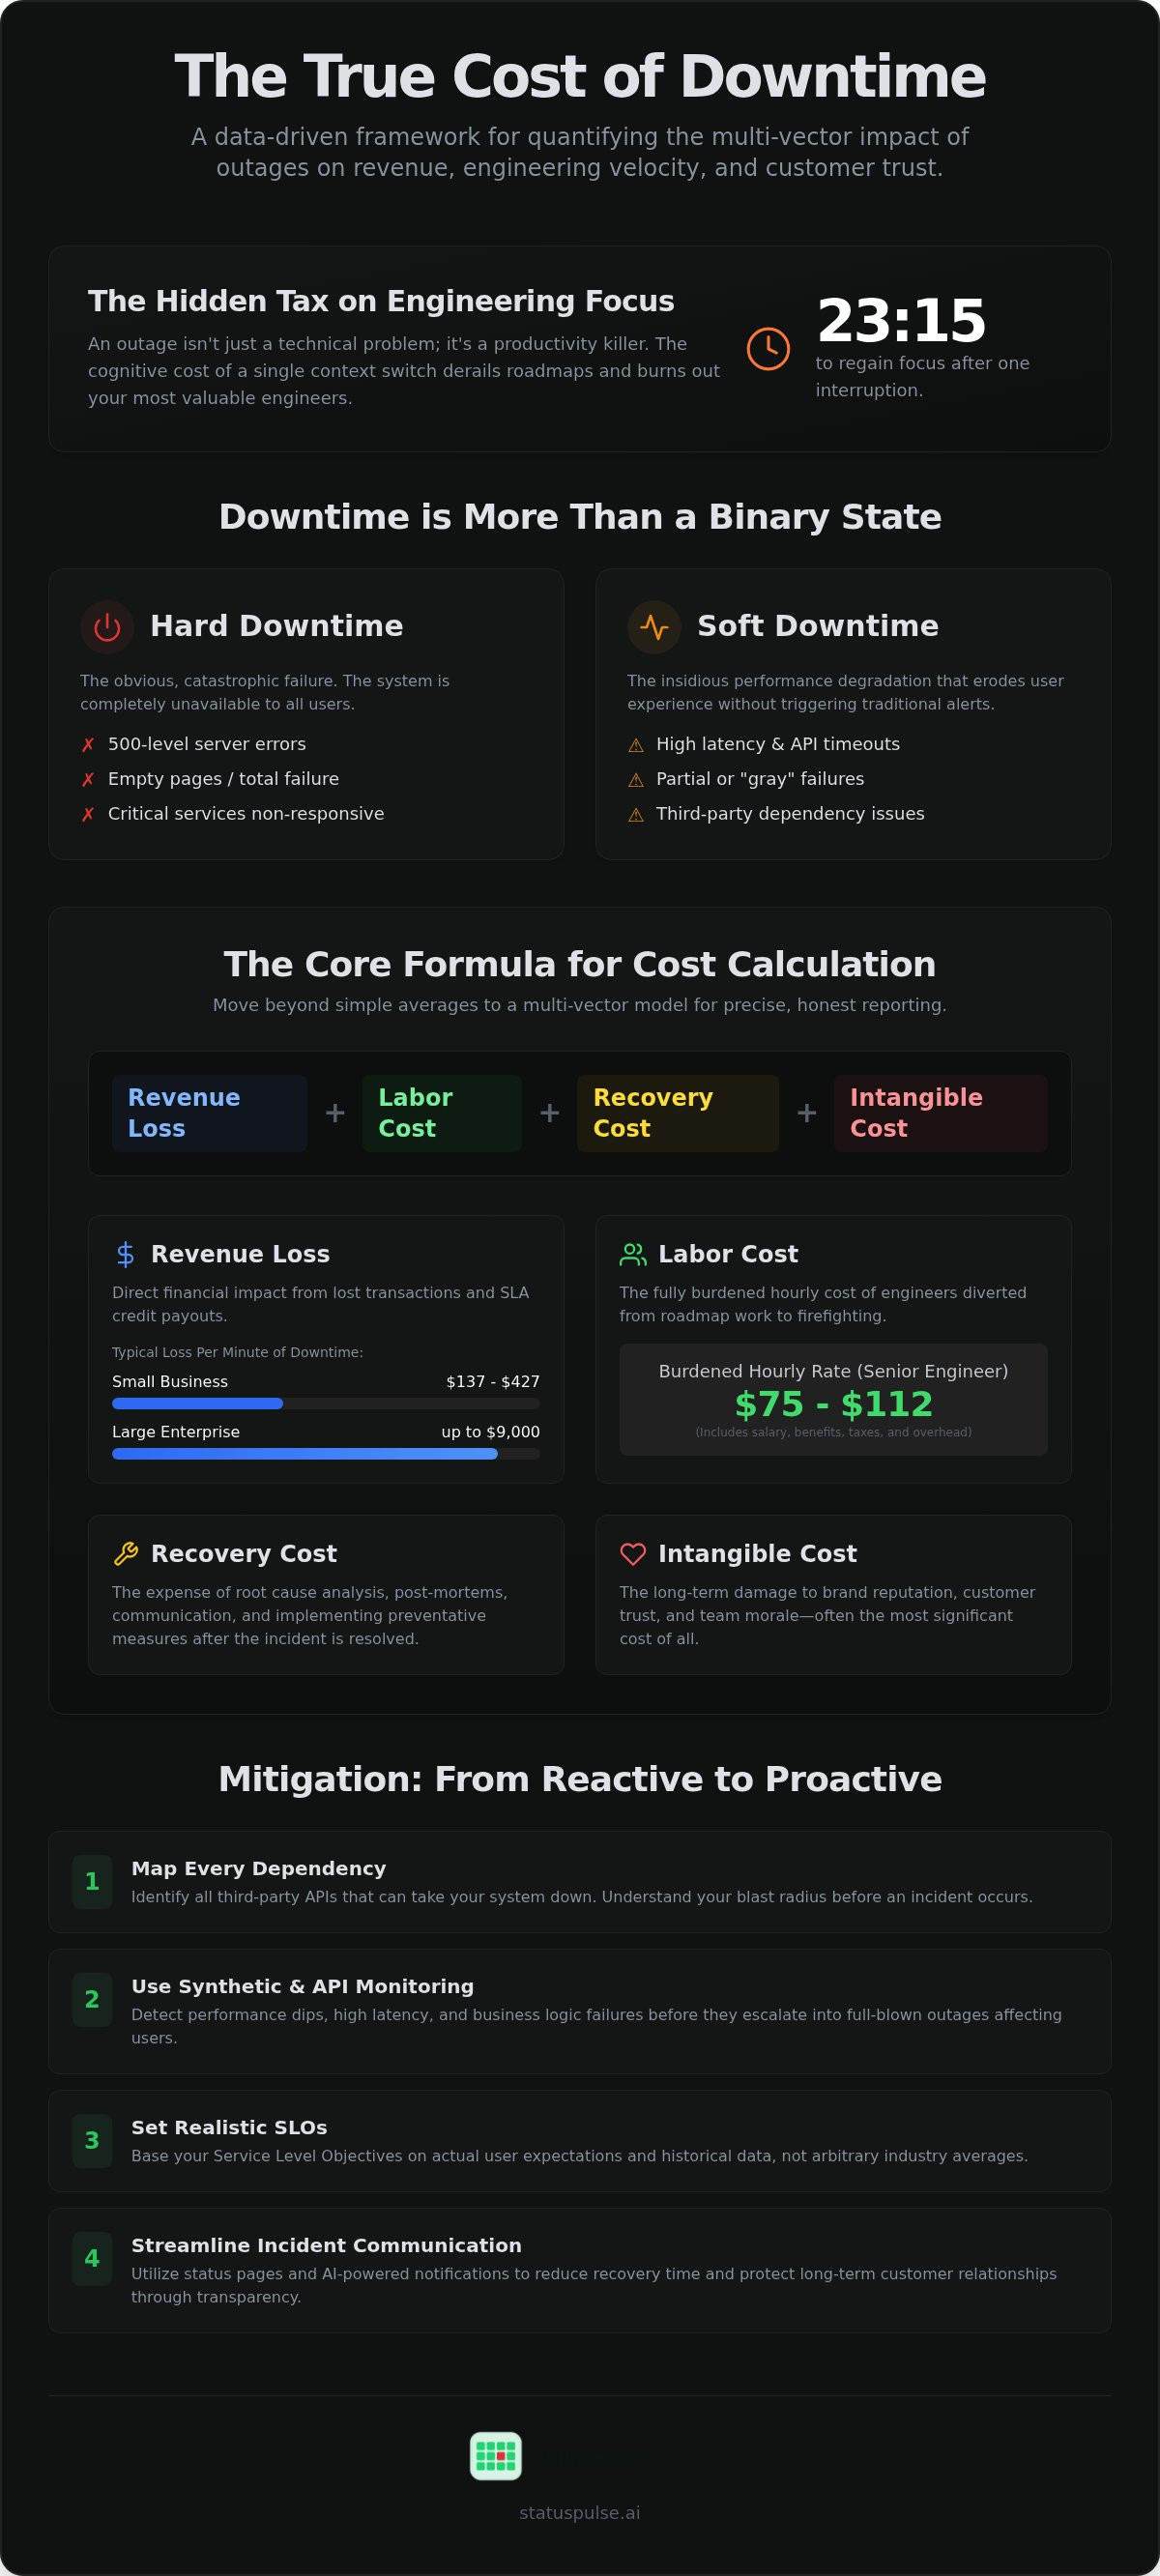
It takes exactly 23 minutes and 15 seconds for a senior engineer to regain focus after a single interruption. When an outage hits, that timer starts for your entire team. Most leaders focus only on lost transactions, but the real damage is often invisible. Calculating cost of downtime requires looking past the immediate revenue dip to see the multi-vector impact on your roadmap and your reputation.
We understand the pressure to provide hard numbers to management. It's difficult to quantify the opportunity cost of fixing bugs instead of building features. You need more than a guess; you need a framework. This article provides a repeatable formula for internal reporting. We'll explore the hidden technical costs of context switching and the long-term price of customer churn. You will learn how to build a data-driven business case for proactive monitoring that protects your revenue and your team’s focus. We'll move from vague estimates to precise, honest accounting. It is time to treat uptime as a core virtue of your engineering culture rather than a marketing afterthought.
Key Takeaways
- Identify soft downtime. High latency and API timeouts erode user experience without triggering a total blackout.
- Apply a data-driven formula for calculating cost of downtime. Account for direct revenue, engineering labor, recovery efforts, and intangible trust loss.
- Measure the 23-minute focus penalty. Quantify how outages drain engineering velocity and delay critical feature releases.
- Mitigate financial risk. Align uptime with GDPR availability requirements to minimize SLA penalty payouts and regulatory exposure.
- Reduce recovery time. Use proactive monitoring and AI-powered notifications to streamline communication and protect long-term customer relationships.
Defining Downtime Beyond the Binary Up/Down State
Traditional views of Downtime often fail modern engineering teams. They focus on binary states: is the server on or off? In reality, downtime is any state where a Service Level Objective (SLO) is consistently breached. This includes partial outages, degraded performance, and third-party failures. If your checkout service is live but your payment gateway is timing out, you're down. If your API responds in five seconds instead of 200ms, you're down. Precision in calculating cost of downtime starts with moving past this green-light-red-light mentality. You can't fix what you haven't defined with precision.
Hard Downtime is obvious. It shows up as 500 errors, empty pages, and massive spikes in your error logs. Soft Downtime is more insidious. High latency, API timeouts, and "zombie" processes create a frustrating user experience that drives churn without triggering traditional "up" alerts. When you begin calculating cost of downtime, ignoring these soft failures leads to underestimating your real financial risk. Monitoring your application logs and third-party dependencies is critical. It provides the complete view required for an honest audit of your system’s health.
The Gray Failure Trap
A status page showing 99.9% uptime can be a lie. High-throughput APIs often suffer from "gray failures." These are silent issues where the infrastructure appears healthy, but specific business logic is failing. Users might be able to log in but find themselves unable to complete transactions. This silent failure is why API monitoring is essential. It moves beyond basic ping tests to ensure your core business functions are actually operational. It's about honesty in reporting rather than hitting a vanity metric. Don't hide behind a green checkmark when your users are struggling.
Establishing Your Baseline
- Map every dependency. Know exactly which third-party APIs can take your system down.
- Use synthetic monitoring. Detect performance dips and latency spikes before they escalate into full outages.
- Set realistic SLOs. Base these on actual user expectations and historical data, not arbitrary industry averages.
Understanding these baselines is the first step in calculating cost of downtime with accuracy. It ensures your internal reporting reflects the human and financial reality of the incident. It builds trust with management by showing you have a logical, data-driven framework for reliability. You move from defensive guessing to principled, evidence-based leadership.
The Core Formula: Quantifying Direct Revenue and Labor Loss
Most businesses use a simple average. They divide annual revenue by 8,760 hours. This is lazy math. It ignores peak traffic and the true cost of downtime. To be precise when calculating cost of downtime, you need a multi-vector formula. The math looks like this:
Total Cost = (Revenue Loss) + (Labor Cost) + (Recovery Cost) + (Intangible Cost)
Precision requires looking at your Burdened Labor Cost. Burdened Labor Cost is the total expense of an employee, including their base salary, benefits, payroll taxes, and allocated overhead. For a senior software engineer in 2026, the fully loaded hourly rate sits between $75 and $112. When you use this number instead of just a base salary, the financial impact of an outage scales quickly.
Calculating Direct Revenue Loss
Start with your Revenue per Hour (RPH). Don't settle for a flat average. Calculate RPH for peak times versus off-peak. Research shows small businesses typically lose between $137 and $427 per minute of downtime. Large enterprises can see losses as high as $9,000 per minute. Identify your Average Transaction Value (ATV) to map conversion rate drops to hard dollars.
Understand the difference between "Delayed" and "Lost" revenue. In e-commerce, downtime usually means lost revenue; the customer simply buys elsewhere. In SaaS, revenue might be delayed, but the incident triggers SLA credits. These contractual penalties can turn a minor four-hour outage into a massive liability for enterprise accounts. Tracking these metrics with uptime monitoring ensures you have the data needed for accurate reporting.
Quantifying Idle Employee Productivity
When internal tools fail, productivity drops. Use this formula: (Number of Impacted Employees) x (Average Hourly Rate) x (Productivity Factor). The productivity factor is rarely 100%. Employees find workarounds, like checking email or updating local documentation. However, the cognitive load is real. Differentiating between customer-facing downtime and internal tool failure is vital. If your engineers are firefighting, they aren't building new features. That opportunity cost is a silent killer for engineering velocity. When calculating cost of downtime, you must include these lost development cycles.
The Hidden Tax: Engineering Context Switching and Opportunity Cost
Revenue loss is only the surface. For engineering teams, the deepest damage happens in the hours following a resolution. When an incident occurs, it doesn't just stop production. It shatters focus. Research shows it takes an average of 23 minutes and 15 seconds for a developer to fully regain focus after an interruption. If an outage pulls five senior engineers into a war room, you aren't just losing the duration of the outage. You're losing the cognitive momentum of your most expensive talent. This "Context Switching Penalty" is a primary factor in calculating cost of downtime that most spreadsheets ignore.
Every incident carries a fixed overhead known as Post-Mortem Labor. This is the time required to investigate, document, and discuss the failure. It is non-negotiable for a healthy culture, but it is expensive. If three engineers spend four hours on a retrospective, that is 12 hours of senior-level salary vanished. These are hours not spent on your product roadmap. This opportunity cost is the value of features that were never built because the team was stuck in "firefighting" mode. Over time, frequent incidents lead to burnout and attrition. Replacing a senior engineer costs significantly more than any monitoring tool.
The Engineering Velocity Drain
One hour of downtime often results in ten hours of technical debt cleanup. Emergency hotfixes are rarely elegant. They're built for speed, not sustainability. These "quick fixes" must eventually be refactored, or they will slow down every future release. This creates a vicious cycle where releases are delayed to fix the fixes. Following an uptime monitoring guide for developers helps teams move toward proactive reliability. It shifts the focus from reactive panic to honest, data-driven communication. This protection of engineering velocity is a core business virtue.
The Incident Management Overhead
Incident management requires a specialized crew. You pay for the "Incident Commander," SREs, and Support staff to drop everything. Their labor costs during the event are just the beginning. The "Blameless Post-Mortem" process is essential for long-term stability, but it consumes dozens of productive hours. Using AI incident management tools can help. These assistants reduce the time spent drafting manual updates and gathering logs. By streamlining communication, you reduce the "Mean Time to Notify" and lower the overall recovery cost. Efficiency in these moments is what separates principled teams from corporate bloat. It keeps your specialists focused on what they do best: building.
Risk and Compliance: EU Data Sovereignty and SLA Penalties
Revenue and labor are immediate losses. Compliance is the long-term shadow. When calculating cost of downtime, engineering teams often overlook the regulatory consequences of an outage. GDPR mandates not just confidentiality, but also the "availability and resilience" of systems. Under Article 32, a persistent lack of availability can be classified as a personal data breach. This isn't a theoretical risk. In 2025 alone, European regulators issued €1.2 billion in GDPR penalties. For severe violations, the maximum fine is €20 million or 4% of global annual revenue. If your system is down, your legal exposure is up.
GDPR and the Availability Mandate
A "Personal Data Breach" doesn't always mean a hack. It includes the accidental or unlawful loss of access to data. If downtime prevents users from accessing critical information, you may be required to notify national regulators within 72 hours. This triggers an expensive chain of events. You'll need forensic audits and legal consultations to prove the data remained secure during the blackout. For European firms, US-based dependencies are a unique liability. If a US provider fails, you're still responsible for your data sovereignty obligations. Choosing uptime monitoring with EU-based hosting options helps you maintain this compliance without the corporate bloat of legacy providers.
SLA Credit Calculations
Service Level Agreements (SLAs) are financial landmines. A 99.9% uptime guarantee allows for roughly 43 minutes of downtime per month. When calculating cost of downtime for enterprise clients, a four-hour outage is a massive breach of contract. Most enterprise agreements use tiered credit systems. These often start at 10% of the monthly bill and can climb to 50% for major incidents. The administrative cost of processing these manual refund requests is a hidden tax on your support and finance teams. It involves hours of cross-referencing logs with billing cycles.
Managing these expectations requires honesty. Transparent status pages allow you to communicate the scope of an incident in real-time. This proactive approach often prevents the flood of manual credit requests that follow a silent failure. It's about treating your customers like partners rather than ticket numbers. Clear communication reduces the "Trust Tax" and keeps your focus on recovery rather than damage control.
Capping Costs: Reducing Recovery Time and Trust Erosion
Calculating cost of downtime is an exercise in damage assessment. But the goal is capping that damage. The most persistent expense is the Trust Tax. When users are left in the dark, they don't just complain; they churn. This erosion of trust is the hardest variable to quantify, yet it carries the highest long-term price. Reducing your Mean Time to Repair (MTTR) is the only direct way to lower the Revenue Loss vector in our core formula. Proactive website availability monitoring ensures you are the first to know, not your customers. Speed is the only defense against reputation decay.
When calculating cost of downtime for your quarterly reports, remember that every minute of silence adds to the Trust Tax. Honest communication is a business asset. It transforms a technical failure into a demonstration of integrity. By moving quickly, you prevent the incident from scaling into a brand-threatening event.
Preventing the Support Ticket Storm
Outages create a secondary crisis in the inbox. A single support ticket costs between $15 and $25 on average. During a major incident, these tickets arrive in waves. Five hundred tickets can drain $10,000 in support labor. A public status page update costs nearly zero. Automated status updates act as a pressure valve. They deflect the "Support Ticket Storm" before it begins. AI-assisted incident management further reduces the burden. It generates summaries that save hours of manual PR work. This allows your team to provide transparent communication without diverting focus from the technical recovery. Trust is earned through clarity, not silence.
Building a Proactive Monitoring Stack
The ROI of 1-minute uptime checks is immediate. A 5-minute interval can hide a 4-minute outage that still impacts users and triggers SLA penalties. High-frequency checks allow you to catch performance dips before they become blackouts. It is about precision. StatusPulse is a cost-capping tool for these moments. Our flat pricing model is a deliberate choice. We don't believe in charging a "Subscriber Tax" during high-traffic events. Many competitors charge per-subscriber. This means your costs spike exactly when your system is failing. We find that practice unethical. It punishes you for having a large audience during a crisis. When calculating cost of downtime, don't forget to account for these hidden vendor costs.
- 1-minute checks: Catch intermittent failures that 5-minute windows miss.
- Flat pricing: Avoid surprise bills when your subscriber count spikes during an outage.
- Global hosting: Choose EU or US nodes to match your data sovereignty requirements.
Start monitoring with StatusPulse to protect your engineering velocity and customer trust. Precision monitoring should be straightforward, fair, and reliable.
Turn Downtime Data into Engineering Velocity
Precision in calculating cost of downtime is the difference between guessing and leading. You've seen how "gray failures" and context switching drain more than just your bank account; they drain your team's momentum. By accounting for burdened labor and the invisible trust tax, you build a business case that management cannot ignore. Reliability isn't just a technical metric. It is an ethical commitment to your users and your specialists. Every minute saved in recovery is a minute returned to your product roadmap.
Protecting your velocity requires tools that prioritize transparency over corporate bloat. StatusPulse offers EU-based hosting for true data sovereignty and AI-powered incident management to slash your notification times. We don't believe in per-subscriber fees that punish you for growth during a crisis. It is time to reclaim your focus and move past the stress of reactive firefighting. Calculate your monitoring ROI with StatusPulse and start building with confidence. Your team deserves the clarity of a proactive monitoring stack that works as hard as they do. Stay principled and stay up.
Frequently Asked Questions
How do you calculate the hourly cost of downtime for a small business?
Small businesses typically lose between $137 and $427 per minute during an outage. To find your hourly rate, multiply your average transaction value by the number of sales usually processed in sixty minutes. Add your burdened labor costs for idle staff. This provides a baseline for calculating cost of downtime. It's a grounded way to show management the immediate financial impact without using generic enterprise averages.
What is the "Context Switching Penalty" in downtime calculations?
The penalty is the 23 minutes and 15 seconds a developer needs to regain deep focus after an interruption. During an outage, this timer resets for every engineer involved in the war room. If five engineers are pulled away from their roadmap, you lose nearly two hours of collective high-level productivity just to get back into the "flow" state. This is a massive drain on engineering velocity.
Does GDPR require me to report downtime to authorities?
GDPR Article 32 mandates the "availability and resilience" of processing systems. If an outage results in a permanent or temporary loss of access to personal data, it may be classified as a personal data breach. You must notify regulators within 72 hours if the incident puts user rights at risk. This legal requirement makes uptime a compliance virtue, not just a technical goal.
What is the difference between tangible and intangible downtime costs?
Tangible costs are direct, measurable expenses like lost checkout revenue, SLA penalty payouts, and burdened labor rates. Intangible costs are harder to quantify but often more damaging. These include trust erosion, brand degradation, and the long-term impact of customer churn. A single technical failure can trigger a "Trust Tax" that persists long after the systems are back online.
How much does a support ticket cost compared to a status page update?
A single support ticket costs between $15 and $25 on average in labor and overhead. During a major incident, hundreds of tickets can arrive simultaneously. A status page update costs nearly zero per user. By using a public status page, you deflect the "Support Ticket Storm" and allow your support team to focus on complex cases rather than repetitive status queries.
Can I include engineering burnout in my downtime cost report?
You should include it. Frequent, high-stress incidents lead to engineer attrition. The cost to recruit and onboard a senior developer is a significant capital expense that often exceeds $100,000. High-stress on-call rotations are a primary driver of burnout. Mapping the frequency of outages to team turnover provides a more honest view of the total cost to the business.
What is a "Productivity Factor" in labor cost formulas?
The productivity factor is a decimal between 0 and 1 that represents how much work an employee can still perform during an outage. If internal tools are down but staff can still answer emails, the factor might be 0.4. This ensures your math stays realistic. It acknowledges that employees often find workarounds rather than sitting completely idle during technical disruptions.
Why is Mean Time to Notify (MTTN) as important as Mean Time to Repair (MTTR)?
MTTR measures your technical recovery, but MTTN measures your relationship with your customers. Reducing the Mean Time to Notify stops the spread of misinformation. Using AI incident management tools to alert users quickly builds "earned trust." It proves you are in control of the situation. A fast notification often prevents a minor glitch from becoming a PR disaster.


