

What if your MTTR is falling because incident updates are faster, while users still wait just as long for service to recover? Learning how to lower MTTR starts with separating communication from the work that restores service. A single number can hide delays between detection, triage, mitigation, and verification.
When alerts are scattered across tools and teams, a reported improvement may not match what customers experience. Faster notifications can help people coordinate, but they don’t prove that a service is healthy again. You need a consistent definition of recovery and timestamps that show where time is actually being spent.
This guide explains how to set an MTTR definition and baseline, break the incident lifecycle into measurable stages, and find the bottlenecks worth addressing first. You’ll also learn how to choose process or tooling changes, from clearer escalation ownership to better alert routing, then check whether they shorten recovery rather than just speeding up updates. The goal isn’t to chase a lower number at any cost. It’s to restore service sooner and understand what changed.
Key Takeaways
- Define which incidents count and set clear start and end points before comparing MTTR across teams or time periods.
- Use how to lower MTTR as a practical question: find the slowest incident stage, then target its specific cause.
- Separate detection, acknowledgement, diagnosis, mitigation, restoration, and verification to see where response time accumulates.
- Test one change at a time, such as a clearer runbook or escalation path, and review stage-level data to see whether it helped.
- Use monitoring and incident tools to support earlier detection and clearer ownership, not as substitutes for diagnosis or recovery.
Why MTTR stays high: find the delays behind the incident
A checkout service starts returning errors, but the first alert shows only elevated latency. The on-call engineer checks the dashboard, customer support reports failed purchases, and a second team investigates a recent change. Until someone confirms the impact, names an incident owner, and agrees on the next action, the outage clock keeps running.
MTTR is an umbrella term, not a universally fixed measurement. It may mean mean time to repair, resolve, or recover, and those labels can refer to different start and end events. The Mean time to repair (MTTR) overview describes its use in reliability and maintenance contexts. An incident-response team still needs to document exactly what its own number includes.
A lower measured MTTR is not, by itself, proof that reliability improved. The number can fall because a team changed its measurement boundaries, even if users still experience the same disruption.
Where incident response loses time
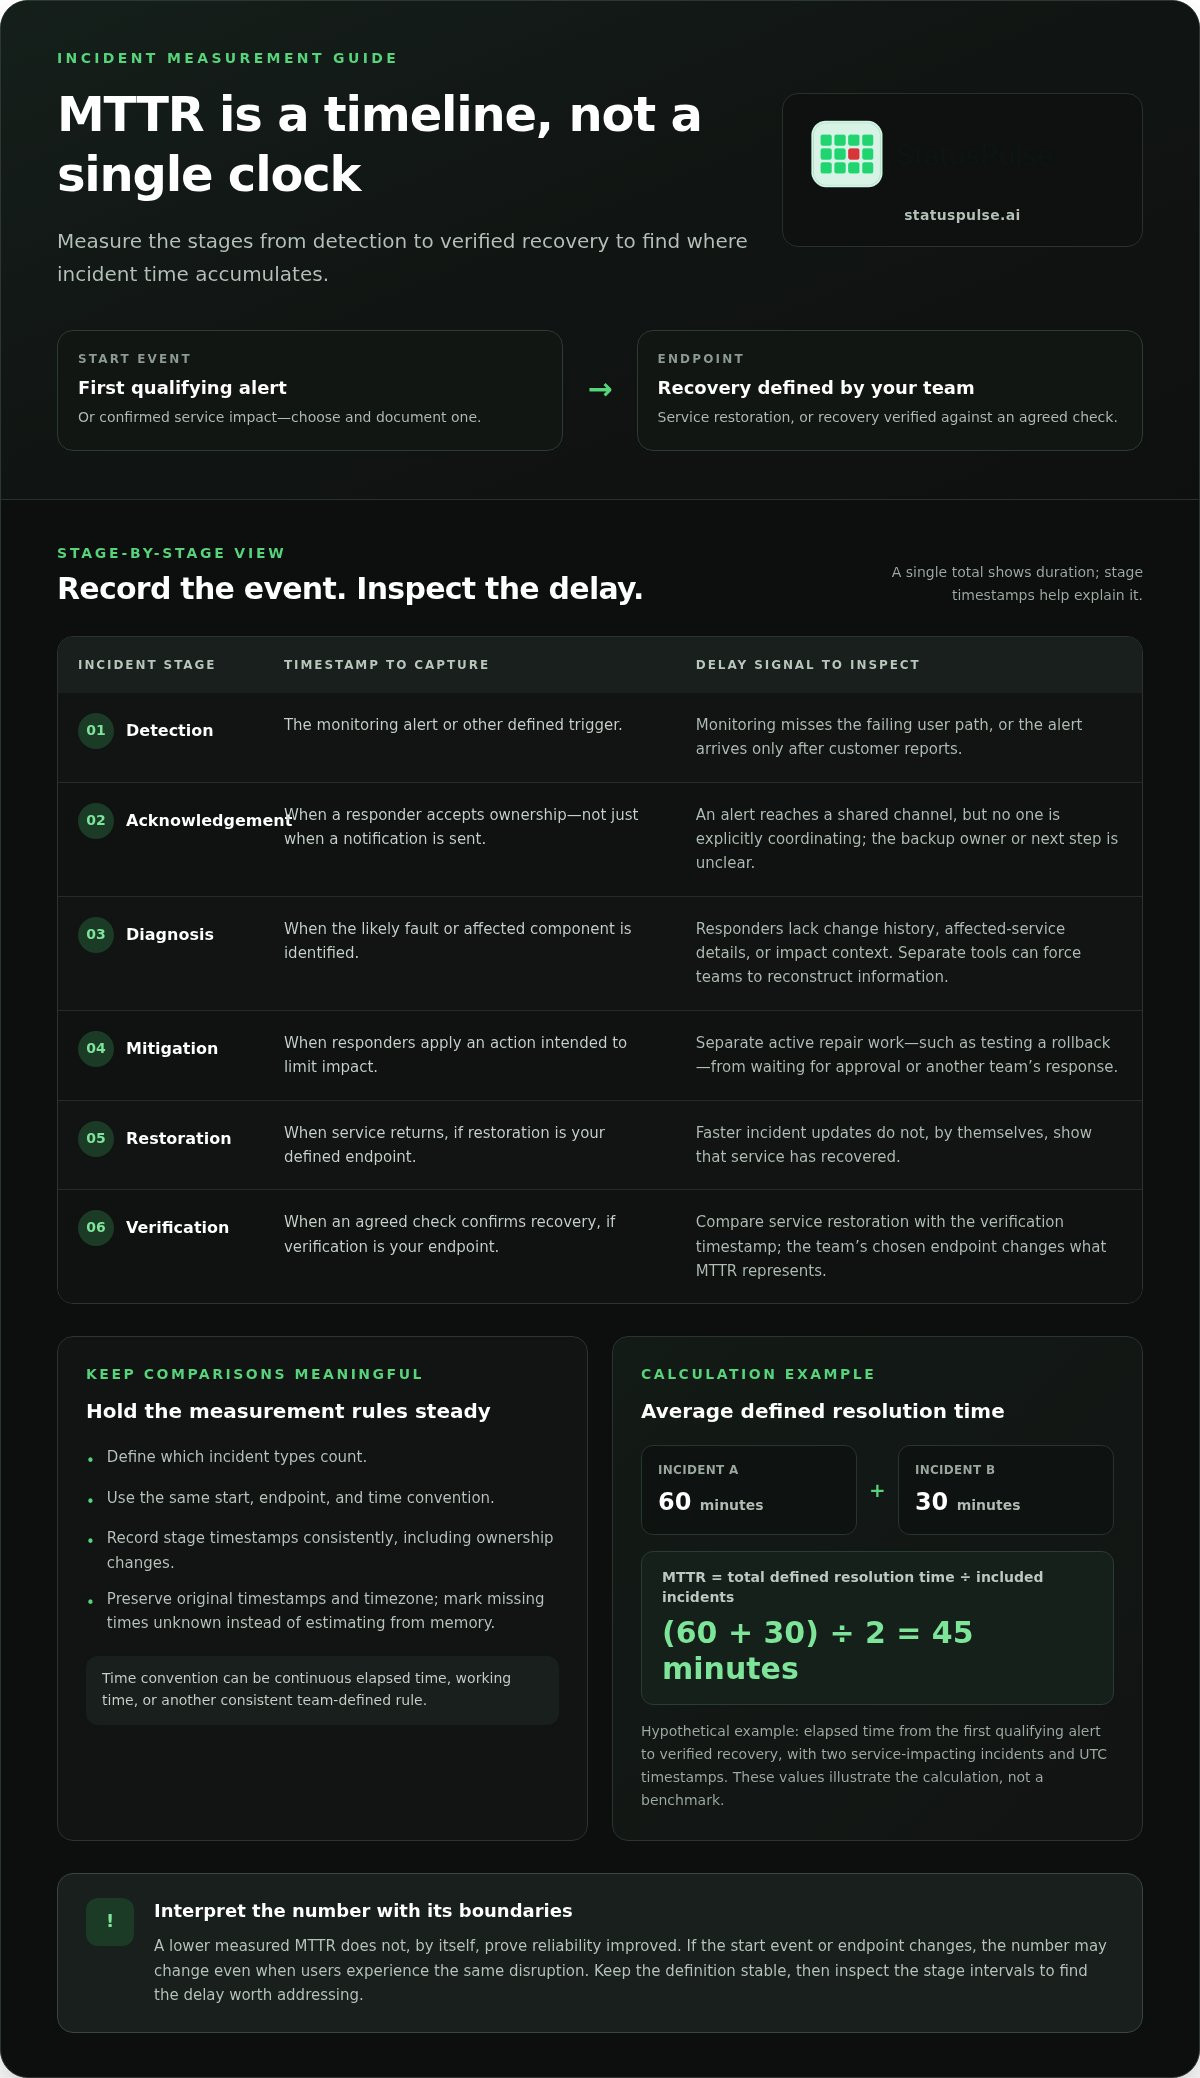
Separate the incident timeline into detection, acknowledgement, diagnosis, mitigation, recovery, and verification. Each stage can stall for a different reason, so a single total rarely points directly to the fix.
- Detection: Monitoring misses the failing user path, or an alert fires only after customer reports arrive.
- Ownership: The alert reaches a shared channel, but no one is explicitly responsible for coordinating the response.
- Context: Responders lack recent change history, affected-service details, or a clear way to assess impact.
- Escalation: The assigned person is unavailable, and the next step or backup owner is unclear.
Handoffs add another kind of delay. Monitoring may identify a symptom, engineering may need to determine whether it is a service or dependency failure, and support may hold customer reports that help establish impact. If those signals sit in separate tools, each team can spend time reconstructing what others already know.
Track active repair and waiting time separately where your records allow it. Active work might include testing a rollback; waiting might include approval, a response from another team, or enough evidence to verify recovery. Neither category is always the main bottleneck. The split helps reveal whether the next improvement belongs in diagnosis, ownership, or a technical repair path.
What a useful MTTR definition includes
Write down three decisions before setting a baseline: the start event, the endpoint, and the time convention. A start could be the first qualifying alert or confirmed service impact. An endpoint could be service restoration or recovery verified against an agreed check. State whether the clock uses continuous elapsed time, working time, or another consistent team-defined rule.
- Include only the incident types the metric is intended to represent.
- Record stage timestamps consistently, including when ownership changes.
- Keep the definition stable when comparing periods or teams.
That definition makes the metric interpretable. It also gives you a basis for locating which stage deserves attention first, rather than treating every long incident as the same problem.
How to measure MTTR across detection, response, and recovery
Once the team has fixed its incident boundaries, calculate MTTR as the total defined resolution time for included incidents divided by the number of those incidents. Keep the same start event, endpoint, incident inclusion rules, and time convention throughout the dataset. Otherwise, the average can change because of measurement choices rather than response performance.
Inconsistent incident boundaries make MTTR comparisons unreliable, because the numbers no longer measure the same interval. A team that starts its clock at customer impact will report a different duration from one that starts at the first alert, even if both use the same recovery endpoint.
Capture timestamps for each incident stage
For each incident, keep a timeline with the event time and its source. That lets responders examine the total and see which interval contributed to it.
- Detection: Record the monitoring alert or other defined trigger.
- Acknowledgement: Record when a responder accepts ownership, not just when a notification is sent.
- Diagnosis: Note when the likely fault or affected component is identified.
- Mitigation: Capture when responders apply an action intended to limit impact.
- Restoration and verification: Record when service returns and when the agreed check confirms recovery.
Use a consistent source for each event where possible, such as an alert event for detection and an incident record or human update for a decision. Preserve the original timestamps and timezone. If a stage time is missing, mark it as unknown; don’t backfill a precise-looking estimate from memory. Missing data is visible and can be improved. Invented precision can distort the baseline.
Calculate the average, then inspect the intervals
Hypothetical example: Assume the team measures elapsed time from the first qualifying alert to verified recovery, includes two service-impacting incidents, and uses UTC. Incident A runs from 09:00 to 10:00 on 12 May, for 60 minutes. Incident B runs from 14:00 to 14:30 on 13 May, for 30 minutes. MTTR is (60 + 30) ÷ 2, or 45 minutes. These values illustrate the calculation, not a benchmark.
The average answers how long the defined incidents took from start to endpoint. Stage durations help explain why. Time to detect runs from impact to detection; time to acknowledge runs from notification to ownership; and time to restore runs from the chosen start to service restoration. Define these intervals explicitly so one team’s “response time” isn’t another team’s “recovery time.”
Keep related reliability metrics distinct
MTBF, or mean time between failures, describes the interval between failures in a defined system. MTTF, or mean time to failure, describes operating time until failure, often for an item treated as non-repairable. Neither replaces MTTR: they address failure frequency or time to failure, not how long service takes to recover. Likewise, define whether “resolution,” “repair,” “recovery,” and “restoration” mean the same endpoint for your team before comparing reports.
Consistent incident tracking and alerting can help keep event records together, but the team still needs to define and review the timestamps it uses. That baseline makes it possible to see where action, rather than faster reporting alone, could shorten recovery.
Which MTTR bottlenecks should your team fix first?
Don’t rank improvements by the largest headline MTTR alone. First group incidents by service, severity, and type; then compare customer impact, how often a delay occurs, and how much of it appears avoidable. A recurring acknowledgement gap on a critical service may deserve attention before a longer but rare investigation on a low-impact system.
Use incident records to map each stage to an observed delay, a plausible cause, and a small first intervention. Treat the cause as a hypothesis to test, not a conclusion drawn from the metric.
Detection
Delay: Impact begins before an alert fires. Possible cause: The check misses the affected user path. First intervention: Compare alert time with incident evidence, then add or adjust a relevant service-level check.
Acknowledgement
Delay: Alerts wait without an owner. Possible cause: Routing or escalation is unclear. First intervention: Name a primary responder and define the next escalation step.
Diagnosis
Delay: Engineers repeat basic investigation. Possible cause: Alerts lack service or dependency context. First intervention: Add relevant runbook links and record affected components in the incident.
Mitigation
Delay: Impact continues after a likely cause is found. Possible cause: Responders lack a clear mitigation path. First intervention: Document safe containment options and decision ownership.
Restoration
Delay: Recovery waits on a dependency, access, approval, or rollback. Possible cause: The recovery path is untested. First intervention: Review rollback readiness, required access, and dependency steps.
Verification
Delay: The team hesitates to close the incident or declares recovery too early. Possible cause: No clear customer-facing check exists. First intervention: Define the signal that confirms the affected behavior works again.
Compare detection, acknowledgement, and diagnosis
Review alerts alongside incident records. Late alerts suggest a coverage or threshold gap; alerts that fire on time but lack context point to a triage problem. If they reach the wrong responder, inspect routing and escalation. Separate noisy alerts from missing coverage by checking which incidents had customer impact without a corresponding useful alert.
Repeated manual checks before identifying an affected component may indicate missing context or an unclear runbook. Don’t assume alert volume is the cause: compare noisy notifications with incidents that were detected late. They call for different fixes.
Compare mitigation, restoration, and verification
Look for recurring waits around approvals, access, dependencies, and rollback decisions. A runbook can clarify the recovery sequence, but it won’t remove a genuine safety review or repair a dependency. Check whether the team uses a defined customer-facing signal before calling service restored; a green infrastructure check alone may not verify the affected behavior.
Monitoring and incident tools can expose timestamps, routing gaps, and recurring waits. They can’t establish root cause without evidence from logs, changes, traces, or responder findings. To decide how to lower MTTR, choose the intervention that addresses a confirmed, repeated delay, then track that stage and customer impact rather than relying on the overall average alone.
How to lower MTTR with a repeatable improvement loop
Lowering MTTR is an operational change, not a one-time target. Use a controlled loop: establish a baseline, narrow the incident set, select one bottleneck, change one process, then review the results. Changing several things at once makes it harder to tell what helped, or whether the difference came from a shift in incident severity or service mix.
Run a focused MTTR improvement cycle
Choose one service, incident category, or severity so you can compare like with like. Set the review period according to how often relevant incidents occur; a team with few incidents may need a longer window to draw a useful conclusion. Keep your metric definition and inclusion rules stable throughout.
- Baseline: Record current stage durations, customer impact, and recurrence for the selected incident group.
- Segment: Separate incidents by relevant service, type, or severity to avoid masking differences in the aggregate.
- Choose one bottleneck: Pick a repeated, avoidable delay that matters to customers, such as unclear ownership or an untested rollback path.
- Change one process: Update a runbook, assign an incident lead, test an escalation path, or make rollback steps safer and clearer.
- Review: Compare equivalent incidents using the same definitions. Record what changed and whether stage time, customer impact, or recurrence shifted.
Don’t treat a shorter average as success if customer impact worsened or the same failure keeps returning. Track the stage you targeted alongside the whole incident outcome. If incident volume is low, describe the evidence and its limits rather than presenting a small sample as a settled trend.
Use alerts and incident communication deliberately
Route alerts according to service ownership and severity, then review both missed escalations and unnecessary ones. A runbook should make the first useful action clear, while a named incident owner coordinates decisions and handoffs. Test escalation paths before an outage exposes a stale contact or an unclear backup.
Keep status updates factual: explain what’s affected, what responders know, and when the next update is due. This helps stakeholders coordinate, but communication doesn’t restore service. For practical guidance on clear, timely updates, see this guide to incident communication transparency.
Automation can reduce repetitive work, but scope it carefully. Start with a well-understood task, define what happens when it fails or returns an unexpected result, and keep a human decision point for actions that could increase impact. After a change, review whether the task behaved as expected during real incidents before expanding its scope. Monitoring and incident-management tools can surface events and keep records together; responders still diagnose the fault, choose mitigation, and verify recovery. That distinction keeps improvements focused on how to lower MTTR without treating automation as a substitute for engineering judgment.
Where monitoring and incident tools fit in an MTTR plan
Tools help most when they target a delay you’ve already identified. Monitoring can reveal service symptoms earlier; incident management can clarify who responds and preserve a timeline. Neither can determine root cause or restore a service on its own. Engineers still need to interpret evidence, choose a mitigation, and verify that users can complete the affected task.
Match monitoring coverage to the service
Choose checks that represent real service paths and dependencies. An HTTP check can test an endpoint, while API, DNS, or database checks can help distinguish an application symptom from a dependency issue. A check that is green at the infrastructure layer may not prove that a customer-facing workflow works.
Multi-region probes can help show whether a failure appears across locations or only from one probe vantage point. Quorum can help determine whether multiple probes agree before treating an alert as broader impact. Neither removes the need to inspect service evidence. Shorter check intervals may reduce the wait for a signal, but they don’t guarantee faster diagnosis, mitigation, or recovery. For a practical look at coverage and communication, see this uptime monitoring guide.
Support response without overstating automation
Severity-based escalation and on-call rotation can make the next owner clearer when an alert needs action. Incident records help responders keep decisions and events in one timeline. Public or private status pages can provide stakeholder visibility, while AI-drafted incident summaries can help prepare updates. Review those summaries before sharing them; they support communication, not diagnosis or recovery.
Choose tools against the diagnosed bottleneck
Match the capability to the delay. If incidents are detected late, review whether protocol-level coverage reflects the service and its dependencies. If alerts go unanswered, examine routing, escalation, and ownership. If teams lose context during handoffs, incident records and a clear update process may help. A tool can expose timestamps and coordinate work, but the team must act on the evidence.
For teams improving their own response process, explore StatusPulse monitoring and incident tools to bring protocol-level checks, alerts, status pages, and incident coordination together. Use them to support a defined response plan, not as a substitute for it. That distinction matters in any practical approach to how to lower MTTR.
Turn the next incident into a measurable improvement
Choose one service and one response delay to investigate in your next review. Set a clear hypothesis, such as whether more frequent checks would reduce the time before detection, then compare the relevant stage data after making a change. StatusPulse supports configurable monitoring intervals as low as 30 seconds, which can provide more frequent signals, but won’t diagnose the fault or restore service for you.
Keep the goal practical: make the next decision clearer, reduce avoidable waiting, or verify recovery with better evidence. Small changes are easier to assess when the team records what changed and checks the same incident stages over time.
To support that work, explore StatusPulse monitoring and incident management. Use monitoring and incident records to inform human decisions, not replace them. With a consistent review habit, each incident can give your team a clearer next step.
Frequently Asked Questions
What is the formula for calculating MTTR?
MTTR is the total measured time for the included incidents divided by their count. For useful reporting, show the unit, incident set, and endpoint beside the result. For example, label a dashboard “verified recovery, minutes” rather than displaying an unexplained number. This makes the figure easier to interpret in reviews and operational reports.
What is a good MTTR target for an engineering team?
There’s no universal target. Set one for a specific service and incident class after reviewing its baseline and customer impact. A useful goal might focus on a stage, such as reducing the time responders spend waiting for access, rather than demanding a blanket reduction that could encourage premature recovery declarations.
Is MTTR the same as time to resolve an incident?
Not always. “Resolve” can mean the service is working again, the incident record is closed, or the underlying cause has been fixed. Those events may occur at different times. In dashboards and post-incident reports, use a label that names the event being measured, so readers don’t infer that the root cause was permanently removed.
Can a lower MTTR mean reliability has improved?
It can reflect faster restoration, but it doesn’t establish that a service has become more reliable. Review changes in incident frequency and recurrence alongside recovery results. For example, a shorter recovery time paired with repeated incidents may point to effective mitigation but unresolved corrective work that needs a separate owner.
Should MTTR include time spent communicating with customers?
Use the endpoint your metric is intended to measure; customer communication can be tracked as its own response measure. Keep update timestamps available for review, including when the first update was sent and whether it accurately described known impact. This helps assess communication quality without treating a published update as evidence that service is healthy.
How should teams calculate MTTR when incidents overlap?
Define whether related alerts belong to one parent incident or count as separate incidents, then apply that rule consistently. Record links between related records so reviewers can trace shared impact without counting one recovery period twice. If the classification changes, document the change before comparing reports across the affected periods.
How often should a team review MTTR?
Review it when the incident set provides enough comparable cases to discuss a pattern, and after an unusual outage that exposed a process gap. The right cadence depends on incident volume. End each review with a named owner and a check-in point for the process change, rather than treating the metric review itself as the improvement.


