

What if your homepage passes its uptime check while customers can’t complete a critical journey? A single endpoint can return HTTP 200 even when checkout, an API dependency, or expected page content is failing. That’s why website downtime monitoring tools need to do more than ping a URL. Checks that generate false alerts can also train responders to ignore the signal.
Teams need monitoring that reflects important user tasks, alerts that reach an owner, and a clear way to communicate incidents. This guide explains how to assess detection quality, coverage, alerting, incident communication, and operational fit. You’ll learn what to check across endpoints, routes, APIs, and SSL certificates, and how to compare focused monitoring tools with platforms that combine monitoring and status pages. The goal is practical: choose checks that catch meaningful failures, help verify recovery, and connect customer updates to the response.
Key Takeaways
- Choose website downtime monitoring tools based on the failures they can detect, not just the number of endpoints they check.
- Set checks around critical user journeys, APIs, and SSL certificates, with failure criteria suited to each check.
- Test alert routing and assign clear owners so responders know what to do when a check signals a failure.
- Compare tools by coverage and workflow, including whether status pages and incident management fit your team’s process.
- Use monitoring signals to guide triage and customer updates, but investigate separately to establish root cause.
What website downtime monitoring tools detect, and what they cannot
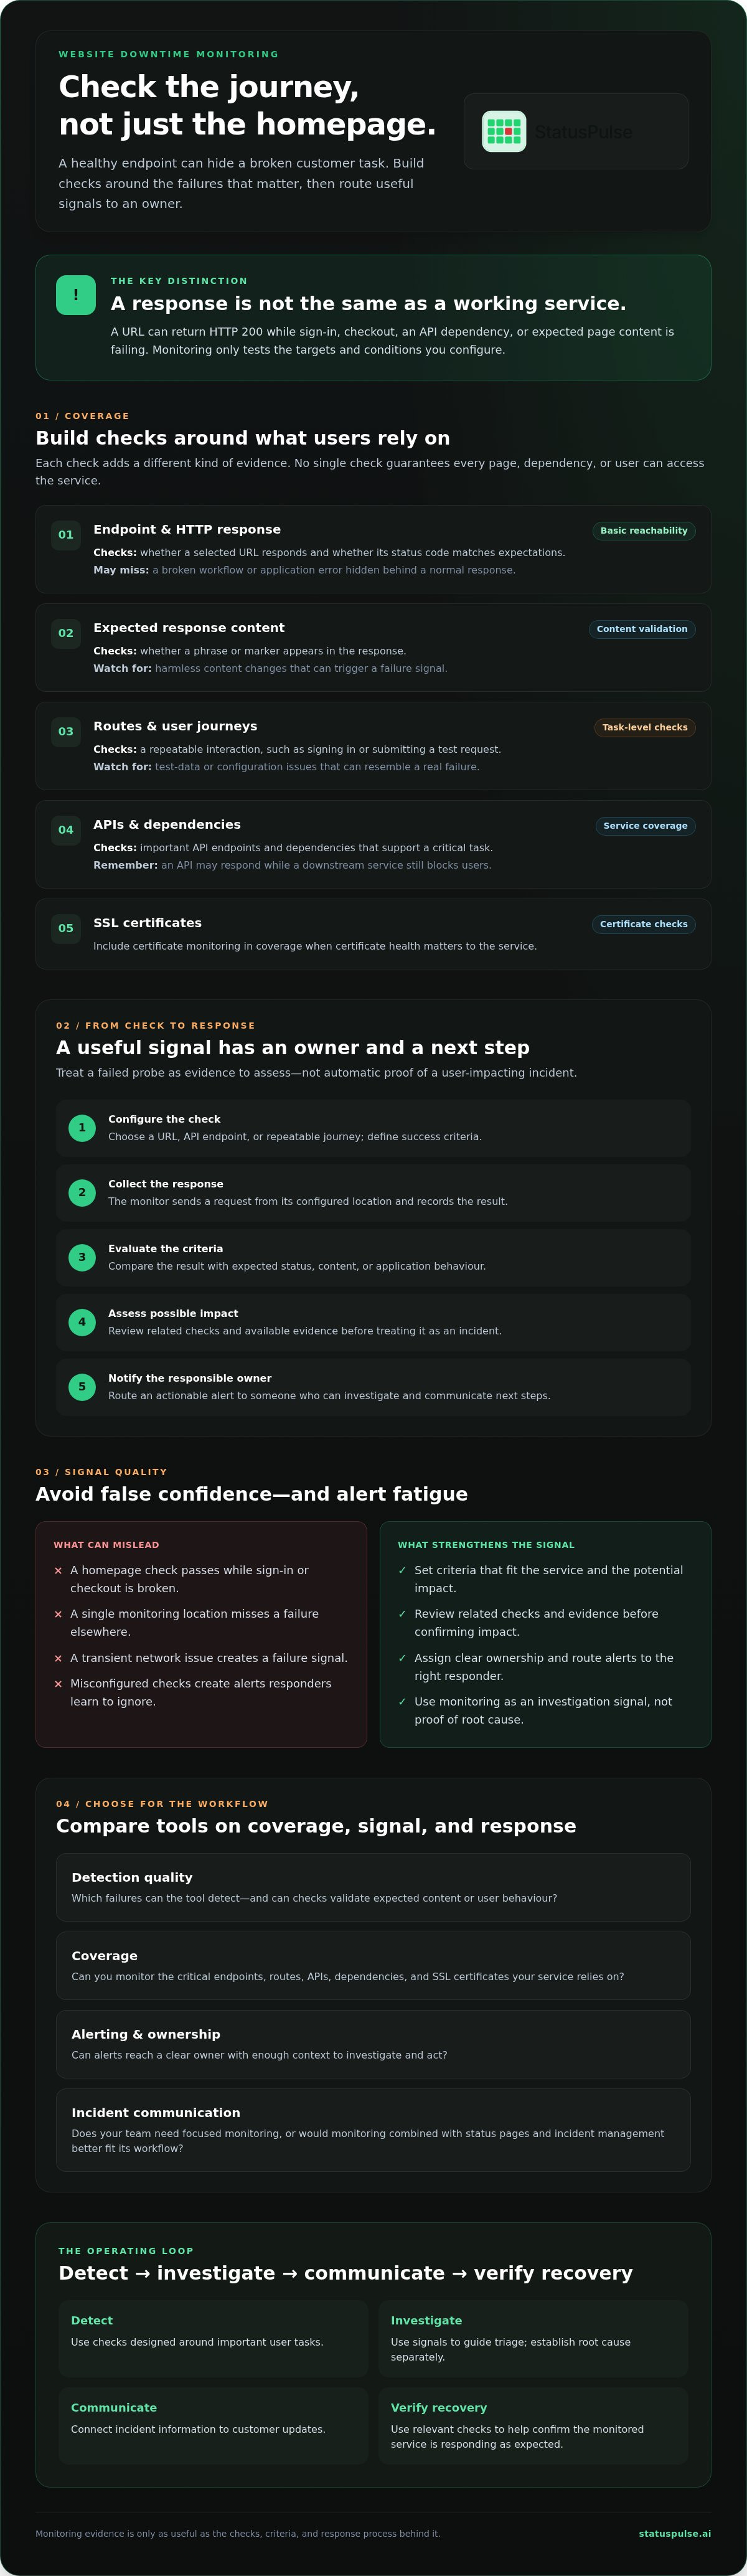
Your homepage returns a normal response, but customers can’t sign in because authentication is failing. A basic check may report that the site is up while a critical user journey is broken. Website downtime monitoring tools provide evidence about the endpoints and conditions you configure. They cannot guarantee that every page, dependency, or user can access the service.
Downtime monitoring repeatedly checks whether a service meets defined response expectations. A check sends a request, evaluates the response against rules, and records whether it passed. As the overview of Website monitoring explains, monitoring includes different services and methods. A particular check can detect only what its target and configuration allow it to test.
What does a website uptime check actually test?
A simple HTTP check might test whether a server returns an expected status code, such as 200. Another check may also look for expected text in the response, but not every tool offers both. A homepage check says little about authentication, checkout, or other routes unless you configure checks for those paths.
Availability monitoring asks whether a selected service responds according to its criteria. Performance monitoring focuses on response speed or behaviour under load. Observability uses internal signals, such as logs, metrics, and traces, to help investigate system behaviour. User reports are another source of information, but they arrive only after someone encounters and reports a problem.
Where can downtime monitoring create false confidence?
A healthy response can hide a broken dependency or an unusable workflow. A page may return HTTP 200 while displaying an application error, or an API may respond while a downstream service prevents users from completing a task. A check from one monitoring location may also miss a failure limited to another region, network, or route.
A single failed probe isn’t automatically a confirmed incident. A transient network problem or an issue between the monitor and your service may produce a failure signal. Decide how to verify alerts based on the service’s potential impact and the checks available, rather than assuming one retry count or threshold suits every system.
The practical limit is clear: a monitor tests what you configure it to test. Choose checks for important user-facing routes and dependencies, then use their results as signals for investigation, not proof of universal availability or root cause.
How website downtime monitoring tools detect and verify failures
A useful detection process distinguishes a failed probe from an incident that affects users. The monitor tests a defined target, evaluates the result against configured criteria, and sends a signal for responders to assess. The endpoint, monitoring location, and rules all shape what that signal means.
The basic sequence is straightforward:
- Configure a check: Choose a URL, API endpoint, or repeatable user journey, then define what counts as a successful response.
- Collect a response: The monitor sends a request from its configured location and records the result.
- Apply criteria: It checks the response against rules such as an expected status code, response content, or application behaviour.
- Assess the failure: Review the signal alongside related checks and available evidence before treating it as a user-impacting incident.
- Notify responders: Route an actionable alert to an owner who can investigate and communicate next steps.
A confirmed downtime signal is a failed check that meets the team’s verification criteria and indicates a likely impact to the monitored service. Teams can set criteria that suit their systems instead of relying on a universal retry count.
Which checks should a downtime monitoring tool run?
A simple HTTP check can establish whether an endpoint responds and whether its status code matches expectations. A content check can look for a phrase or marker in the response, while a synthetic check can exercise a repeatable sequence, such as signing in or submitting a test request. Each adds coverage, but needs careful configuration to avoid flagging harmless content changes or test-data issues.
Start with the routes and APIs whose failure would block a key user task. For a service with authentication, checking only the public landing page leaves sign-in untested. Akamai’s overview of how website monitoring works also describes synthetic testing as an approach for checking defined interactions.
How should teams handle alerts and recovery signals?
Route alerts by service or ownership so the person receiving a notification can act on it. A failed check should prompt investigation, not an automatic conclusion about root cause. A recovery notification is useful when the monitored service meets its configured success criteria again. It confirms that the check has recovered, not that every user journey works.
Before choosing among website downtime monitoring tools, verify which alert channels, integrations, and escalation controls each vendor supports. If you want monitoring alongside public status pages and AI-assisted incident management, explore StatusPulse website and API monitoring.
Compare website downtime monitoring tools by coverage, signal quality, and workflow
Compare tools against the services you need to monitor and the response process your team can sustain. A feature count won’t tell you whether a failed check reaches the right owner or whether customers can get a useful update.
| Capability | What to evaluate |
|---|---|
| Endpoint checks | Can you monitor the specific public pages and routes that matter? |
| API coverage | Can checks validate the API endpoints your product depends on? |
| SSL monitoring | Can the tool track certificate validity separately from site availability? |
| Alert controls | Can alerts be routed to the appropriate owner and adjusted to limit noise? |
| Status pages | Can responders share service impact with customers in a separate public view? |
| Incident workflow | Does the tool support the team’s triage, updates, and recovery confirmation? |
Coverage and response workflow matter more than feature count: checks help only when they detect relevant failures and lead to a clear, owned response. Also compare signal quality, setup effort, ownership, and reporting. Advanced checks may be a poor fit if maintaining them takes more effort than your team can support. For a deeper technical view of check design, see this website uptime monitoring guide.
Which monitoring capabilities matter for your architecture?
Map each user-facing service to an appropriate check: public pages to endpoint checks, authenticated paths to checks that can safely validate access, and APIs to API monitoring. Include third-party dependencies when their failure would meaningfully affect users and you can monitor them appropriately. Verify supported check types and monitoring locations with each provider instead of assuming multi-region coverage.
SSL certificate monitoring addresses a different risk from availability checks. A site can respond while a certificate issue prevents browsers or clients from trusting the connection. For background on monitoring approaches, Website monitoring outlines the broader category and its methods.
How do alerting, status pages, and incident tools differ?
Internal alerts tell responders that a check needs attention. A public status page communicates service impact to customers; it doesn’t establish root cause. Incident tools can help coordinate response, but check how their workflows fit your existing ownership and reporting practices.
AI-assisted tools may help draft an update or summarize reported impact. Keep a human reviewer responsible for confirming details before publication. Check each vendor’s alert channels, integrations, escalation controls, and reporting options directly, since availability and configuration can vary.
Choose and configure a downtime monitoring tool for your team
Start with the user journeys that matter, then configure checks and response ownership around them. A useful setup gives your team actionable signals without monitoring every endpoint or generating alerts nobody owns.
- Map critical services: List the public pages, routes, APIs, and dependencies whose failure would affect users.
- Define failure criteria: Specify what a failed check looks like for each service, based on its expected response.
- Test notifications: Trigger a test failure and recovery. Confirm that both messages arrive where expected and include enough context to act.
- Assign owners: Name the team or responder responsible for each alert, and agree on how it should be escalated.
- Review outcomes: Revisit false positives, missed incidents, and checks that no longer reflect the service.
How can a team reduce noisy downtime alerts?
Look for patterns in false positives before changing alert rules. Check whether the endpoint is appropriate, response criteria are too strict, or the notification is reaching the wrong owner. A route whose content changes often may need a different check from one with a stable response.
Set ownership and escalation expectations that match your incident process. Don’t copy another team’s retry policy or threshold as a universal rule. Choose criteria that balance the impact of a missed failure against the cost of unnecessary interruptions, then refine them as you review real outcomes.
What should a monitoring-tool evaluation include?
Use a written requirements list to compare website downtime monitoring tools on more than check count. Record the check types your architecture needs, required integrations and notification controls, status-page expectations, and the vendor’s service boundaries. Verify plan limits and supported capabilities directly with each provider.
- Operational fit: Can your team configure, maintain, and review checks with its available skills and processes?
- Pricing structure: Compare how costs scale, including any charges tied to users, checks, or separate components. Don’t assume plans are equivalent.
- Privacy and data handling: Assess the provider’s data processing and storage practices against your organization’s requirements.
StatusPulse is a cloud-based monitoring platform, not a managed IT support service. If you want to evaluate uptime monitoring alongside public status pages and AI incident management, explore StatusPulse monitoring and incident tools.
Connect downtime detection to recovery and customer communication
A confirmed alert starts incident response; it isn’t a diagnosis. Monitoring data can show which check failed and when, helping responders scope an issue, but it can’t establish root cause on its own. Use the signal to guide investigation, then base customer updates on what the team has verified.
What should happen after an outage alert fires?
Give the alert a clear path from triage to recovery. Responders can check related services and user-facing routes, confirm the affected scope, and assign an owner to coordinate the investigation. If customers are affected, publish a concise update that states what’s known, what’s being investigated, and when the next update will come.
Keep evidence and hypotheses distinct. “Some API requests are failing” is useful when checks or logs support it. A suspected database issue should remain a hypothesis until verified. AI-assisted summaries or draft updates can help organize information, but a human should review them before publication.
Once the service meets its configured recovery criteria, confirm that relevant checks pass again and post a recovery update. For deeper implementation guidance, see this incident communication architecture guide.
When does an all-in-one monitoring platform make sense?
For teams that want fewer handoffs, connecting uptime checks, public status pages, and incident updates in one workflow can reduce the need to move information between separate tools. The trade-off is fit: a team with a mature observability stack or specialized requirements may prefer dedicated monitoring tools and its existing incident process. Compare the workflow with how responders already investigate and communicate.
Website downtime monitoring tools are most useful when detection leads to a response people can follow, from a verified signal to customer communication and recovery confirmation. Review uptime monitoring fundamentals for more on check design and clear reporting.
StatusPulse combines website and API uptime monitoring, SSL certificate monitoring, public status pages, and AI-assisted incident management. If that combination fits your response workflow, explore StatusPulse monitoring and incident tools.
Build a monitoring workflow your team can trust
Reliable monitoring starts with the right question: can your checks detect failures that affect real user journeys? Choose website downtime monitoring tools based on relevant endpoint and API coverage, signal quality, and whether alerts reach an owner who can verify impact and recovery.
Detection is only one part of the response. Pair confirmed signals with clear triage and factual customer updates, while treating monitoring data as evidence rather than a root-cause diagnosis. Test failure and recovery notifications before relying on them during an incident.
StatusPulse combines uptime and API monitoring with public status pages and AI-assisted incident management. Its tiered subscription plans provide access to its cloud-based monitoring and incident communication tools. Review current plan details to determine which capabilities fit your team.
To see whether that workflow fits your team, explore monitoring and incident communication tools. Start with the routes your users depend on, then refine your checks as you learn from real signals.
Frequently Asked Questions
What is a website downtime monitoring tool?
A website downtime monitoring tool repeatedly checks a website or service against configured response criteria. Depending on the tool, it can test a URL, API endpoint, response content, or user journey. Its results apply to the targets checked, not every page, dependency, network, or user.
How do website downtime monitoring tools detect an outage?
Website downtime monitoring tools send requests to configured endpoints and compare responses with success criteria, such as an expected status code or content. A failed check signals a need to investigate. Review related checks and user impact before confirming an incident, then route actionable alerts to responders.
Can a website monitoring tool detect failures on specific pages or APIs?
Yes, if the tool supports the check type and you configure it for those targets. A homepage check may not detect a broken sign-in route or API. Prioritize checks for important user tasks, and verify how the provider handles authentication, test data, and application changes.
How can I reduce false alerts from website downtime monitoring?
Review false positives to identify whether the endpoint, response criteria, connection, or alert routing caused them. Verify signals against related checks and assign clear owners. Set rules that fit your service and incident process; no single retry count or threshold works for every system.
Do uptime monitoring tools include public status pages?
Some platforms include public status pages, while others focus on detection or offer communication separately. Check whether a status page is included and how updates are published. A status page helps share confirmed impact with customers, but it doesn’t verify an outage or establish its root cause.
Should I choose a monitoring provider with EU or US hosting?
Choose based on your organization’s data-residency requirements, operational needs, and the provider’s terms. Review what data the service processes and where it is stored; server location alone may not answer every data-handling question.
Can one tool monitor website uptime, APIs, and SSL certificates?
Yes. Some platforms combine website uptime, API, and SSL certificate monitoring. Confirm the specific checks and configuration options offered. StatusPulse provides these monitoring capabilities alongside public status pages and AI incident management, so teams can manage detection and incident communication within one platform.


