

A green uptime check can still hide a slow site. It confirms that a request succeeded, not that the server responded quickly. Time to first byte (TTFB) monitoring helps expose that gap, but a single reading can mislead if it hides differences between locations, routes, and time periods.
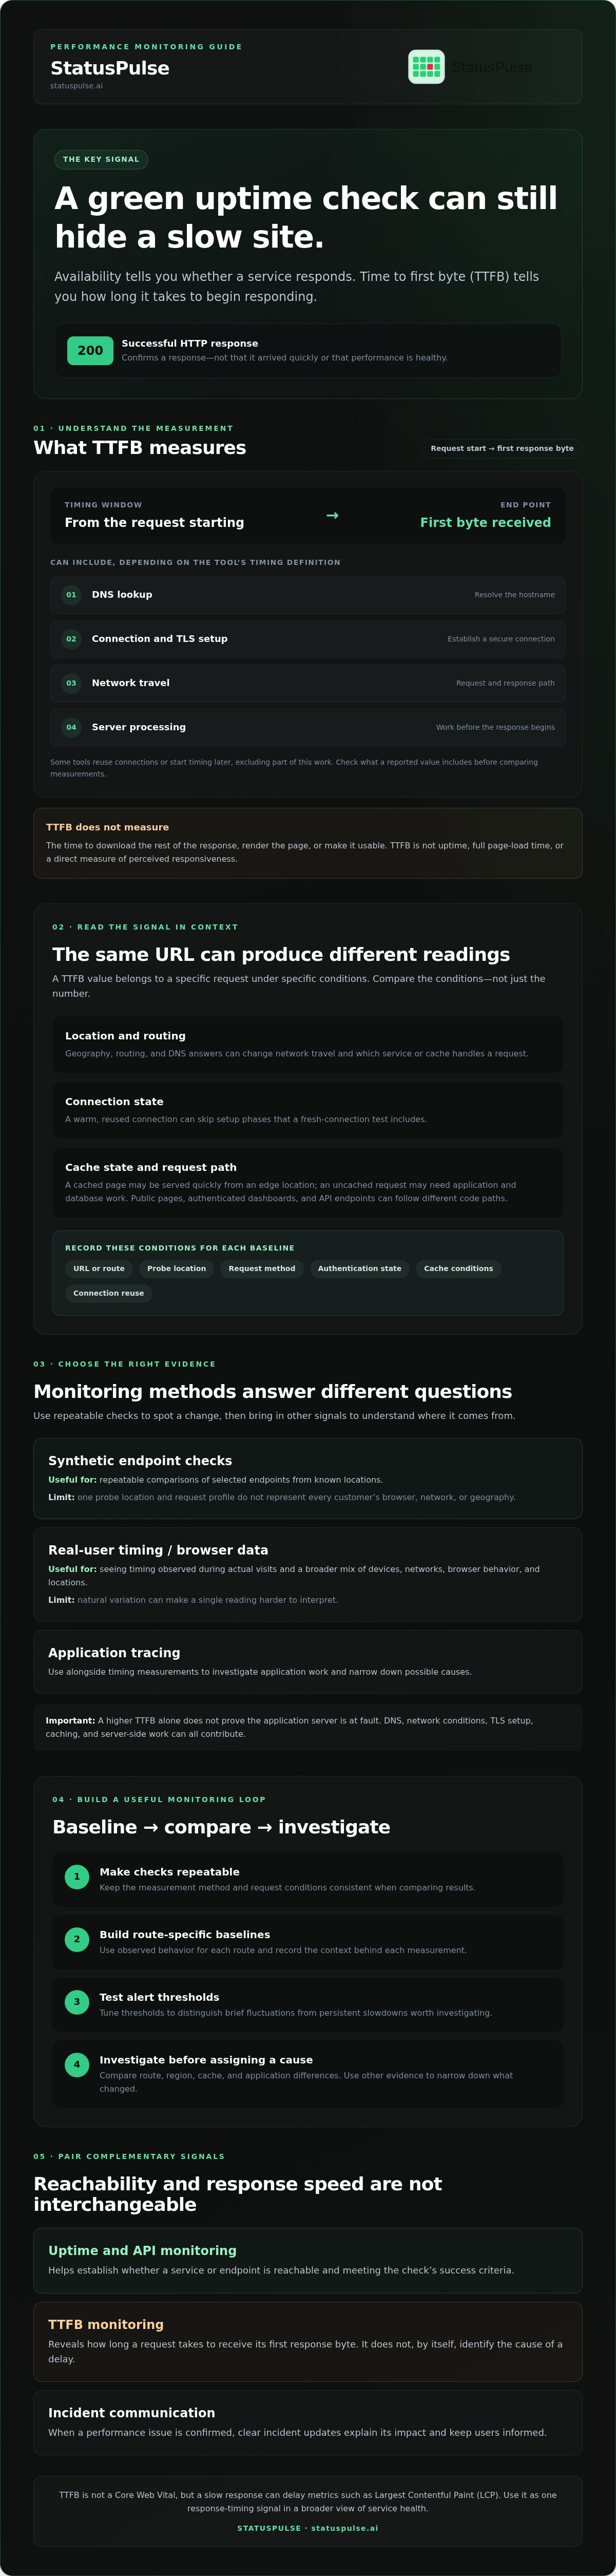
TTFB measures the time from a request starting until the first response byte arrives. It can include DNS lookup, connection and TLS setup, network travel, and server processing. It doesn’t measure the time needed to download the rest of the response or render the page. TTFB isn’t a Core Web Vital, but a slow response can delay metrics such as Largest Contentful Paint.
Useful monitoring is about more than collecting numbers. You need repeatable checks, a baseline, and thresholds that help your team distinguish a brief fluctuation from a problem worth investigating. This guide explains what TTFB includes and excludes, how to measure it across relevant routes and locations, and how to connect slow responses with availability signals and clear incident updates.
Key Takeaways
- Choose a measurement method that matches the question, from synthetic endpoint checks to browser data and application tracing.
- Use time to first byte (TTFB) monitoring to spot response delays, then investigate route, region, cache, and application differences before acting.
- Build route-specific baselines from observed behavior, and test alert thresholds so your team can separate persistent slowdowns from noisy readings.
- Pair timing-focused instrumentation with uptime and API monitoring: one reveals response delay, while the other helps establish whether a service is reachable.
- When a performance issue is confirmed, use clear incident updates to explain its impact and keep users informed.
What time to first byte monitoring measures, and what it does not
An availability check can return a successful HTTP status while users wait for a page to respond. That’s because a request can reach the service and receive a response without receiving it quickly. Time to first byte (TTFB) monitoring helps quantify that delay, but the measurement alone doesn’t identify its cause.
TTFB is the elapsed time from a request starting until the browser receives the first byte of the response. The Time to First Byte (TTFB) reference describes the request phases involved and distinguishes TTFB from total page-load time. The exact start and end points depend on the measurement tool and its timing definition, so check what a reported value includes before comparing results.
TTFB isn’t uptime, full page-load time, or a direct measure of perceived responsiveness. It doesn’t tell you how long the remaining response takes to download, when the page becomes usable, or whether a user’s interaction feels fast. Treat it as a response-timing signal, not a standalone diagnosis.
Which parts of a request can affect TTFB?
A measurement may include DNS lookup, connection setup, TLS negotiation, and the time spent waiting for the server to process the request and begin its response. Network distance and routing can add delay before the request reaches the server or its first byte returns. Some tools reuse connections or start timing at a later phase, which can exclude part of this work.
A higher TTFB doesn’t prove the application server is at fault. Network conditions, DNS resolution, TLS setup, caching, and server-side work can all contribute. Compare measurements made with the same tool and timing definition, then use other evidence to narrow down the cause.
Why can a passing uptime check hide slow responses?
An uptime check usually answers a specific question: did a request reach the endpoint and meet the check’s success criteria? If the server returns an expected HTTP status, the check may pass even if the response took longer than usual. Whether the check also evaluates timing depends on its configuration.
Availability tells you whether a service responds; response timing tells you how long it takes to begin responding. A 200 status confirms a successful HTTP response, not that the response arrived within a time acceptable to your users. Pairing availability signals with dedicated timing measurements gives teams a clearer basis for investigation. A passing check alone doesn’t prove that performance is healthy.
How TTFB changes across browsers, regions, and request paths
A TTFB value belongs to a particular request made under particular conditions. A browser in one region may resolve DNS differently, reuse an existing connection, or reach a nearby cache. A probe elsewhere may establish a fresh connection to a different edge location. The readings can differ even when both request the same URL.
Think of the request as a path: the client resolves the hostname, establishes or reuses a connection, sends the request through the network, and waits while the service handles it and begins the response. Geography and routing affect network travel. Cache state and request handling affect what work happens before the first byte is sent.
What can make two TTFB readings differ?
Compare the conditions behind each measurement, not just the reported time. A warm connection can skip setup phases included in a fresh-connection test. DNS answers can vary, while a cached page may be served quickly from an edge location and an uncached request may need application and database work.
Routes matter, too. An authenticated dashboard, a public cached page, and an API endpoint can follow different code paths. For every baseline, record the URL or route, probe location, request method, authentication state, cache conditions, and whether the test reuses connections. Without that context, a change in test setup can look like a performance regression.
Synthetic checks versus real-user timing
Synthetic checks send controlled requests to selected endpoints from known locations. They’re useful for repeatable comparisons and for checking whether a specific route has changed under the same test conditions. Their limitation is coverage: one probe location and request profile don’t represent every customer’s browser, network, or geography.
Real-user measurements show timing observed during actual visits, when available. They capture a broader mix of devices, networks, browser behavior, and locations, but that variation can make a single reading harder to interpret. Use synthetic results to isolate changes under controlled conditions, and real-user data to understand the range customers experience. Compare like with like, including route and region where possible.
There’s no universal target that fits every route and user base. Google’s good TTFB score guidance offers a reference point, but teams should set and validate service objectives against their own routes, measurement methods, and user experience. Treat differences between locations as a signal to investigate, then compare request conditions and related measurements before drawing conclusions.
Compare TTFB monitoring methods and choose the right signals
Choose a measurement method based on the question you need to answer. Synthetic checks show whether a known route has slowed under repeatable conditions. Browser data captures a wider range of real sessions, while application traces help explain where request time is spent. No single signal does all three.
| Method | Best for | Strengths and blind spots | Likely owner |
|---|---|---|---|
| Synthetic endpoint checks | Tracking selected routes from set locations | Repeatable and straightforward to compare; represents only its probe location and request setup. | SRE or DevOps |
| Browser performance data | Understanding timings across real sessions | Reflects actual user conditions; needs browser instrumentation and varies by device, network, and route. | Frontend or web performance team |
| Application tracing | Finding time spent across services and dependencies | Shows internal spans; requires tracing instrumentation and doesn’t replace user-facing timing. | Backend or platform team |
| StatusPulse | Availability and API monitoring signals | Provides availability context; use a dedicated timing tool for TTFB unless your configuration explicitly exposes it. | Service owner |
When are synthetic TTFB checks useful?
Use repeatable requests to watch critical pages or API routes and identify changes against a consistent baseline. Record the probe location, request method, headers, authentication state, and connection behavior, since changes to the setup can change the result. Pair timing with the HTTP status and availability outcome so a fast error response doesn’t look healthy. Google’s Time to First Byte (TTFB) guidance explains measurement approaches; configure your checks to match the route and question you need to assess.
When do browser data or tracing add more context?
Browser performance data, when available, helps show how timing varies across real sessions. Application traces follow work through services and dependencies, helping teams investigate whether time is accumulating in a database call, a downstream service, or application handling. This insight requires instrumentation. A standard uptime monitor generally won’t provide distributed traces unless it explicitly supports them.
Infrastructure metrics and logs can help explain a slowdown, but CPU, memory, or error entries don’t tell you the response time a user experienced. Combine internal evidence with user-facing timing rather than treating either as a substitute. StatusPulse’s uptime and API monitoring can provide availability context alongside dedicated timing tools.
How to set TTFB baselines, alerts, and an investigation workflow
Effective time to first byte (TTFB) monitoring starts with a consistent test, not a borrowed threshold. Build a baseline for each important route, account for normal variation, then alert on sustained changes your team has agreed to investigate.
Build a baseline that reflects the service
Start with routes that matter to users or business operations, such as a key landing page, sign-in flow, or API endpoint. Keep each check’s location, method, headers, authentication state, and cache conditions consistent. A baseline is only useful if later readings come from comparable requests.
Use this workflow:
- Select endpoints. Prioritize critical pages and API routes instead of monitoring every URL at once.
- Define the request. Document the probe location and request configuration, including whether the request is authenticated or expected to hit a cache.
- Collect normal behavior. Gather readings across representative operating periods. Review the distribution and variability for each route, not just one average.
- Set alert conditions. Choose a route-specific change that matters to users, and require it to persist across multiple checks or a defined observation window. Avoid alerting on isolated spikes.
- Test the alert path. Confirm that the signal reaches the right person and that the alert includes the route, location, timing, and comparison baseline.
Don’t apply one universal TTFB limit to every endpoint. A target should reflect observed behavior and the service objective your team has chosen. Revisit it after significant changes to routing, caching, infrastructure, or request handling.
Investigate a TTFB alert without jumping to conclusions
First establish scope. Check whether the change affects one route, one probe region, or several services. Compare timing with HTTP status codes and availability results, then look for a related deployment or configuration change. If the signal persists, use traces, logs, and infrastructure metrics to investigate possible causes. None of those signals alone proves why TTFB changed.
Before communicating an incident, record the confirmed user impact, affected routes or regions, what the team has checked, and the next action. An alert without a named response owner is only a notification, not an operational process. Assign an owner and escalation path before enabling alerts, so each signal has a clear next step. Keep availability checks and timing instrumentation distinct, then correlate their results during investigation.
Where uptime monitoring and incident communication fit alongside TTFB
Availability and speed answer different operational questions. An uptime check tells you whether a service responds according to its check criteria. A TTFB measurement tells you how long it takes to begin responding. Use both signals to distinguish an unreachable endpoint from a reachable one that has become slow.
That distinction is useful during an incident. If uptime checks pass but dedicated timing data worsens, the service may be available while users still experience delays. If both availability and timing signals change, the team has stronger evidence of broader impact. Neither signal alone identifies root cause, so correlate them with tracing, logs, and deployment history.
Use separate signals to build a clearer incident picture
StatusPulse provides uptime and API monitoring as complementary availability signals. API checks can help verify whether a critical endpoint behaves as expected, but that doesn’t mean they measure TTFB. Use timing-focused instrumentation for response-time data, and combine it with endpoint results to establish what users can reach and where investigation should start.
For broader practices, see the uptime monitoring guide and the API monitoring guide. They provide further context for planning availability checks and endpoint coverage alongside time to first byte (TTFB) monitoring.
Turn verified impact into a useful update
Once the team confirms an issue, communicate what’s known. Name the affected service or routes, describe the observed symptoms, and state whether investigation is ongoing. Don’t present a suspected cause as fact. If only one region or endpoint is affected, say so; if the scope is still unclear, be direct about that too.
A public status page gives teams a place to share incident updates with users as the investigation progresses. StatusPulse also provides AI-assisted incident management that can support drafting updates. Treat drafts as a starting point: a person should verify the impact, wording, and next steps before anything is published.
If you’re reviewing how availability checks and user updates fit into your incident process, explore StatusPulse monitoring and status pages. Its uptime and API monitoring can complement dedicated TTFB instrumentation.
Make response-time signals actionable
Useful time to first byte (TTFB) monitoring starts with consistent measurements for important routes. Compare like with like across locations and request conditions, build baselines from observed behavior, and alert on sustained changes rather than isolated spikes. TTFB shows when the first response byte arrives, not why it was delayed, so use traces, logs, and infrastructure signals to investigate.
Keep availability and timing distinct. Uptime and API checks help confirm whether services and endpoints respond, while dedicated timing tools measure response delay. Once an issue is confirmed, share the affected routes, known symptoms, and investigation status through clear incident updates. Public status pages and AI-assisted incident management can support that communication, with a person reviewing updates before they’re published.
If you want to bring availability checks and incident communication together, explore StatusPulse monitoring and status pages. StatusPulse offers uptime and API monitoring, public status pages, and AI-assisted incident management. Pair those signals with the timing tools that fit your stack to give your team a clearer path from alert to action.
Frequently Asked Questions
What is time to first byte (TTFB)?
Time to first byte (TTFB) is the elapsed time from a request starting until the client receives the first byte of the response. Depending on the tool’s timing definition, the measured interval may include DNS lookup, connection setup, TLS negotiation, network travel, and server processing. TTFB isn’t the same as full page-load time or uptime. It signals response delay, but doesn’t identify the cause on its own.
Is TTFB the same as latency?
No. Latency is a broad term for delay during communication or processing; TTFB measures a specific milestone, the arrival of the first response byte. A TTFB result may include several request phases, depending on where the measurement starts and ends. Check those timing boundaries before comparing values from different tools. A single reading can show a delay, but it can’t establish which network or application component caused it.
How do you monitor TTFB for a website?
Start with important pages and API routes, then choose consistent probe locations and request conditions. Collect measurements over time to establish a route-specific baseline before setting alerts. Synthetic checks provide repeatable results from selected locations; browser performance data, when available, adds context from real sessions. Pair timing results with status codes and investigation tools. An uptime monitor may not expose TTFB, so verify that capability rather than assuming it’s included.
What is a good TTFB time?
There isn’t one threshold that fits every route, application, user base, and measurement setup. Build a baseline using consistent locations and request conditions, then set service objectives based on user impact and product requirements. External benchmarks can offer context, but their methods may differ from yours. Focus on trends and sustained changes in your own measurements, not a universal number or one isolated result.
Can uptime monitoring detect a slow TTFB?
Not necessarily. An uptime check may confirm that a page or endpoint responds without reporting how long the first byte took to arrive. Check whether your monitoring tool records response timing and how it defines the measurement. If it doesn’t, pair availability checks with appropriate timing, browser, or tracing tools. A successful HTTP status shows that a request met the check’s success criteria, not that users received a fast response.
Why does TTFB vary between monitoring locations?
Different locations can use different network paths, DNS results, and connection conditions, and may be farther from the service. Cache state, the requested route, and request configuration can also affect readings. Label measurements by location and keep test conditions consistent when comparing them. A difference between probes is useful evidence to investigate, but it doesn’t prove that a specific network or server component is at fault.
Should I alert on every increase in TTFB?
No. Isolated increases can reflect normal measurement variation and may not affect users. Establish a baseline, prioritize important routes, and alert on sustained changes that your team considers meaningful. Assign a response owner and test the alert path before relying on it in production. When an alert fires, compare its timing with availability results, status codes, traces, and other relevant evidence to understand the scope before deciding what to do.


