

Two teams can record the same outage and report different uptime percentages. The difference usually comes down to the measurement window and what each team counts as downtime. If you’re working out how to calculate uptime percentage, define those rules before relying on the result.
The basic formula is: (total time in the measurement period − downtime) ÷ total time in the period × 100. Use elapsed time for the period, then subtract the downtime that meets your stated definition. Monitoring checks can help identify incidents, but a percentage based on successful checks answers a different question and can vary with check frequency and location.
This guide explains how to apply the formula to downtime records, calculate availability for monthly or yearly periods, and compare results with uptime targets. It also covers scheduled maintenance, partial outages, slow responses, and regional failures. By the end, you’ll have a result you can explain, supported by rules that make future reports more consistent.
Key Takeaways
- Learn how to calculate uptime percentage from a defined time window and downtime records.
- See why elapsed-time calculations and successful monitoring-check ratios can produce different results.
- Set clear rules for scheduled maintenance, partial outages, and other events before comparing availability.
- Reconcile monitoring alerts with incident timestamps to build a more consistent uptime report.
- Use availability results to inform targets and SLA discussions, while accounting for user impact beyond the percentage.
What Does Uptime Percentage Measure? Start With the Time Window
An incident report says a service was “99.9% up,” but doesn’t give the dates or explain which incidents counted. That figure can’t be checked or compared reliably. To understand how to calculate uptime percentage, first define the measurement period and availability criteria. Then divide the time the service met those criteria by the total time in the period and multiply by 100.
Uptime percentage is the share of a defined period during which a service met its stated availability criteria. Those criteria might require a successful response from a specific endpoint. A different endpoint, or a requirement that key functions work, could produce a different result for the same service and dates.
Uptime, availability, and reliability are related but distinct
Uptime describes whether a service was available during a chosen interval; availability expresses that as a percentage. But an endpoint can return a successful response while taking too long to be useful, or while a key feature is broken. If your criteria only check whether the endpoint responds, the calculation may not capture those performance problems.
Reliability is broader. It concerns consistent operation over time, including how often failures occur and how the service recovers. A single uptime percentage is one measure, not a full account of reliability. To understand the relationship between uptime and high availability, consider how the system is designed to continue operating, not just the percentage reported for one period.
Choose the reporting period before calculating
Set exact start and end timestamps before selecting incident records. Use a consistent time zone and boundary convention, such as including the start instant and excluding the end instant. This helps prevent an event from being counted twice when adjacent reporting windows meet.
A monthly figure helps track performance against a monthly objective. A quarterly view can reveal patterns a single month might hide, while a yearly figure summarizes longer-term availability. These periods answer different questions, so don’t compare them as if they use the same denominator. A short outage also has a larger percentage effect in a short window than in a year.
Every uptime figure needs an explicit measurement window and a stated rule for what counts as downtime. Report those details alongside the percentage. Otherwise, readers can’t tell whether the number reflects a calendar month, a contract period, or a particular definition of service availability.
How to Calculate Uptime Percentage: Formula and Worked Example
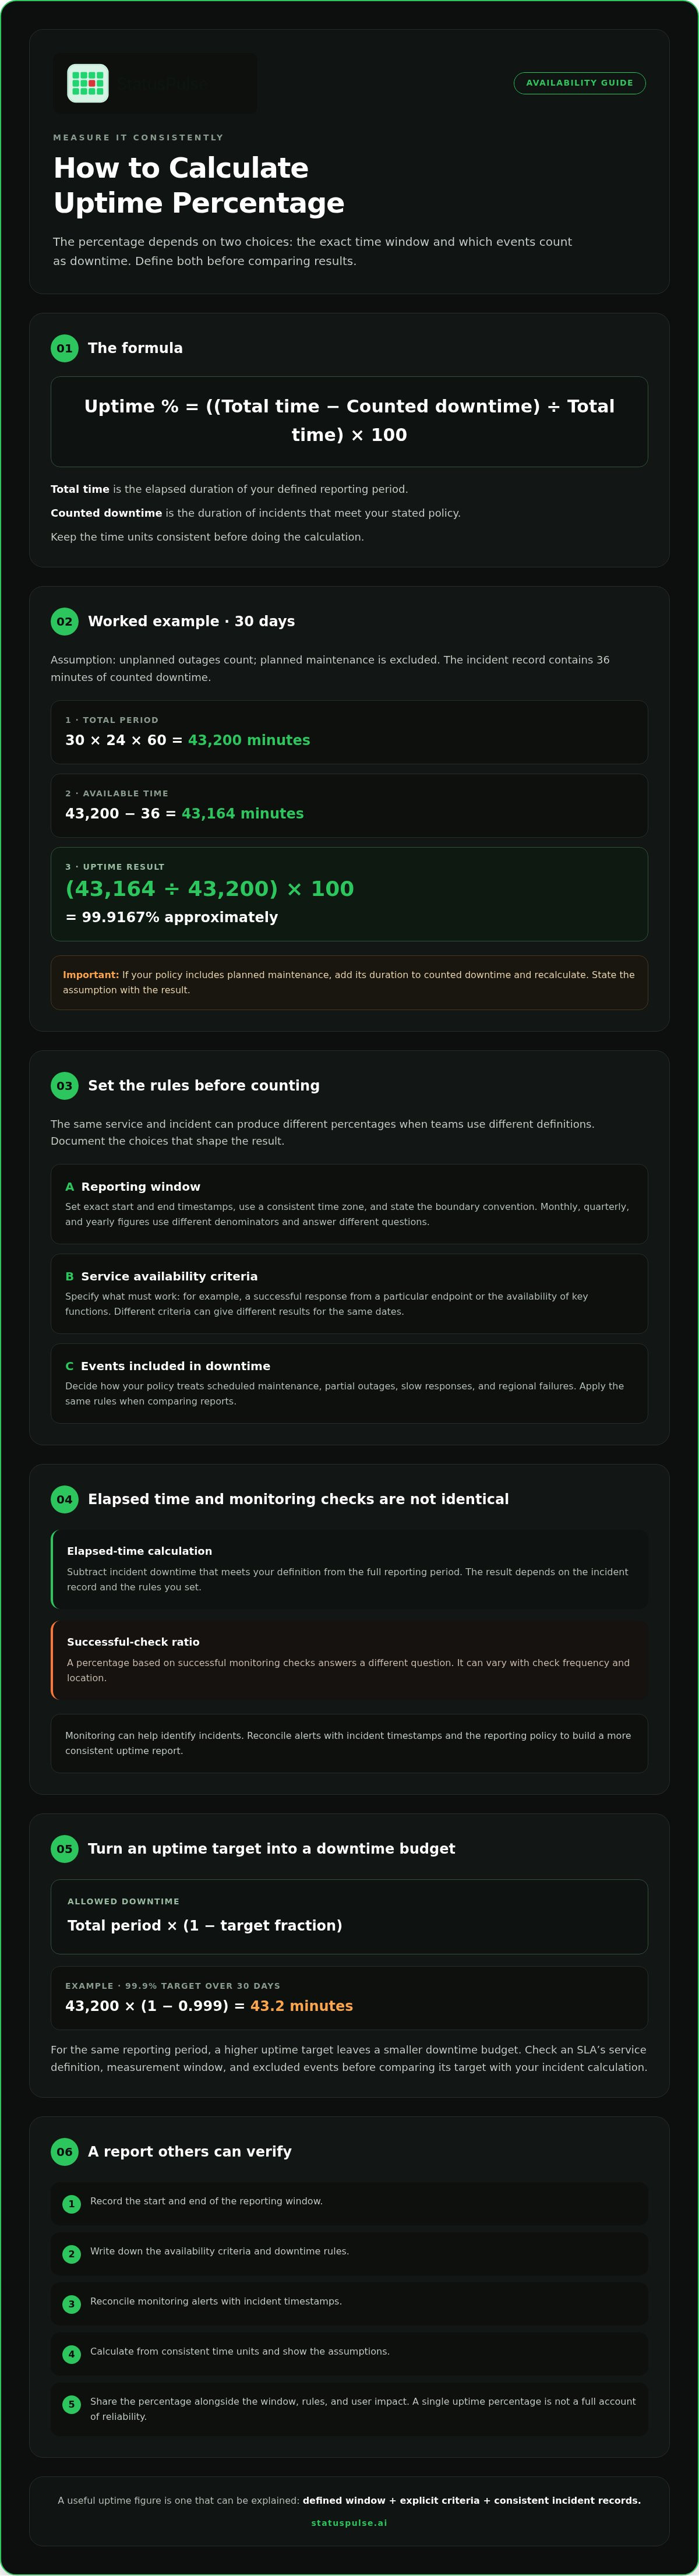
Once you’ve set the reporting window and downtime rules, the arithmetic is direct. Divide available time by total time, then multiply by 100. Or subtract counted downtime from total time before dividing.
Uptime percentage = (available time ÷ total time) × 100
Uptime percentage = ((total time − counted downtime) ÷ total time) × 100
Apply the formula to an incident record
Here’s a 30-day example. Assume the service is measured continuously, and the policy counts unplanned outages but excludes planned maintenance. The incident log contains 36 minutes of counted downtime.
- Total period: 30 × 24 × 60 = 43,200 minutes
- Available time: 43,200 − 36 = 43,164 minutes
- Uptime: (43,164 ÷ 43,200) × 100 = 99.9167% (approximately)
Keep units consistent: convert the reporting window and every incident duration to minutes, seconds, or another single unit before calculating. If your policy includes planned maintenance, add its duration to counted downtime and recalculate. State these assumptions so the percentage can be interpreted correctly.
Convert uptime targets into allowed downtime
To find a downtime budget, multiply the total period by one minus the target expressed as a decimal:
Allowed downtime = total period × (1 − target fraction)
For a 99.9% target over 30 days, that’s 43,200 × (1 − 0.999) = 43.2 minutes. uptime.is displays a 99.9% example of about 43 minutes and 50 seconds per month, based on continuous service; monthly totals vary with the number of days in the period. Treat calculator results as estimates unless their time window and assumptions match your reporting policy.
Higher uptime targets leave a smaller downtime budget for the same reporting period. That budget can help frame a Service Level Agreement (SLA), but check how the agreement defines the service, measurement window, and excluded events before comparing its target with your incident calculation.
If you’re assembling uptime records alongside customer updates, uptime monitoring and public status pages can help keep incident timelines and service communication together.
What Counts as Downtime? Set Rules Before Comparing Results
A percentage can change even when the service hasn’t. If one report excludes maintenance and another counts it, or one treats a regional failure as downtime while another doesn’t, the results aren’t directly comparable. Define the rules before calculating or comparing uptime.
Two common methods use different evidence:
| Method | Calculation basis | What can affect the result |
|---|---|---|
| Elapsed-time incidents | Subtract the duration of counted incidents from the reporting window. | Incident start and recovery timestamps, plus which incidents count. |
| Successful monitoring checks | Successful eligible checks ÷ total eligible checks × 100. | Probe frequency, locations, timeouts, retries, and failed-check rules. |
Elapsed-time calculations use the duration of an incident, not just the number of alerts. Check-based calculations sample service responses. If probes run at intervals, a brief outage between checks may go undetected. A failed check might also reflect a temporary probe or network issue. Document whether one failed check is enough to mark downtime, or whether retries or multiple probe locations must confirm it.
Maintenance, regional failures, and partial service
State whether scheduled maintenance counts as downtime in your internal measurement policy or contract. Neither choice is universal. Apply the same rule to every reporting period, and disclose exclusions alongside the result. Changing exclusions later makes trend comparisons unreliable.
Define the service boundary in terms of what users need to do. Does a regional outage count if customers elsewhere can still use the service? Does a failed login, payment, or key API operation count when the homepage responds? Specify which regions, dependencies, and critical functions determine availability, and how long a degraded response must last before it qualifies.
Also distinguish a complete outage from a partial failure. If the service responds but a core function is unavailable, a simple endpoint check may mark it up while users experience a disruption. Set criteria for errors, timeouts, and unacceptable degradation before reviewing incident records. Formal approaches to availability can use failure and repair measures; the IEEE availability calculation model offers a mathematical perspective, but operational reporting still depends on clear service and downtime definitions.
For each report, preserve the method, exclusions, probe policy, service scope, and reporting window. That makes the calculation reproducible and gives teams a fair basis for comparing results over time.
How to Calculate Uptime From Monitoring Data and Incident Logs
Monitoring alerts identify possible failures; incident records help establish what happened and when. Reconcile both sources before summing downtime. This turns how to calculate uptime percentage into a repeatable process, rather than just a spreadsheet exercise.
Build a reproducible calculation from timestamps
- Fix the reporting window. Record its start and end timestamps, time zone, and boundary convention.
- Export relevant evidence. Gather monitor events and incident records for the window. Include each event’s start time, recovery time, source, and whether it counts under your policy.
- Reconcile each incident. Compare alert times with incident start and recovery timestamps. An alert may arrive after impact begins or remain active after recovery, so confirm the interval against available application or operational evidence.
- Normalize and clean the records. Convert timestamps to one time zone, flag missing values, remove duplicate records, and merge overlapping counted incidents. Clip incidents that cross the reporting-window boundaries to the portion inside the window.
- Sum counted downtime and validate. Check the total against the source timeline and confirm that no interval was counted twice or silently omitted. Keep the records and assumptions with the reported result.
A simple spreadsheet can track event ID, start, recovery, inclusion decision, and source. For example, if two counted incidents overlap from 10:10 to 10:20, combine their intervals before totaling downtime. Otherwise, those ten minutes may be counted twice.
In pseudocode:
for each event:
normalize timestamps
clip event to reporting window
if event is included:
add interval to counted intervals

merge overlapping counted intervals
downtime = sum(interval durations)
calculate availability using the defined period
Validate probes and missing monitoring data
Compare probe results by location. If one monitoring location fails while others succeed, investigate whether the event reflects regional user impact, a probe-path problem, or both. Apply the service’s stated regional availability rule rather than assuming either result is definitive.
Keep missing observations separate from successful checks. A gap in probe data is unknown, not proof that the service worked. Where available, compare synthetic endpoint checks with application-level evidence, such as error records or transaction outcomes, to see whether endpoint responses match user-facing behavior.
If you need monitoring records to support a consistent incident timeline, review StatusPulse uptime monitoring and assess whether it fits your service and reporting rules.
Use the Uptime Result to Set Targets and Communicate Incidents
A calculated uptime percentage gives your team a consistent way to review service availability. Use it alongside incident history to assess whether an internal objective is realistic and to support Service Level Agreement (SLA) discussions. Compare the target’s permitted downtime with the outages you’ve recorded, then check whether both use the same measurement rules.
A target is a planning and reporting threshold, not a guarantee that the service will meet it or that future incidents won’t happen. A service may meet its percentage target while users still face a serious disruption, such as a key function failing in one region or response times becoming unusable.
Interpret targets without hiding trade-offs
Review the incidents behind the percentage, not just the final figure. Ask whether outages clustered around a dependency, affected a critical user journey, or were concentrated in a specific location. A target can help set priorities, but your team may need additional indicators for latency, error rates, or the availability of individual functions.
When choosing monitoring and measurement methods, match the checks to the service users rely on. Define what counts as available before using monitoring data to assess a target, and confirm that your probes cover the relevant endpoints and regions.
Connect measurement with clear incident communication
A percentage alone can’t describe incident impact, latency, or user experience. Publish the result with its reporting window, calculation method, and exclusions. For example, note whether planned maintenance is included and whether availability applies to all regions or a defined service function. That context helps technical teams and stakeholders interpret the figure on the same basis.
Monitoring records can help establish a consistent timeline: when symptoms began, which checks failed, when recovery was observed, and what the team communicated. Use those records to keep status updates aligned with the incident, while distinguishing confirmed facts from ongoing investigation. AI incident management tools can also assist technical teams in drafting status updates and summarizing outage impact.
If you’re evaluating ways to connect uptime monitoring with customer-facing incident updates, explore StatusPulse monitoring and public status pages. The right setup depends on your service boundaries, reporting rules, and the evidence your team needs to retain.
Make Every Uptime Report Clear and Comparable
Knowing how to calculate uptime percentage starts with two decisions: the reporting window and the rules for counted downtime. Apply them consistently, reconcile incident records with monitoring evidence, and publish the method and exclusions beside the result.
Use the percentage to assess targets and support SLA discussions, but don’t treat it as a complete account of service health. Latency, partial failures, and user impact may need separate measures. Clear incident timelines and status updates help explain what the number alone can’t.
StatusPulse provides uptime and API monitoring, SSL certificate monitoring, public status pages, and AI incident management tools that assist with drafting status updates and summarizing outage impact. Explore StatusPulse uptime monitoring and incident communication to see whether the platform fits your reporting and communication needs.
Define the rules, keep the records, and make each report easy to verify. That’s a solid foundation for better availability decisions.
Frequently Asked Questions
How do you calculate uptime percentage?
Divide available time by total time in the measurement period, then multiply by 100. You can also subtract counted downtime from total time before dividing. To calculate uptime consistently, first state the reporting window and what qualifies as downtime. An outage excluded under one policy may count under another, so the formula alone doesn’t determine the result.
What is the uptime percentage formula with downtime?
Use [(total period − counted downtime) ÷ total period] × 100. Convert every duration to the same unit first. For example, a 30-day period contains 43,200 minutes; subtracting 36 minutes of counted downtime gives approximately 99.9167% uptime. State whether planned maintenance, partial failures, and overlapping incidents count, and merge overlapping periods so unavailable time isn’t counted twice.
How much downtime does 99.9% uptime allow?
The allowance depends on the reporting period and its assumptions. For continuous service, uptime.is shows approximately 43 minutes and 50 seconds per month and 8 hours, 45 minutes, and 57 seconds per year for a 99.9% target. Its calculator uses a 24/7 assumption and notes that figures are approximate. Check the period length and calculation method before comparing these allowances with your own records.
Is uptime percentage the same as availability?
The terms are often used closely, but define them in each report rather than assuming they mean the same thing. Uptime commonly expresses the portion of a period when a service meets its availability criteria. Those criteria may test more than whether a server responds: they might also require users to complete a key operation. State the service-level test, such as a successful API request or completed transaction.
Can successful monitoring checks be used to calculate uptime?
Yes. Divide successful eligible checks by total eligible checks, then multiply by 100. The result can vary with probe frequency, monitoring location, timeouts, and how missing data is handled. A check-based estimate may differ from an elapsed-time calculation using incident start and recovery timestamps. Label the method you used, and don’t silently treat missing checks as successful observations.
What happens if planned maintenance is excluded from uptime?
Excluding planned maintenance reduces counted downtime only when the measurement policy or agreement permits that exclusion. Record the rule before comparing reporting periods, and disclose it beside the result. Don’t change the treatment silently between reports. If a contract defines its own measurement window or exclusions, follow that language rather than assuming one universal rule applies to every service.
How many nines of uptime do I need?
There’s no universal target for every service. Start with user impact, operational needs, incident history, and the downtime budget your team can realistically support. Convert candidate targets into allowed downtime for the same reporting period, then document the measurement rules. A higher target isn’t useful if its definition is unclear or the service can’t meet it consistently. Review the target as service needs change.


