

What if your GraphQL endpoint is up, but a workflow your clients rely on is failing? A request to /graphql can return HTTP 200 while the response contains errors, a resolver times out, or a critical field is missing. That’s why GraphQL API monitoring needs to look beyond endpoint reachability.
Uptime checks still matter. They confirm that a service responds, but they can’t tell you whether a particular operation returns useful data at an acceptable speed. In GraphQL, a failure may affect one field or resolver without taking down the whole API, so a green status check can give an incomplete picture.
This guide explains how to distinguish endpoint availability from operation-level health, choose checks that reflect real client workflows, and connect monitoring signals to incident response. You’ll learn what to assert in synthetic operations, which performance and error signals to track, and where traces can help pinpoint resolver problems. The goal is practical: know when GraphQL is working for users, not just responding to requests.
Key Takeaways
- Check representative GraphQL operations and their returned data, not only whether the endpoint responds.
- Trace failures across client queries, resolvers, and downstream dependencies to find where an operation breaks down.
- Use synthetic checks, telemetry, logs, and distributed traces for different monitoring questions, and account for each signal’s blind spots.
- Build GraphQL API monitoring around critical operations, explicit outcome expectations, and alerts tuned to user impact.
- Turn confirmed signals into a clear response: triage the issue, assess its scope, then prepare a customer-facing update with human judgment.
What GraphQL API monitoring measures beyond endpoint uptime
GraphQL API monitoring checks whether the endpoint is reachable, how quickly it responds, and whether representative queries return the data clients need. Endpoint reachability alone can’t confirm successful data execution. A request can reach the server and receive an HTTP response even when some requested data is missing or incorrect.
GraphQL lets a client request specific fields from a typed data graph. If you’re new to the model, this overview of what GraphQL is explains its design and query execution. For monitoring, check both the transport and the result of executing the operation.
Why a successful HTTP response can still hide a GraphQL failure
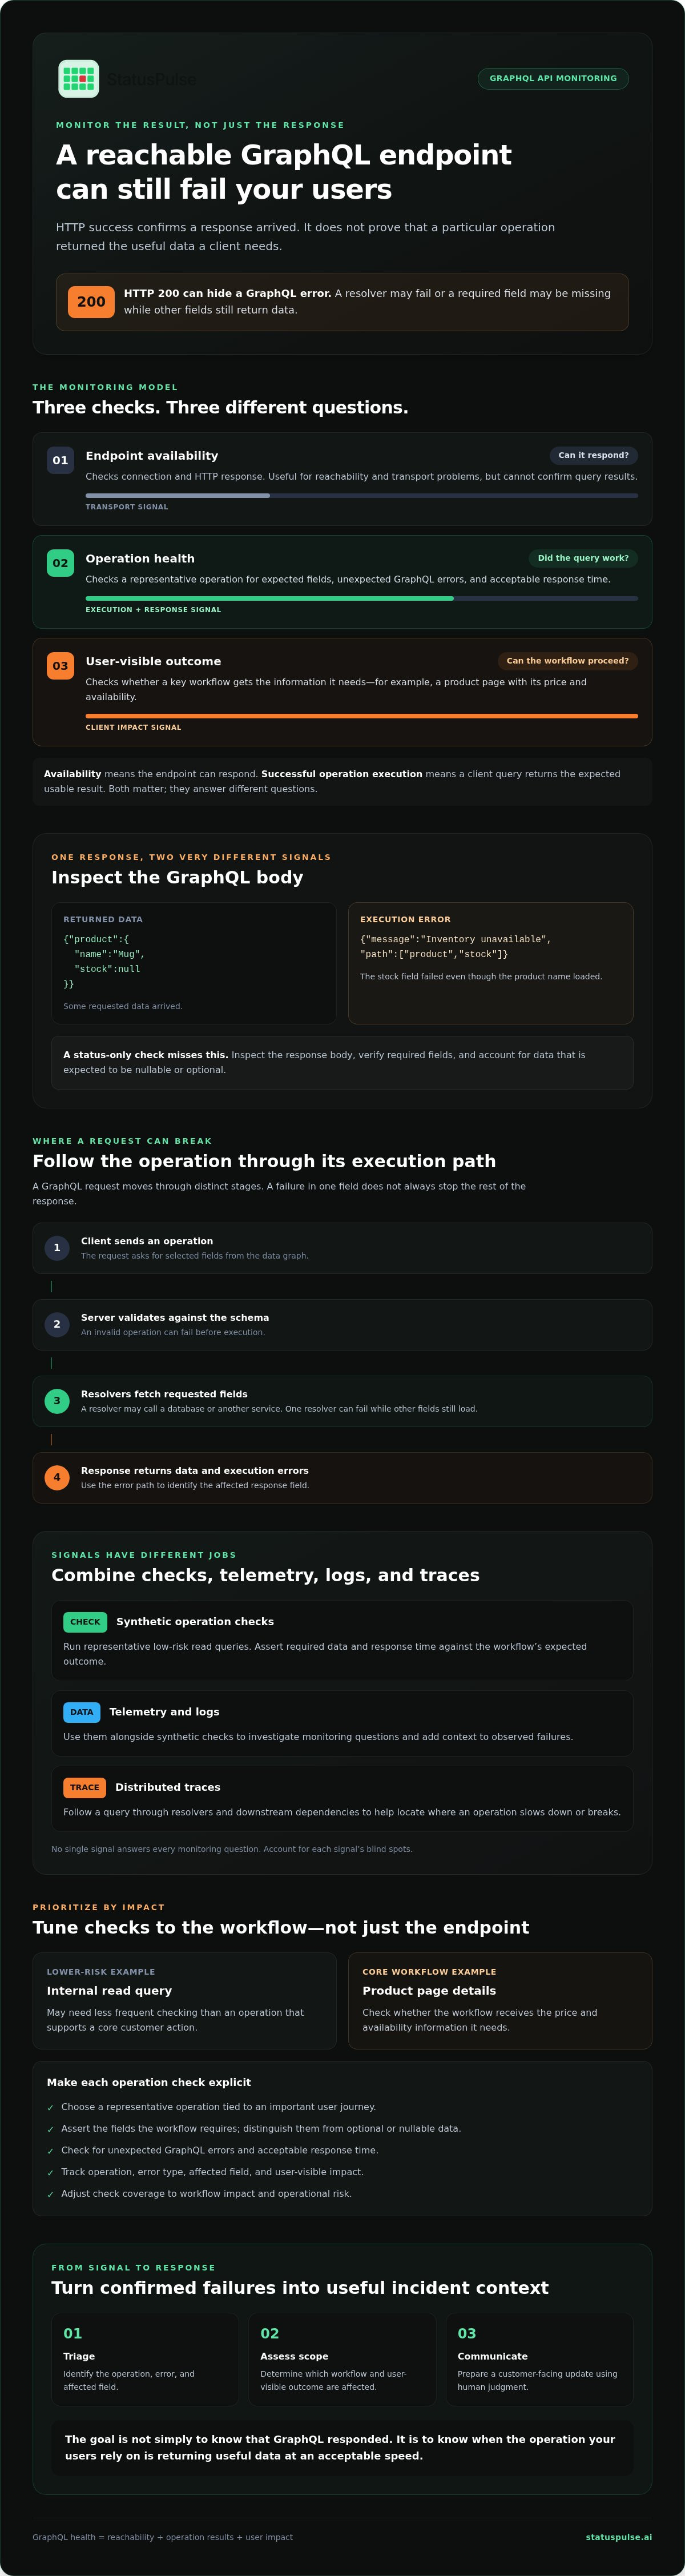
HTTP status and GraphQL response content are separate signals. A network timeout or TLS failure can prevent a valid response from reaching the client. But a server can return a successful HTTP status with a GraphQL errors entry when execution fails for a field. Other fields may still return data.
Simplified example:
{"data":{"product":{"name":"Mug","stock":null}},"errors":[{"message":"Inventory unavailable","path":["product","stock"]}]}
Here, the product name loaded, but its stock field did not. A check that only looks for an HTTP success status would miss the failure. A useful check inspects the response body and verifies required fields, while allowing for expected nullable or optional data.
What to monitor: endpoint, operation, and user-visible outcome
Use separate checks to answer separate questions:
- Endpoint check: Can a client connect and receive an HTTP response? This catches reachability and transport problems, but not broken query results.
- Operation check: Can a representative query execute, return required fields, and avoid unexpected GraphQL errors within an acceptable response time?
- User-visible outcome: Can a key workflow, such as loading a product page with its price and availability, get the information it needs?
Start with low-risk read queries tied to important user journeys. Set assertions for required data and response time, then adjust coverage to match each workflow’s impact and operational risk. A low-risk internal query may need less frequent checking than one supporting a core customer action.
Availability means the endpoint can respond; successful operation execution means a client’s query returns the expected usable result. Both matter, but they answer different monitoring questions.
How GraphQL requests fail: queries, resolvers, latency, and schema changes
A GraphQL request passes through several stages: the client sends an operation, the server validates it against the schema, and execution calls the resolvers needed to fetch each requested field. Resolvers may call databases or other services. The server then returns available data along with any execution errors.
A failure at one stage doesn’t always stop the others. For example, a resolver might fail to fetch a recommendation while product details still load. That has a different user impact from an invalid operation rejected before execution, even if both produce GraphQL errors.
Resolver errors and partial data in GraphQL responses
The path in a GraphQL error can identify the response field where execution failed, such as ["account","recommendations"]. Use that context to group failures by operation and affected field, then connect them to the workflow. A missing recommendation may mean degraded service; a failed account identity field may block sign-in.
Don’t treat every error as equally severe. A client-requested optional field, a resolver exception, and a downstream service timeout can have different causes and consequences. Track the affected operation, error type, and user-visible impact so triage starts with useful context, not just an aggregate error count.
Latency, query complexity, and schema evolution
Measure response time for representative operations. A shared GraphQL endpoint can serve both quick and slow queries, so endpoint-level latency may hide a regression in one client workflow. Operation latency shows the symptom; traces and resolver-level telemetry can help locate the cause, such as a slow database call or an overloaded dependency.
Nested queries can trigger resolver fan-out, where fetching a list and its child fields causes many downstream calls. That can increase latency even while the endpoint remains reachable. GOV.UK guidance recommends teams monitor and audit queries to help manage security and performance risks. Review query depth, complexity, and downstream call patterns when a representative operation slows down.
Schema changes need compatibility checks, but they aren’t automatically breaking. Adding an optional field may leave existing clients unaffected; removing a field or changing its type can break operations that depend on it. Validate proposed changes against known client operations and contracts, then monitor those operations after deployment.
Teams reviewing API monitoring alongside these checks can evaluate StatusPulse API monitoring. Confirm that any tool meets your GraphQL-specific needs, particularly if you require resolver-level visibility.
GraphQL monitoring approaches compared: synthetic checks, telemetry, and logs
GraphQL API monitoring works best when external checks and internal diagnostic signals complement one another. A synthetic request can reveal a broken client-facing operation, while instrumentation, logs, and traces help explain what happened inside the service.
When synthetic GraphQL checks are useful
Choose stable, representative operations that reflect a real workflow, then assert required fields, expected errors, and acceptable response time. Use a dedicated monitoring account with narrowly scoped permissions and test data that won’t alter customer records.
A synthetic check can establish that a selected operation returns an expected result from the check’s point of view; it can’t explain every internal cause or prove that every client operation works.
When traces, metrics, or logs add necessary context
Metrics show whether latency or error rates are changing. Keep labels bounded: avoid raw query text, user IDs, or other high-cardinality values that can overwhelm metric storage. Traces can show where time accumulates across resolvers and dependencies, provided those components are instrumented.
Logs add detailed diagnostic context, but capture only what responders need. Avoid unnecessary query payloads or sensitive field values. The GraphQL official best practices also provide useful guidance on performance and security considerations.
If you’re evaluating API monitoring options, check whether their GraphQL-specific coverage matches your needs. External checks can support availability monitoring, while resolver-level diagnosis may require application instrumentation and tracing.
How to set up GraphQL API monitoring without noisy alerts
Build checks around user impact, not the number of possible queries. A practical GraphQL API monitoring setup starts with critical operations, defines what a valid response looks like, and adds coverage gradually. Then tune alerts against observed behaviour and review them as the service changes.
Start with low-risk read operations tied to important workflows. Set response-time and error thresholds from a measured baseline and your service objectives, not a universal value. A threshold should signal a meaningful departure from normal operation or a user-impacting failure.
Choose representative operations and safe test data
Select stable operations that represent key journeys, such as loading an account summary. Document the required fields, acceptable optional data, expected errors, and response-time objective. Use deterministic variables where possible so changes in test results reflect service behaviour, not changing inputs.
Before increasing check frequency, review query depth and cost controls, plus any applicable rate limits. Keep test credentials scoped to a dedicated monitoring account. Use isolated test records where possible, and avoid real customer data.
Turn monitoring signals into actionable alerts
Alert on sustained failures or patterns that affect users, rather than a single transient error. Include enough context for responders to act: operation name, environment, evaluation time window, failed assertion, and a link or reference to relevant diagnostic data. Assign an owner for each alert so detection has a clear next step.
Keep sensitive data out of alert payloads and logs. Don’t record access tokens, personal data, or full response bodies when a field name and error category will do. Revisit thresholds and ownership after deployments or changes to client operations.
- Credentials: Use a dedicated account with limited permissions, and know where its secrets are stored.
- Test data: Use isolated, predictable records that checks can safely read.
- Query limits: Review depth, cost controls, frequency, and rate limits.
- Alert ownership: Name the responsible team and document the first triage step.
Review alert history regularly. If an alert fires without a corresponding user impact, refine its assertion or threshold. If users report a failure before monitoring detects it, add or adjust a check for that workflow.
For a broader monitoring workflow, explore StatusPulse API monitoring and assess whether it fits your checks and alerting needs.
From GraphQL monitoring signal to clear incident communication
A monitoring alert is evidence, not an incident update. Confirm the signal, assess its impact, then communicate what you know. GraphQL API monitoring may identify a failing operation or elevated latency, but it can’t decide on its own whether the issue affects all users or what should be said publicly.
Decide what the incident means for users
Start triage by checking the affected operation, client workflow, environment, and time period. Compare synthetic check results with application metrics, logs, and traces. This helps distinguish partial degradation, such as one field failing while the rest of a response works, from complete unavailability.
Before declaring scope, check whether the failure is limited to a region, client, or dependency. Look for a consistent pattern across monitoring signals, and keep the initial description narrow until the evidence supports a broader claim. Internal alert channels are for detailed diagnosis; customer updates should focus on verified impact and what the team is doing next.
For details about the company’s API monitoring offering, visit the StatusPulse API monitoring platform.
Connect monitoring with status updates and incident workflow
Once responders confirm customer impact, a public status page can share the affected service or workflow, the known impact, and the current response progress. Keep updates factual. If the cause remains under investigation, say so rather than presenting a hypothesis as confirmed. Update the page as the team learns more, then mark the incident resolved when service has recovered and that recovery is verified.
Logs, traces, and internal alerts remain important for diagnosis. A status page serves a different purpose: it gives customers a consistent place to check service information without exposing internal investigation details. Keep ownership clear so responders know who assesses technical evidence and who approves customer-facing wording.
AI incident management can assist by drafting or summarising incident information for review. It shouldn’t replace human judgment about scope, severity, or wording. A responder should verify the facts before publishing an update.
StatusPulse brings API monitoring, public status pages, and AI incident management together as parts of an incident workflow. If you’re evaluating how those stages fit your process, review the StatusPulse monitoring and status page platform.
Make GraphQL monitoring part of a clear response workflow
Effective GraphQL API monitoring checks whether important operations return useful results, not just whether the shared endpoint responds. Pair representative synthetic checks with telemetry that helps diagnose failures, then set alert thresholds based on observed behaviour and service objectives.
Detection is only the start. Confirm which operations and users are affected before communicating incident scope. Use internal signals to guide triage, and a public status page to share verified impact and response progress. Human review keeps customer updates accurate, even when AI assists with incident summaries.
StatusPulse combines API monitoring, public status pages, and AI-assisted incident management. Check whether its monitoring capabilities match your GraphQL requirements, especially if you need operation- or resolver-level visibility.
Explore StatusPulse API monitoring and incident communication to assess whether the platform fits your monitoring and update workflow.
Frequently Asked Questions
What is GraphQL API monitoring?
GraphQL API monitoring checks endpoint availability and whether selected operations return expected data within an acceptable time. It can also track errors and latency for important workflows. A basic reachability check is a useful start, but it doesn’t prove every resolver or client operation works correctly.
Can a GraphQL API return HTTP 200 and still have errors?
Yes. A GraphQL response can contain both data and an errors field despite an HTTP 200 status. Check the response body against the operation’s expected result. Then assess whether the affected field is optional or whether its failure blocks a critical user journey.
How do you monitor GraphQL queries in production?
Choose representative operations tied to important workflows. Check required fields, unexpected errors, and latency against observed baselines or service objectives. Use scoped test credentials and safe data. Add application telemetry when you need internal diagnosis, and review query cost and rate limits before increasing check frequency.
What should a GraphQL health check test?
Match the check to the signal you need. An endpoint check tests reachability; a synthetic operation checks a specific query and expected response. Neither proves every workflow is healthy. Document each check’s scope and blind spots so responders interpret a passing result correctly.
Should GraphQL monitoring use synthetic checks or distributed tracing?
They serve different purposes. Synthetic checks test selected operations externally. Distributed traces can help locate latency or errors across instrumented resolvers and downstream services. Using both adds coverage, but tracing requires instrumentation and operational effort. Consider data exposure and sampling before expanding it.
How can I reduce false alerts from GraphQL monitoring?
Monitor a small set of meaningful operations and alert on sustained or user-impacting failures. Set thresholds from observed baselines. Include the operation, environment, time window, and diagnostic context, but exclude sensitive data. Review alerts after incidents or application changes and adjust checks that no longer reflect expected behaviour.
Does StatusPulse monitor GraphQL operations specifically?
StatusPulse offers API monitoring, but its product information does not confirm GraphQL-specific operation or resolver-level monitoring. Check current product documentation before relying on those capabilities. Confirm that any tool can assess the response content your application needs, not only endpoint availability.


