

Website downtime costs businesses an average of $5,600 per minute according to 2026 industry reports. If your uptime monitoring service triggers false positives at 3 AM, it's a liability. You likely agree that monitoring should provide clarity. It shouldn't cause alert fatigue or introduce hidden fees for every status page subscriber you add.
This guide evaluates the technical landscape to help you balance global probe precision with incident transparency. We promise a grounded look at consolidating your monitoring and communication tools. No hype. Just a focus on high-frequency checks and automated updates that respect your budget. We'll show you how to move away from fragmented tools and toward predictable, flat-rate pricing.
We compare the top contenders for 2026 infrastructure, focusing on technical depth and data sovereignty. This evaluation covers API monitoring, SSL checks, and the shift toward integrated incident management. You'll find a clear path toward a more reliable, ethical monitoring stack.
Key Takeaways
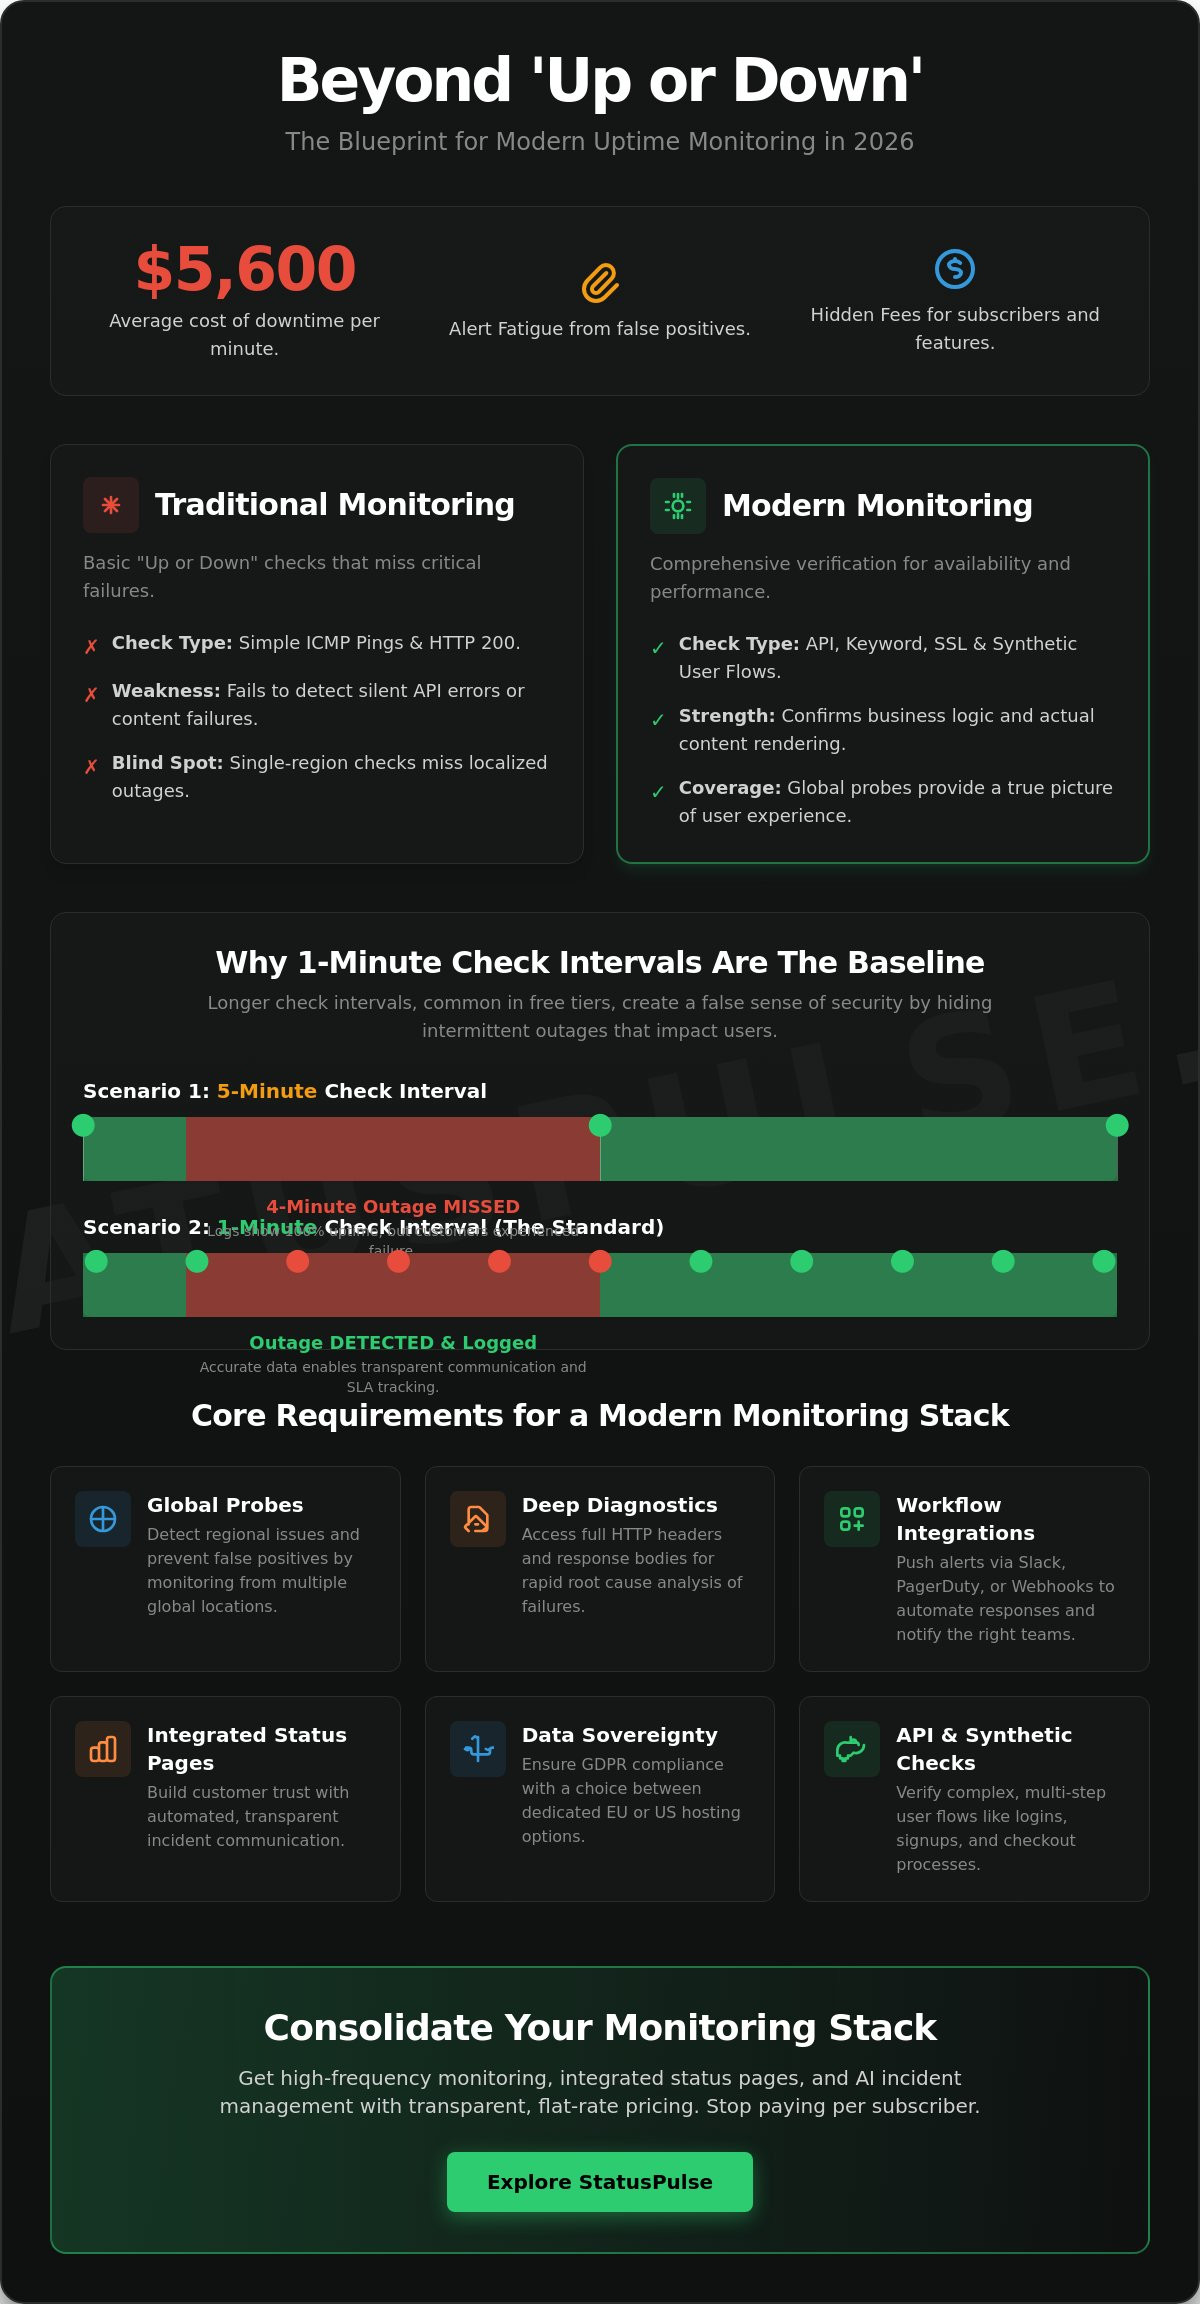
- Learn why 1-minute check intervals are the baseline for production infrastructure and how to avoid the "free tier trap" that hides intermittent outages.
- Discover how to integrate global probe data directly into your developer workflows using Slack, PagerDuty, and custom webhooks.
- Evaluate the total cost of ownership for an uptime monitoring service by identifying hidden subscriber fees and unnecessary enterprise features.
- Understand the role of integrated status pages in reducing incident stress and building long-term customer trust through transparent reporting.
- Navigate data sovereignty requirements by selecting providers that offer dedicated EU or US hosting to ensure GDPR compliance.
Beyond the HTTP 200: Evaluating Uptime Monitoring Services in 2026
An uptime monitoring service is no longer just a binary check. In 2026, it's a comprehensive tool for verifying availability, performance, and security across global nodes. Traditional Website monitoring concepts often focused on ICMP pings. These are insufficient for modern, dynamic stacks. A ping tells you a server is reachable. It doesn't tell you if your React app failed to hydrate or if your API is returning empty JSON objects. In a microservices architecture, a single failing endpoint can cascade. Your monitoring must trace these dependencies to provide a true picture of health.
Monitoring is the bedrock of SLA compliance and customer trust. If you promise 99.9% uptime, you need data that proves it. Basic availability is the floor. Deep synthetic observability is the ceiling. The latter simulates real user interactions to ensure the entire system functions as intended. Transparent reporting starts with accurate data. If your monitoring tool misses a five-minute outage because of a slow check interval, your status page becomes a lie that erodes user confidence.
The limitations of traditional "Up or Down" checks
A green status page can be deceptive. Silent API failures often hide behind a successful HTTP 200 status code. Your load balancer might be healthy, but the underlying service is failing. This makes keyword validation essential. You should check for specific strings in the HTTP response to confirm the page actually rendered. Effective monitoring looks for "Welcome, User" rather than just a header response. This ensures the database and frontend are actually communicating.
Flapping is another challenge. Intermittent connectivity issues can trigger a storm of alerts that resolve themselves seconds later. Effective services use smart retry logic. They confirm a failure across multiple probes before paging your team. This reduces noise and prevents alert fatigue. You don't want to wake up an engineer for a two-second network blip that corrected itself instantly.
Why multi-region probe distribution is non-negotiable
Localized downtime is a common trap. Regional network peering issues or CDN outages can block access for users in London while users in New York see no issues. Relying on a single monitoring node creates a single point of failure for your observability. If your monitoring node is in the same data center as your app, you'll never see the external routing issues your customers face.
Global probes prevent false positives. If one node in Tokyo reports a failure but nodes in Frankfurt and San Francisco are clear, it's likely a regional routing issue rather than a total outage. Multi-region latency checks serve as a proactive reliability measure by identifying performance degradation before it becomes a complete failure. For teams prioritizing transparency, StatusPulse provides this global perspective without the complexity of legacy enterprise tools. This allows you to communicate regional issues to specific user bases before your support inbox overflows.
Core Technical Requirements for Modern Infrastructure Monitoring
A reliable uptime monitoring service must do more than verify a connection. It needs to provide actionable data the moment a service degrades. For mission-critical production endpoints, high-frequency checks at 1-minute intervals are the standard. Longer intervals, like the 5-minute or 10-minute windows common in legacy free tiers, can mask significant outages. If your site goes down for four minutes between checks, your logs will show 100% uptime while your customers experience failure.
Root cause analysis requires depth. When a check fails, your team needs to see exactly what happened. Detailed logging of HTTP headers and response bodies is essential. This allows you to distinguish between a gateway timeout and a malformed JSON response from your backend. Integration with developer workflows ensures these insights reach the right people. Your monitoring should push alerts to Slack or PagerDuty instantly. For custom logic, robust webhooks allow you to trigger automated failover scripts without human intervention.
API and Synthetic monitoring for complex flows
Static page checks aren't enough for modern applications. You need to monitor POST requests and authenticated endpoints using custom headers. This verifies that your checkout process or user login actually works. Synthetic checks simulate these user journeys to ensure your business logic remains intact across updates. For a deep dive into implementation, consult our API Monitoring guide. It details how to structure these tests for high availability in 2026.
SSL and Domain expiry as proactive defense
SSL monitoring is often the most overlooked part of an uptime strategy. A single expired certificate can trigger "Connection Not Private" errors. This destroys brand credibility instantly. Your monitoring should automate alerts at 30, 15, and 7 days before expiration. This provides ample time for renewal, especially for certificates requiring manual intervention. Domain expiry tracking serves a similar role, preventing catastrophic loss of your primary assets.
Internal networks require a different approach. Private probe locations allow you to monitor services behind a firewall or within a VPN. This ensures your internal tools are as reliable as your public-facing ones. If you're looking for a platform that balances these technical requirements with a straightforward interface, StatusPulse offers the precision DevOps teams need without the enterprise bloat.
Comparing Monitoring Models: Free Tiers vs. Enterprise Bloat vs. Transparent SaaS
Choosing an uptime monitoring service often feels like a trade-off between two extremes. You either settle for a restrictive free tier or pay for an enterprise observability platform with features your team will never use. Many organizations find themselves trapped in the middle. They outgrow basic pings but aren't ready to pay for full-stack APM or Real User Monitoring (RUM) suites that cost thousands per month. The goal is to find a specialized tool that provides precision without the corporate bloat.
Enterprise platforms often bundle uptime with complex infrastructure monitoring. While these all-in-one observability tools are powerful, they require significant configuration time. If you only need to ensure your API is reachable and your SSL certificates are valid, paying for a massive data ingestion engine is inefficient. A specialized SaaS provides a faster path to reliability. It allows your team to focus on fixing incidents rather than managing the monitoring tool itself.
The hidden costs of "Free" monitoring services
The most common trap is the generous free tier. Legacy providers often offer dozens of monitors for free, but these typically come with 5-minute check intervals. In a production environment, a five-minute delay is an eternity. If your service fails right after a check, you won't receive an alert for nearly 300 seconds. This delay directly inflates your Mean Time To Resolution (MTTR).
Lack of integrated communication is the other hidden cost. Free services rarely include public status pages with automated updates. When an outage occurs, your support team is buried under tickets because customers have no way to verify the system status. For a deeper look at these trade-offs, read our analysis on The Myth of Free Monitoring. It breaks down the actual ROI of paid vs. free monitoring in 2026 infrastructure.
Why StatusPulse offers a principled pricing philosophy
We built StatusPulse as a rebellious alternative to legacy pricing models. Most competitors charge a "success tax" by billing you per status page subscriber. As your user base grows, your monitoring bill increases, even if your infrastructure stays the same. We believe this is unethical. Our flat-rate pricing ensures your costs remain predictable regardless of how many customers follow your updates.
Our focus is entirely on the developer experience. We provide a streamlined, all-in-one platform that combines high-frequency monitoring with public status pages and AI-driven incident management. There is no corporate bloat or unnecessary upsells. You get the technical precision of an enterprise tool with the simplicity of a specialized SaaS. By hosting in your choice of EU or US regions, we also ensure your monitoring data respects local privacy standards without adding technical complexity.
Solving the Incident Communication Gap with Integrated Status Pages
Technical precision is only half of the reliability equation. If your uptime monitoring service detects a 504 Gateway Timeout but your users are left staring at a loading spinner, the incident isn't being managed. It's just happening. Monitoring without communication is a technical failure. When downtime costs an average of $5,600 per minute as of February 2026, every second of silence increases the financial and reputational impact. A public status page bridges this gap by converting raw logs into human-readable trust.
Transparency has a psychological effect on your users. They are generally more patient when they see an active investigation in progress. An integrated workflow automates the transition from "Down" alert to "Incident Logged" status. This removes the manual step of an SRE logging into a separate communication tool while the house is on fire. Industry professionals report that a visible, real-time status page can reduce incoming support ticket volume by up to 50% during a major outage. This allows your team to focus on the technical fix instead of answering repetitive emails.
Using AI to bridge the gap between SREs and customers
Translating technical logs into customer updates is difficult during a high-stress disruption. AI-assisted drafting helps by converting complex error codes into clear status updates. It maintains a consistent, calm voice even when your engineers are deep in a terminal. For organizations operating across borders, this communication must be as distributed as the infrastructure itself. You can find more on this in our technical guide to Status Page for Multi-Region Services.
Customisation and Branding for Public Status Pages
Your status page should feel like a part of your application, not a third-party add-on. We prioritize clean, white-label designs that omit brand watermarks. This keeps the focus on your service. Configuring CNAMEs and SSL for custom domains is a standard requirement for professional infrastructure. This ensures the communication remains secure and on-brand. You can also integrate these updates directly into your application UI via an API. This informs users of issues before they even attempt a failing action.
If you are tired of paying premium add-on fees for basic communication tools, build a transparent status page that integrates natively with your monitoring workflow today.
Selecting the Right Service for Your DevOps Stack
Choosing an uptime monitoring service shouldn't be a decision based on marketing pings alone. It needs to fit into your existing automation pipeline. If you can't automate monitor creation through an API, the tool will eventually become a bottleneck for your DevOps team. You need a solution that respects your time and your data. This means looking beyond basic features to evaluate how a service handles migration, automation, and regulatory compliance.
Migration shouldn't be a project in itself. Look for tools that support CSV imports or have a robust REST API for bulk monitor creation. This allows you to migrate from legacy tools without manual overhead. Integrating these tools into your CI/CD pipeline ensures that every new deployment includes an automated health check. When you treat monitoring as code, you reduce the risk of human error during production releases.
EU vs US Hosting: A regulatory necessity
The impact of Schrems II on where your monitoring metadata is stored is a critical consideration for 2026 infrastructure. European enterprises must ensure that their observability data doesn't violate GDPR standards through improper international transfers. StatusPulse provides a principled choice by allowing you to select between EU and US hosting regions during account setup. Data sovereignty is a core feature for European enterprises that must maintain strict control over their observability metadata. This regional focus ensures you meet compliance requirements without sacrificing technical precision.
Final checklist for 2026 infrastructure monitoring
- Check Frequency: Does the service offer 1-minute intervals for all production monitors?
- Global Probes: Are there enough geographic nodes to prevent false positives?
- API Access: Can you create, update, and delete monitors via a developer API?
- Integrated Communication: Does the plan include public status pages without per-subscriber fees?
- Compliance: Does the provider offer hosting in your required region (EU or US)?
Getting started with a modern monitoring stack
A modern monitoring stack should be functional within minutes. You can move from account creation to your first global check in about five minutes. Establishing a public status page immediately provides the transparency your users expect during future incidents. It's about moving away from fragmented tools and toward a unified, ethical alternative. Build trust with StatusPulse today and simplify your incident management workflow with a tool built by specialists for specialists.
Building a Resilient Monitoring Strategy for 2026
Reliability in 2026 requires more than just catching a server failure. It demands a strategy that integrates deep synthetic observability with transparent incident communication. You've seen how legacy models often punish growth with per-subscriber fees or hide critical outages behind slow check intervals. Transitioning to a modern uptime monitoring service means prioritizing technical accuracy and regional data sovereignty. It's about ensuring your infrastructure remains visible and your customers stay informed without the burden of corporate bloat.
We built our platform to solve these specific frustrations for DevOps teams. You get AI-powered incident management for faster updates and clear, flat-rate pricing. There are no hidden costs for keeping your users informed. By choosing between EU or US data hosting, you maintain total control over your metadata while meeting strict local regulatory standards. Our focus remains on providing a meticulous, principled tool for specialists who value precision and technical depth.
It's time to move away from fragmented enterprise suites and unreliable free tiers. Focus on a solution that values integrity and straightforward functionality as much as you do. Start monitoring your infrastructure with StatusPulse and regain control over your incident workflow today.
Frequently Asked Questions
What is the difference between uptime monitoring and synthetic monitoring?
Uptime monitoring verifies basic availability by checking for an HTTP 200 response or a successful ping. Synthetic monitoring simulates complex user journeys, such as logging into an account or completing a checkout. While uptime checks tell you if the server is reachable, synthetic checks confirm that your application logic and database integrations are actually functioning.
Is a 1-minute check interval really necessary for my website?
High-frequency checks are essential for production environments where every minute of downtime has a financial impact. A five-minute interval can miss short outages, leading to "silent" failures and inaccurate SLA data. Using a professional uptime monitoring service with 1-minute intervals ensures you catch transient issues before they escalate into major incidents.
How does an uptime monitoring service prevent false positives?
Reliable services use multi-region verification to confirm a failure before triggering an alert. If one probe in Tokyo reports an error but probes in London and New York see a healthy service, the system identifies it as a regional routing issue. This prevents waking up your DevOps team for localized network blips that don't represent a total outage.
Can I monitor internal servers behind a firewall?
Yes, you can monitor internal services using private probes or agents. These are lightweight tools you install within your private network to check services that aren't exposed to the public internet. This ensures that your internal APIs and databases remain as healthy and observable as your public-facing infrastructure.
Why should I pay for a status page when I can build my own?
Building your own status page often leads to a single point of failure. If your primary infrastructure goes down, your home-grown status page likely goes down with it. A dedicated provider hosts your status page on separate infrastructure, ensuring you can communicate with customers even during a total system collapse.
Does StatusPulse offer EU-based data hosting for GDPR compliance?
We provide a choice between EU and US data hosting regions. This allows European enterprises to meet strict data sovereignty requirements and maintain GDPR compliance by keeping monitoring metadata within the EU. You select your preferred region during the initial account setup process.
How many subscribers can I have on my public status page?
StatusPulse supports unlimited subscribers on your public status page. We don't believe in charging a "success tax" that increases your bill as your company grows. Our flat-rate pricing model ensures your costs remain predictable regardless of how many users follow your incident updates.
Can I automate incident updates using AI with StatusPulse?
You can use AI-assisted drafting to convert technical logs into human-readable incident updates. The system suggests clear language based on the error data, which helps maintain a calm voice during high-stress disruptions. You always retain final human agency to review and publish the update to your status page.


