
A global status indicator is a form of technical debt. It converts a minor regional hiccup into a brand-wide crisis by suggesting a total blackout when only one cluster is struggling. If us-east-1 experiences a spike in latency, your customers in Frankfurt shouldn't see a "Major Outage" banner that doesn't affect their workflow. This lack of granularity creates friction and erodes trust.
You likely understand the stress of managing false alarms that trigger unnecessary global panic. This guide shows you how to architect a status page for multi-region services that accurately reflects regional health. You'll learn to segment availability data, reduce support ticket volume during localized incidents, and maintain data residency compliance. We'll look at mapping complex infrastructure to public components without the usual enterprise bloat or confusing pricing models. By the end, you'll have a blueprint for providing global transparency that respects both your team's time and your users' peace of mind.
Key Takeaways
- Prevent unnecessary global panic by replacing single-indicator health bars with segmented regional views.
- Map Active-Active and Active-Passive infrastructure models to specific public-facing components for accurate reporting.
- Deploy edge-based monitoring to capture regional latency and availability issues that centralized checks often miss.
- Configure a status page for multi-region services to filter communication and reduce support ticket spikes during localized disruptions.
- Streamline incident response using regional notices that provide technical clarity for SREs and peace of mind for users.
Why Global Status Indicators Fail Multi-Region Architectures
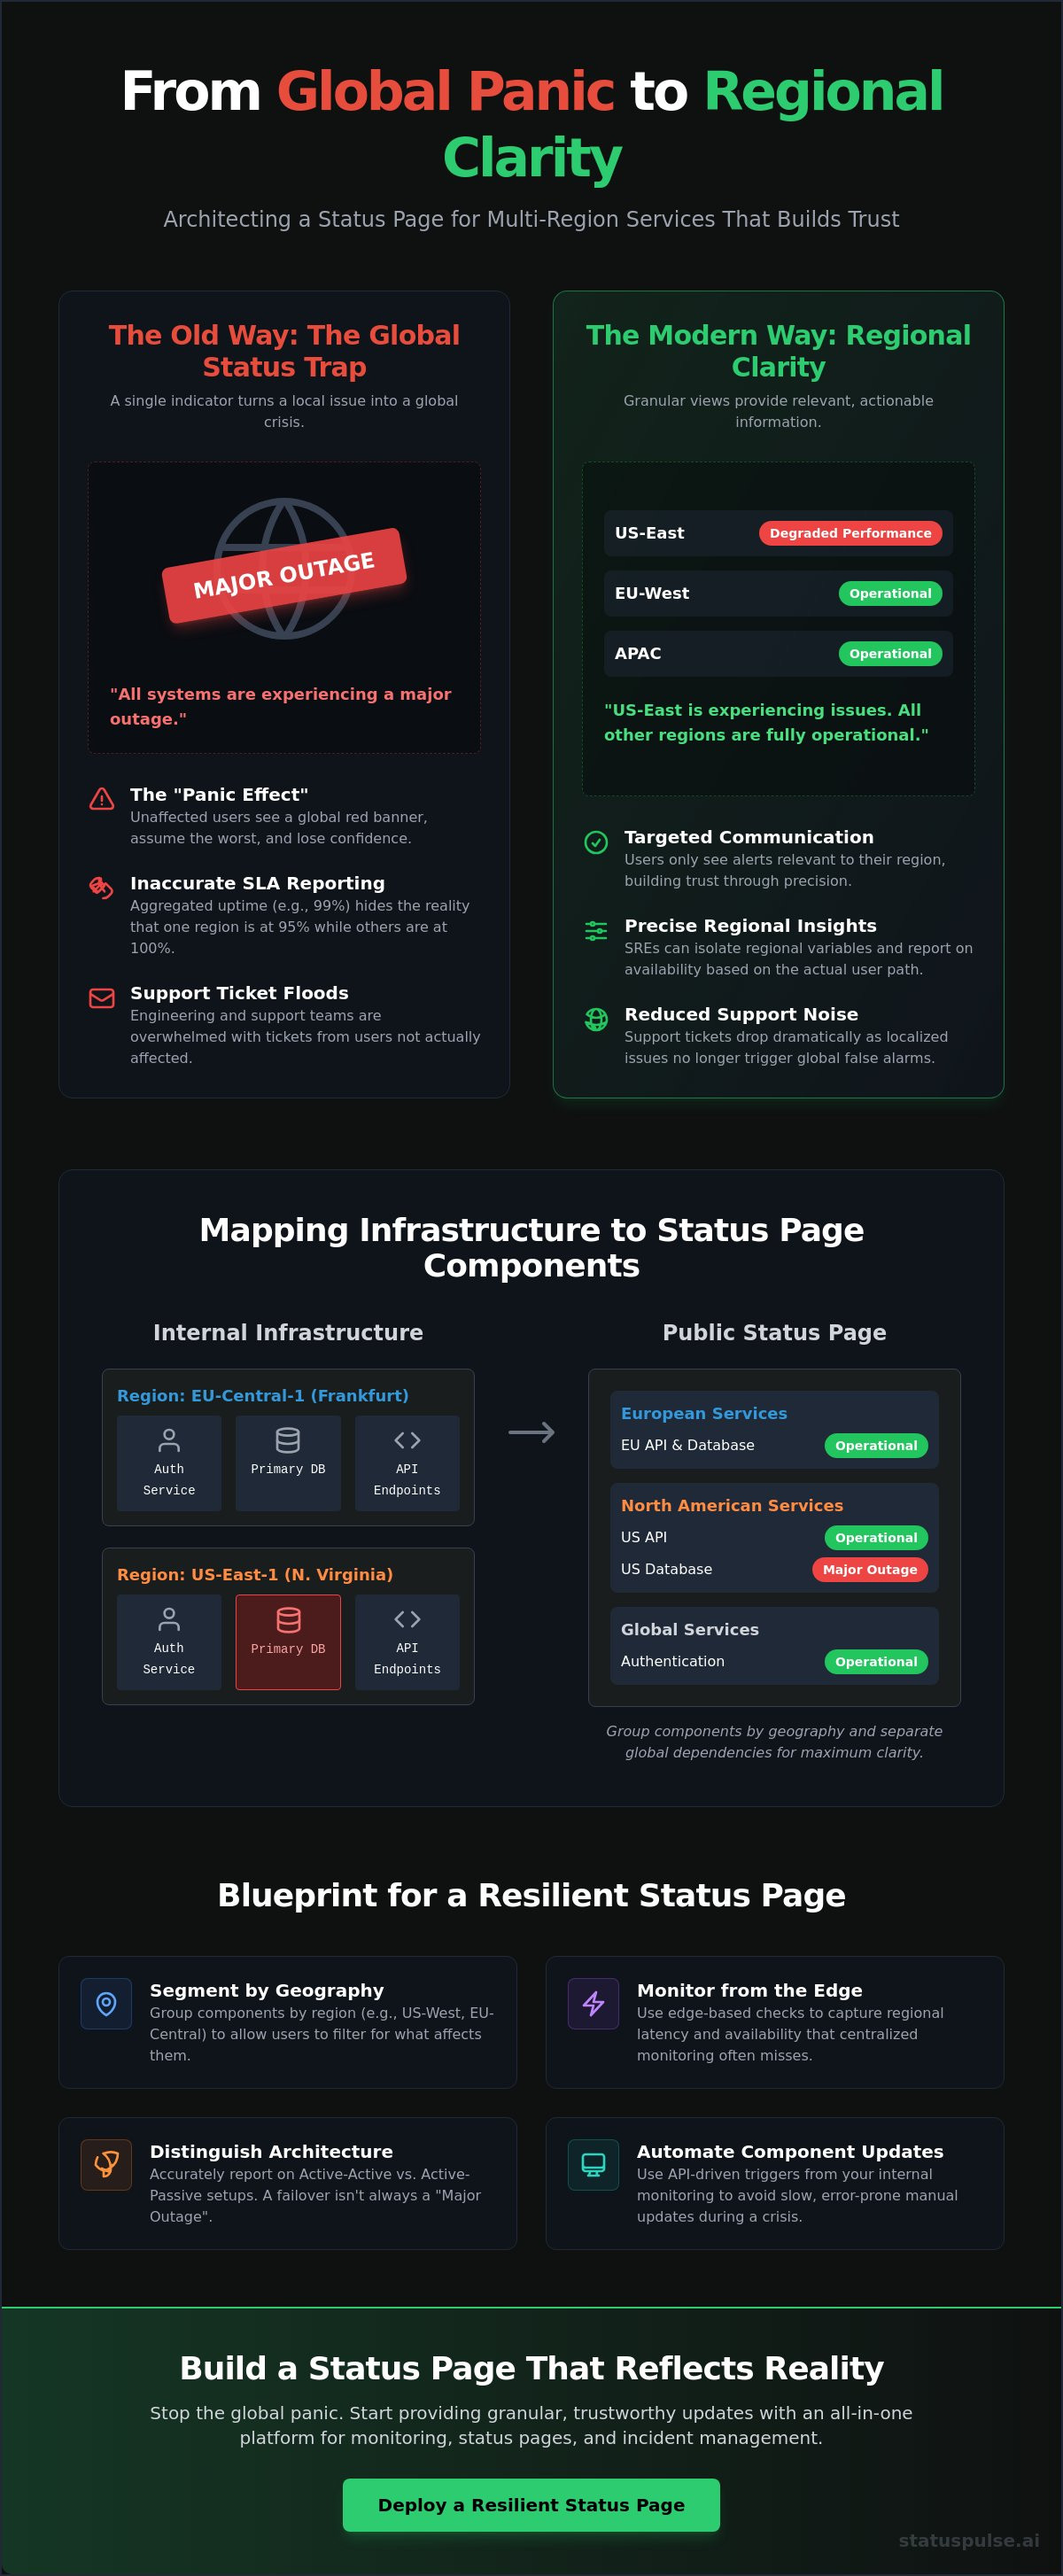
A global status indicator is a blunt instrument. In a distributed system, it lacks the precision needed to communicate the reality of your infrastructure. If you have users in London and New York, and a database cluster in us-east-1 goes down, your London users shouldn't see a red banner. A status page for multi-region services acts as a segmented communication interface. It maps specific infrastructure clusters to the users they actually serve, ensuring that transparency doesn't turn into confusion.
The "Panic Effect" occurs when a global status page turns red for a localized issue. Support teams get flooded with tickets from users who aren't even affected. These users open tickets because they assume the whole platform is dying, even if their specific region is healthy. This wastes engineering resources and destroys the signal-to-noise ratio during an active incident. A single "All Systems Operational" badge is binary and brittle; it ignores the reality of modern architecture and data residency requirements.
If your status reporting doesn't account for where data is hosted, such as the distinction between EU and US hosting, you're failing to provide the transparency required by modern regulatory standards. Maintaining regional integrity in your reporting is no longer optional for teams managing global traffic. It requires a move toward granular observability that honors the physical location of the service.
The Psychology of Incident Communication
Transparency builds trust only when the information is relevant to the person receiving it. Users in Asia will generally ignore outages in Europe if the communication is clearly segmented. When they see a "Regional Service Degradation" notice specifically for Frankfurt, they acknowledge the team is working but don't stop their own work. Contrast this with a "Global Major Outage" label, which triggers immediate anxiety and a loss of confidence. Looking at how major platforms manage visibility, including the history of Wikipedia's server status page, shows that clear, localized communication is critical for global audiences. Granular transparency allows you to be honest without being alarmist.
Technical Constraints of Unified Status
Aggregating 99.99% uptime across five disparate regions is a mathematical trap. If four regions have 100% uptime and one has 95%, the "global" average might look acceptable at 99%, but the affected users are experiencing a total failure. This skews SLA reporting and hides systemic regional issues from stakeholders. Regional segmentation is a prerequisite for enterprise-grade observability. It allows SREs to isolate variables and report availability based on the actual user path. Platforms like StatusPulse help solve this by allowing you to group components by geography, ensuring your public reporting matches your internal monitoring reality. This approach moves the status page from a marketing afterthought to a core piece of your technical stack.
Mapping Infrastructure to Status Page Components
The architecture of your status page for multi-region services should mirror your deployment strategy. If you run Active-Active, a single region outage might be a non-event for users due to automated load balancing. In this case, reporting a "Major Outage" is factually incorrect. However, in Active-Passive setups, the transition period is often visible. You must decide whether to expose the raw health of your regional clusters or the aggregate health of the service as perceived by the client.
Group components by geography, such as US-West or EU-West. This helps users quickly identify if an issue affects them. Separate global dependencies like Auth, DNS, and your CDN from region-specific resources like API endpoints and database clusters. Following established Emergency Communications Tips, prioritize brevity and clarity in these mappings. Don't overwhelm users with internal server names; use names that match the regions they selected during sign-up.
Component Hierarchy Patterns
A "Region-First" hierarchy is the standard for platforms with strict data residency. It allows users to collapse irrelevant regions, keeping the focus on their local environment. Alternatively, a "Service-First" approach works if your features are global but experience regional latency. Some teams use "Follow-the-Sun" visibility to highlight maintenance only during local off-peak hours. This prevents a 2:00 AM maintenance window in London from alarming a user starting their workday in San Francisco.
Automating Component Updates
Manual status updates are slow and error-prone during a crisis. Use API-driven triggers to link your internal monitoring directly to your status components. This ensures that when a regional monitor detects a failure, the page updates instantly. Be careful with sensitivity settings to avoid "flapping" statuses that flicker between red and green. A stable, slightly delayed update is often better than a hyper-reactive one that causes unnecessary alerts.
For teams looking to implement these patterns without building custom tooling, StatusPulse provides native regional grouping and automated sync. It's a straightforward way to align your public reporting with your actual infrastructure.
Monitoring at the Edge: Regional Latency and Availability
Centralized monitoring is a technical blind spot. If your monitoring agent sits in a Virginia data center, it won't see the peering issue affecting users in Berlin. This distance creates a false sense of security. A status page for multi-region services is only as honest as the data feeding it. You need probes that live where your users live.
Regional variance is a common source of support friction. A service might be perfectly healthy in London while New York experiences a total timeout. These localized failures often stem from regional load balancer misconfigurations or specific ISP routing loops. Synthetic monitoring helps verify these regional API endpoints by executing multi-step user journeys from the edge rather than simple pings.
SSL certificates require regional scrutiny too. If you utilize regional load balancers, each ingress point often manages its own certificate chain. Monitoring only the global entry point is insufficient. You must verify the certificate status at every regional gateway to prevent localized "Privacy Error" warnings that scare off users. StatusPulse automates this by checking certificates from multiple global locations simultaneously.
Detecting Regional Latency Spikes
Latency is often the precursor to a complete outage. You should set regional thresholds based on p99 metrics rather than global averages. A 200ms spike in EU-Central might indicate a "noisy neighbor" issue in a shared cloud environment. It's best practice to monitor API performance at the regional level to identify these bottlenecks before they trigger a circuit breaker.
Alerting on latency prevents the "it's working but slow" complaints that flood support queues. By the time a user notices the lag, your status page should already reflect a "Degraded Performance" state for that specific region. This proactive reporting validates the user's experience and reduces the urge to open a ticket.
Data Sovereignty in Monitoring
GDPR and other data residency laws make the location of your monitoring infrastructure a compliance concern. If you manage a GDPR-sensitive application, sending traffic logs or headers to a US-based monitoring provider can complicate your privacy posture. Hosting your status data in the same region as your application, such as utilizing EU-based hosting for EU-based apps, simplifies your regulatory burden.
Relying on US-only monitoring can undermine your claims of regional data sovereignty. It's often better to use a platform that offers a choice between EU or US hosting for both the monitoring data and the public status page. This ensures that even your incident communication remains within the required geographic boundaries. This alignment between infrastructure and reporting is a core requirement for modern enterprise transparency.
Incident Communication Strategy for Regional Outages
The communication clock starts ticking the moment an alert fires in a specific cluster. For a status page for multi-region services, the workflow must move from verification to isolation. SRE teams confirm the regional impact, then draft a notice that targets only the affected user base. This prevents the "Global Major Outage" label from appearing to customers who are experiencing perfectly normal service. It isolates the noise and preserves your brand's credibility in healthy regions.
There's a clear divide between internal and public communication. Internal logs contain raw stack traces and sensitive infrastructure details needed for remediation. Public notices require a translation into human-readable impact. Don't leak technical jargon that confuses the end user. Once the incident is resolved, post-mortem documentation should focus on why the regional failure occurred and how the failover performed. This level of transparency proves that your multi-region architecture is a deliberate choice, not just a marketing claim.
Drafting Updates with AI Assistance
AI can act as a useful assistant for drafting incident summaries. It helps strip away the panic and provides grounded, factual descriptions of the event. However, human agency is non-negotiable. An engineer must always review and approve AI drafts before they go live. A bot doesn't understand the nuance of your specific customer relationships or the ethical weight of a service failure. It's a tool for speed, not a replacement for judgment.
Be honest about the state of your failover. If you're in the middle of a DNS migration or a database promotion, say so. Don't promise a "seamless" transition if there's a known period of read-only access. Users appreciate technical honesty over vague corporate reassurance. Clear communication during the failover process reduces the urge for users to refresh the page or contact support.
Managing Subscriber Notifications
Subscription fatigue is a real threat to effective communication. Give your users the option to follow only the regions that matter to them. A developer in Berlin doesn't want an SMS at 3:00 AM about a latency spike in Oregon. Targeted notifications ensure that when a user receives an alert, it's actually relevant to their workflow. This increases the open rate and trust in your status updates.
Be wary of the pricing models used by many industry incumbents. Some platforms charge per-subscriber fees, which effectively penalizes you for growing your user base or being transparent. This bloat is unnecessary. You should be able to use uptime monitoring to trigger automated, regional subscriber alerts without worrying about a ballooning monthly bill. Incident management should be about solving problems, not managing subscriber costs.
If you're tired of complex pricing and want a straightforward way to manage regional transparency, start using StatusPulse for regional incident management.
Building a Resilient Status Page with StatusPulse
Implementing a status page for multi-region services shouldn't require a complex procurement process or a total redesign of your monitoring stack. StatusPulse provides a unified platform where regional component grouping is a native feature. You can map your infrastructure to specific geographic clusters, ensuring that your public reporting matches your actual deployment reality. This granularity prevents the "panic effect" discussed earlier by isolating incidents to the affected user base.
Data sovereignty is a core principle of the platform. You have the choice between EU or US hosting for your status data. This ensures your incident communication remains compliant with local data residency laws, mirroring the hosting standards of your production environment. By keeping your monitoring and status data within the same jurisdiction as your users, you simplify your regulatory burden and build technical trust.
The platform also integrates AI incident management to assist your SRE team during a crisis. As we established in the communication strategy, human agency remains the final step. The AI acts as a technical assistant, drafting factual summaries based on regional impact that your team can verify and publish in seconds. This speed is critical when every minute of silence during a regional outage increases support ticket volume.
Flat Pricing for Global Scale
Industry incumbents often rely on per-subscriber pricing models. This creates a "transparency tax" where your costs increase as you grow your audience. We believe this model is unethical and counterproductive for growing SaaS teams. StatusPulse uses a flat pricing structure that includes unlimited subscribers on all paid tiers. You won't face surprise bills because an incident went viral or your user base doubled.
Regional monitoring is included as a standard feature, not an expensive add-on. You get access to a global probe network that allows you to verify availability from the same regions where your customers reside. This predictable cost model allows you to focus on system reliability rather than managing a ballooning budget for incident communication tools.
Implementing Your Multi-Region Page
Transitioning to a regionalized status page is a logical step for any distributed application. You can move from a blunt global indicator to a granular, honest interface in minutes. Follow this checklist to get started:
- Define your clusters: Group your components by geography (e.g., EU-West, US-East, APAC).
- Automate your data: Link your regional API and database components to specific monitors.
- Configure alerts: Enable subscriber notifications so users can follow only the regions relevant to them.
You can begin by setting up 1-minute uptime checks from multiple global locations to see the regional variance in your own app. If you're tired of corporate bloat and complex pricing, start a free trial with StatusPulse. There is no marketing hype; just a straightforward tool built for specialists who value precision and transparency.
Scaling Global Transparency with Regional Precision
Moving beyond a binary "up or down" status is a prerequisite for any service operating across borders. You've seen how a status page for multi-region services prevents localized failures from triggering global brand damage. By mapping infrastructure to specific geographic components and monitoring from the edge, you provide the technical clarity your users expect. This approach doesn't just reduce support tickets; it builds long-term trust through honest, granular communication.
StatusPulse handles these complexities without the corporate bloat or per-subscriber fees typical of industry incumbents. You get the choice of EU or US data hosting to meet sovereignty requirements and AI-powered incident drafting to assist your team during high-pressure outages. With flat, transparent pricing, you can scale your audience without worrying about a ballooning monthly bill. It's a straightforward tool designed by specialists for specialists.
Build your multi-region status page with StatusPulse and start reporting with confidence. It's time to align your public communication with your actual engineering excellence.
Frequently Asked Questions
What is a multi-region status page?
A multi-region status page is a communication interface that segments service health by geographic area instead of using a single global indicator. It prevents localized outages in one cluster from appearing as total platform failures to users in unaffected areas. By providing this level of granularity, you ensure that transparency doesn't lead to unnecessary panic. It is a critical tool for any organization managing distributed infrastructure across multiple data centers.
How do I handle shared global services on a regional status page?
Shared services like DNS, Auth, and global CDNs should be categorized as distinct "Global" components on your dashboard. If a global dependency fails, the status change reflects across the entire page. If a regional API or database cluster fails, the impact remains isolated to that specific geographic group. This hierarchy helps users quickly distinguish between a foundational platform issue and a localized service disruption that might not affect them.
Can I automate regional status updates via API?
You can use the StatusPulse API to trigger state changes automatically based on your internal monitoring alerts. Automating a status page for multi-region services ensures that your public reporting matches your actual infrastructure health in real time. This removes the delay and potential for human error associated with manual updates during a crisis. It allows your SRE team to focus on remediation while the status page updates itself.
Why should I offer regional subscriptions for status updates?
Regional subscriptions prevent notification fatigue by sending alerts only to users who are actually affected by a specific incident. A customer in Berlin doesn't want an SMS at 3:00 AM about a latency spike in an Oregon data center. Targeted alerts maintain high engagement and trust. Every notification a user receives is relevant to their specific workflow, which reduces the likelihood of them unsubscribing from your updates.
How does data residency affect my status page hosting choice?
Data residency laws like the GDPR influence where your status page data should be stored. Selecting a provider that offers a choice between EU and US hosting ensures that your incident logs and subscriber lists remain within the required geographic boundaries. This alignment between your production environment and your communication tools simplifies your compliance posture. It also proves to your users that you take their regional privacy requirements seriously.
What is the difference between regional uptime and global availability?
Regional uptime measures the health of a specific cluster, while global availability is often a misleading mathematical average. A platform might report 99.9% global uptime even if one region is completely dark for several hours. Regional reporting provides an honest look at the actual user experience in specific locations. It is the only metric that matters to a customer who is unable to access your service from their local office.
How can AI help with multi-region incident management?
AI assistants help your team by summarizing complex technical logs into human-readable incident drafts during an outage. This speeds up the communication process by generating factual, hype-free updates that engineers can quickly approve and publish. It acts as a technical peer that handles the repetitive task of drafting notices. This allows your SREs to focus on fixing the root cause while the AI manages the first draft of transparency.


