

Silence during an outage isn't a strategy. It's a liability that signals technical incompetence to your most sophisticated users. Most SREs and DevOps leads know that a generic "we are investigating" message does nothing to stop support tickets or calm a frustrated CTO. By studying transparent incident communication examples, you can see that technical honesty builds more trust than vague corporate platitudes. It's a difficult balance to strike when you're worried that too much detail might damage your brand reputation.
This article shows you how to transform moments of failure into trust-building opportunities. You'll learn to draft honest, effective updates that prioritize technical depth over marketing polish. We'll break down real-world templates, explore how to explain architectural failures without scaring customers, and provide a framework for building a standardized library of incident updates. By the end, you'll have the tools to reduce customer churn and speed up your communication cycles when systems fail.
Key Takeaways
- Learn why technical transparency requires sharing the "what," "why," and "when" of an outage without marketing spin or vague corporate language.
- Analyze transparent incident communication examples that demonstrate how to admit configuration errors or explain upstream dependencies with integrity.
- Master the anatomy of a professional status update by using specific, descriptive titles and clear state transitions from "Investigating" to "Resolved."
- Establish a single source of truth using public status pages and in-app notifications to reduce support ticket volume during active incidents.
- Streamline your response cycle by leveraging AI to draft technical updates based on real-time monitoring data like latency and error rates.
What is Transparent Incident Communication?
Transparency in technical operations is the act of sharing the "what," the "why," and the "when" of a system failure without marketing spin. It moves the conversation away from vague "service interruptions" toward specific, actionable data points. For instance, instead of saying "We are aware of issues," a transparent team states they are "investigating 400ms latency on the API gateway." This level of detail validates the user's experience. It confirms that you see exactly what they see. Transparency is a technical trust-building mechanism that converts system failure into a demonstration of operational maturity.
True transparency requires a willingness to acknowledge technical debt or human error. If a botched database migration or an unoptimized query caused the downtime, state it clearly. Users, especially developers and SREs, respect technical honesty more than corporate polish. They understand that systems are complex. They don't expect perfection, but they do expect the truth. Looking at transparent incident communication examples from high-performing teams reveals a common thread: they treat their status page as a technical log rather than a PR channel. This approach builds a foundation of integrity that survives even the most difficult outages.
The Cost of Silence
Silence is the fastest way to burn through customer trust during a crisis. When a system fails and the status page remains green, users feel gaslit. This lack of updates suggests a lack of control over your own infrastructure. It forces customers to flood your support channels to confirm the outage themselves. Proactive communication reduces this friction and keeps your support team from being overwhelmed. You can learn more about the architecture of incident communication transparency to see how structured updates prevent support ticket storms and maintain professional authority.
Transparency vs. Exposure
Some teams fear that being too open will expose security vulnerabilities or look bad to stakeholders. This is a misconception. Explaining a failure doesn't require sharing internal server names, IP addresses, or specific code snippets. You should focus on the impact on the user and the high-level component involved. The trade-off is simple. Provide enough technical context to prove you've identified the root cause, but stop short of revealing your underlying network topology. Technical precision builds authority; oversharing creates risk. By focusing on the functional failure rather than the internal architecture, you maintain security while providing the clarity your users need to plan their own workarounds.
The Anatomy of a Technical Status Update
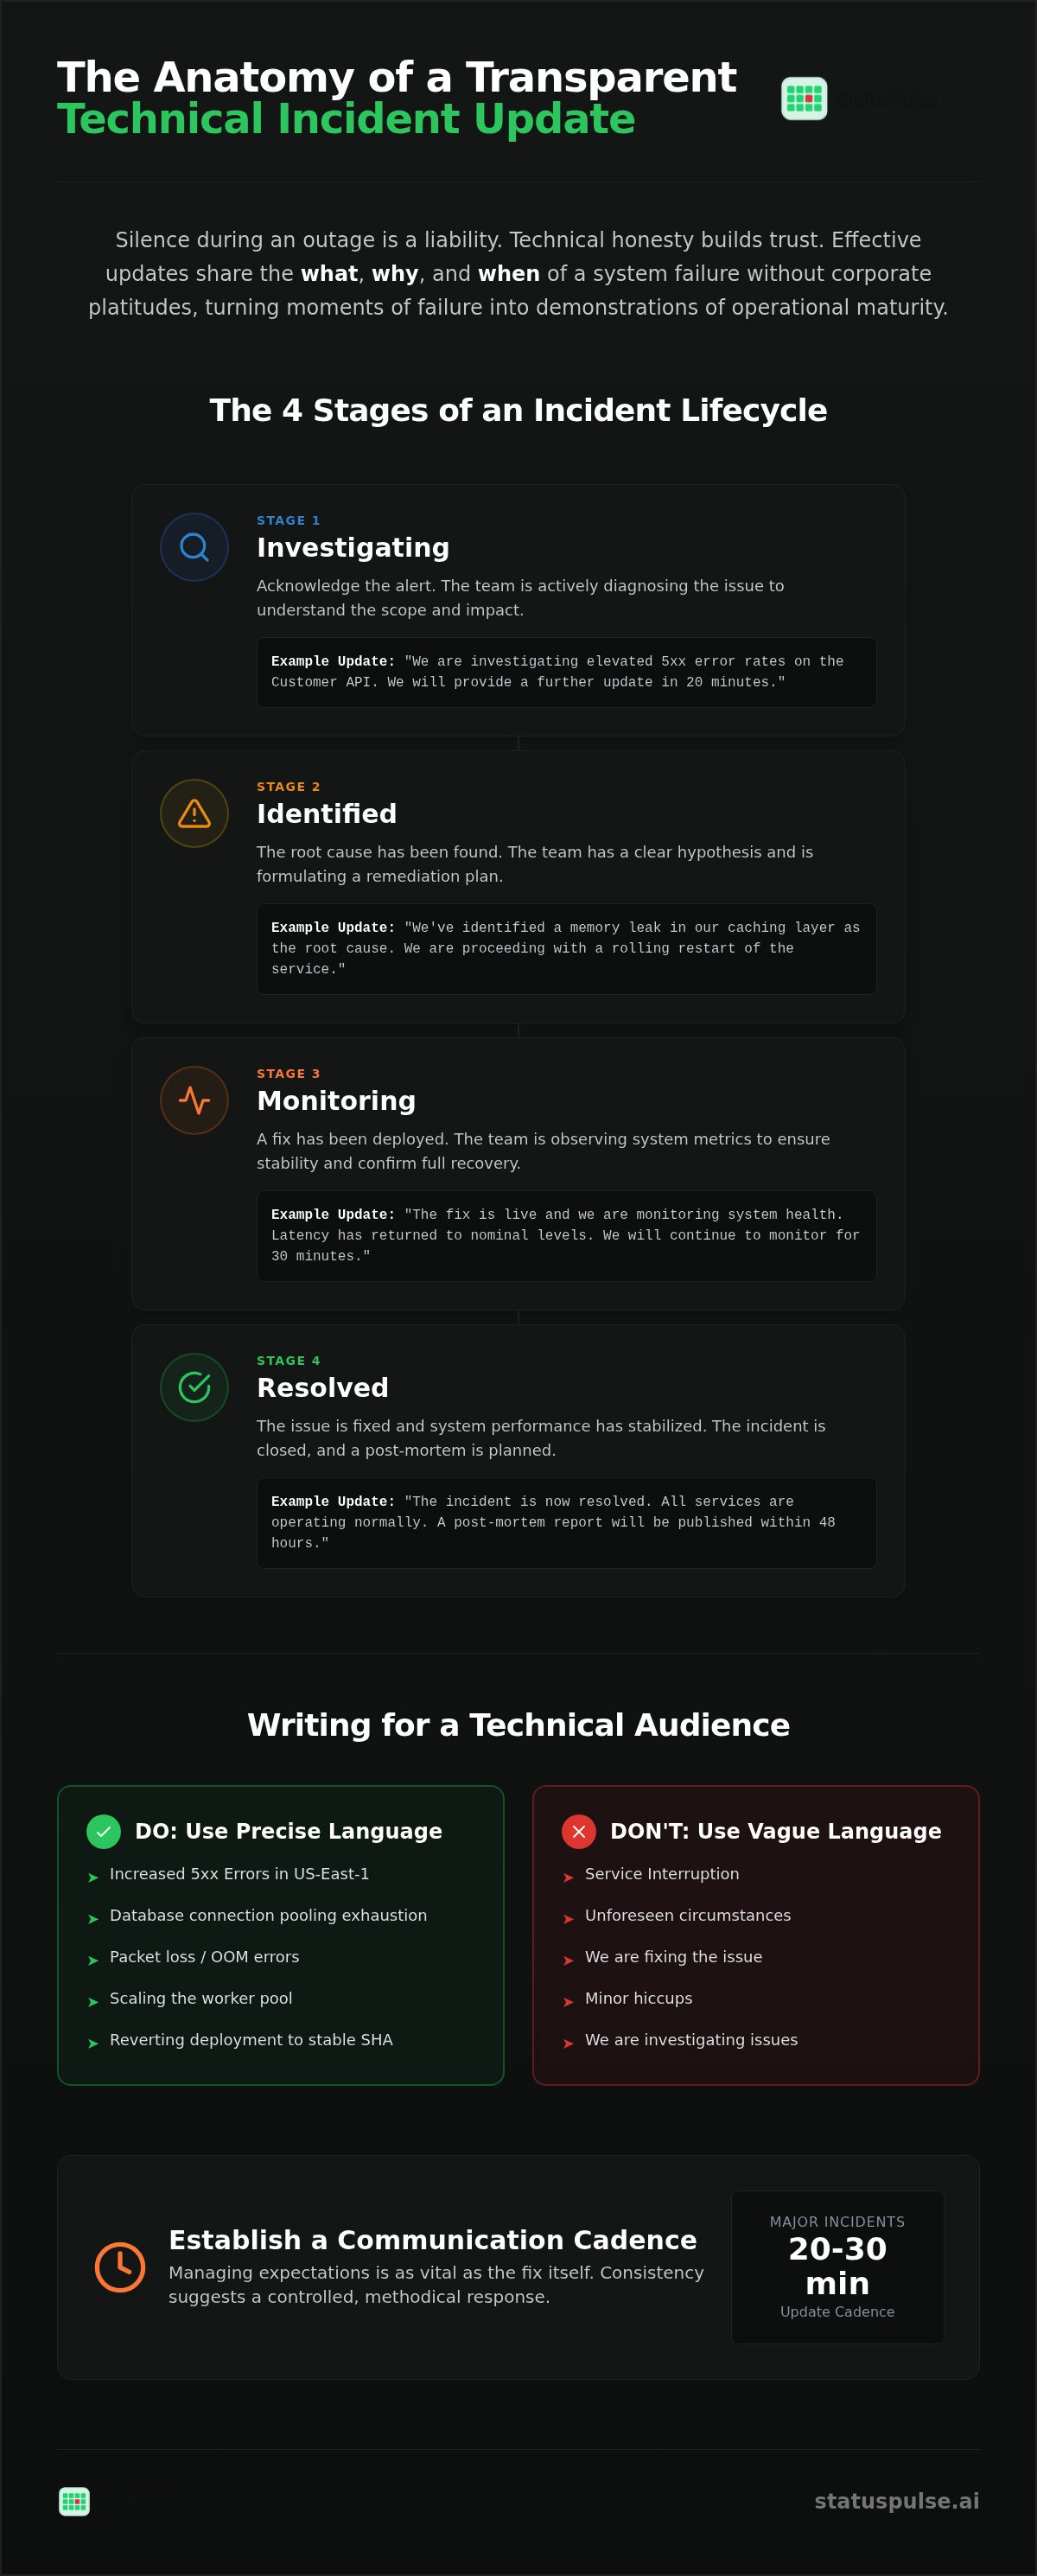
Effective status updates aren't just notifications. They're technical logs. A structured update follows a specific lifecycle: Investigating, Identified, Monitoring, and Resolved. This progression tells the reader exactly where the team is in the remediation process. Investigating means you've acknowledged the alert. Identified means you've found the root cause. Monitoring means the fix is live but you're watching the telemetry. Resolved means the metrics have stabilized and the incident is closed.
The title is your first chance to be honest. Avoid generic phrases like "Service Interruption." Use descriptive titles like "Increased 5xx Errors in US-East-1." This allows users to quickly determine if they're affected. When providing technical context, look at transparent incident communication examples from teams that describe "suspected database connection pooling exhaustion" or "BGP route flapping." This level of detail proves you're actually doing the work rather than hiding behind a PR wall.
Writing for the SRE Persona
SREs and DevOps engineers have a high "marketing fluff" detector. They don't want to hear about "unforeseen circumstances" or "minor hiccups." They want to see precise terms like "packet loss," "memory leaks," or "OOM errors." Don't just say you're "fixing the issue." Show the fix. State that you're "scaling the worker pool" or "reverting a deployment to the previous stable SHA." This technical depth builds the technical trust required to maintain a professional reputation during downtime.
The Feedback Loop
Managing expectations is as vital as the fix itself. Every update must include a "Next Update" timestamp. If the incident is major, stick to a strict 20 to 30-minute cadence. This prevents users from refreshing the page every ten seconds and reduces anxiety. Consistency suggests a controlled, methodical response. For more on maintaining this standard, see our guide on uptime monitoring for developers. If you're tired of manual updates, you can use StatusPulse to automate technical status pages and keep your stakeholders informed without the manual overhead.
4 Transparent Incident Communication Examples
Generic templates fail when they meet complex infrastructure. These transparent incident communication examples demonstrate how to speak to a technical audience without hiding behind vague language. By providing specific details, you validate the user's experience and prove that your engineering team has a firm grip on the situation.
Example: The Honest Root Cause
Compare these two approaches to a database lock. A corporate update might say "We experienced a brief disruption in service." This tells the user nothing. A technical update says "A migration script caused an exclusive lock on the 'users' table, preventing authentication." The latter is far more effective. It explains why the user is seeing a 500 error and confirms that you've identified the specific point of failure. Use the following structure for internal configuration errors:
Incident: Database Lock in Production
Status: Identified
Details: At 14:02 UTC, a schema migration triggered an unexpected table lock on the primary RDS instance.
Impact: Users are unable to login or update profile settings.
Action: We are currently killing the blocking process and rolling back the migration to the previous stable state.
This level of honesty prevents users from guessing. It shows that you value technical precision over PR optics. When you admit a mistake, you remove the mystery that fuels customer frustration.
Example: Upstream Dependency Issues
When AWS, Cloudflare, or Stripe fails, don't just point fingers. Explain how the failure affects your specific stack. Use a template that details your mitigation efforts rather than just blaming the provider. For example, "Investigating 15% packet loss in US-East-1. Our load balancer is failing to route traffic to healthy nodes in US-West-2 due to an upstream DNS issue." This informs the reader that you are actively working on a workaround. For deeper insights on managing these dependencies, consult our API Monitoring Guide.
Example: Owning Maintenance Oversights
An expired SSL certificate is an embarrassing operational failure. However, admitting it shows you've identified the specific gap in your monitoring. State clearly that "Our SSL renewal cron job failed to trigger for the API subdomain." This is better than saying "We are experiencing security-related downtime," which sounds much more alarming than a simple certificate renewal issue.
Example: Addressing Silent Failures
Gradual performance degradation is harder to communicate than a total outage. Use specific metrics to define the "silent" failure. "We are seeing p99 latency climb to 2.5s due to cache eviction pressure on our Redis cluster." This informs users that while the service is technically up, it isn't healthy. It allows them to adjust their own timeout settings or postpone intensive tasks until the metrics stabilize.
Channels and Cadence: Where to Communicate
A fragmented communication strategy increases support volume. You need a clear hierarchy of channels to manage expectations effectively. The public status page acts as the single source of truth. It's where you point all other traffic. In-app notifications are effective for reaching active users during degraded performance. Automated email and SMS should be reserved for critical state changes to avoid alert fatigue. While social media offers broad reach, it lacks the technical depth required for transparent incident communication examples that satisfy an SRE audience.
The Importance of Data Sovereignty
Reliability requires independence. Your status page shouldn't share the same fate as your application. If your primary infrastructure is hosted in AWS US-East-1, your status page should ideally reside in a different region or with a different provider entirely. For European companies, data sovereignty is a core requirement rather than a marketing afterthought. This is why StatusPulse offers a choice between EU and US hosting for public status pages. It ensures your communication remains online even during a regional cloud provider failure while maintaining strict regulatory standards. This separation of concerns is vital for maintaining a "green" status page for your status page itself.
Cadence Rules for Major Incidents
Timing defines your operational maturity. An initial update should be posted within 5 to 10 minutes of detection. This tells users you're already on the case. During an active incident, provide updates every 30 minutes. Even if you have no new technical data, a "still investigating" message prevents users from assuming you've abandoned the fix. Consistency reduces anxiety. Finally, publish a detailed post-mortem within 48 hours of resolution. This timeframe ensures the technical context is fresh and demonstrates a commitment to long-term reliability. You can launch a public status page with StatusPulse to automate these updates and maintain technical trust without the manual overhead.
Automating Honesty with StatusPulse
Manual status updates are slow. During an outage, you don't have time to craft perfect prose. StatusPulse automates the technical heavy lifting by drafting initial updates directly from monitoring data like API latency or 5xx error rates. This ensures your communication matches the raw telemetry of your infrastructure. By using these transparent incident communication examples as a baseline, the platform helps you maintain a human-in-the-loop approach where the AI assists but the engineer approves.
AI as a Drafting Assistant
AI should bridge the gap between technical metrics and user impact. StatusPulse AI analyzes the failure and suggests a technical summary that avoids corporate fluff. However, we believe in human agency. AI should never post without oversight. It serves as an assistant that requires a final human action before going live. For example, if a domain expiry checker triggers an alert, the AI can draft a specific, honest update for your review:
Incident: API Authentication Failure
Status: Investigating
Details: Our domain monitoring has identified a certificate mismatch on the auth.example.com subdomain.
Impact: New login requests are currently failing with SSL handshake errors.
Action: We are manually re-triggering the renewal process and verifying the challenge records.
This process keeps your response fast without sacrificing the technical accuracy that your users expect. It allows your team to focus on the fix while the communication remains consistent and professional.
Consolidating Your Stack
Managing separate tools for monitoring and status pages creates an unnecessary "tool tax." It leads to corporate bloat and fragmented data silos. By consolidating monitoring, status pages, and AI incident management into a single platform, you ensure zero-lag updates. Many incumbents charge per-subscriber fees, which creates a financial incentive to limit your transparency. We find this practice unethical. StatusPulse uses flat pricing so you can notify every user without worrying about your next invoice.
This model supports the transparent incident communication examples discussed earlier by removing the cost barrier to honesty. You can choose between EU or US hosting to maintain data sovereignty and ensure your status page remains independent of your primary infrastructure. Consolidating your stack reduces complexity and allows your team to maintain a meticulous, principled response to every incident. You can start a free trial with StatusPulse to build a more resilient relationship with your users through automated, principled incident management.
Mastering the Art of Operational Honesty
Trust is an operational metric. It's built through consistent, honest technical updates when systems fail. You now have the framework to move beyond vague "investigating" messages. By adopting the structure found in these transparent incident communication examples, you validate user experiences and protect your professional reputation. Technical honesty is your most effective tool for reducing churn after a major incident. It proves that your team is meticulous and principled even under pressure.
Operational transparency shouldn't be expensive or complex. StatusPulse provides a grounded alternative to corporate bloat. We offer a choice between EU and US hosting for data sovereignty and use AI to draft technical updates that save your team time. Crucially, we never charge per-subscriber fees. This ensures your communication strategy scales without a "transparency tax" that punishes you for growing. It's a straightforward approach for teams that value integrity over flashiness.
You can build a transparent status page with StatusPulse to automate your incident response today. Take control of the narrative and keep your users informed while you focus on the technical fix. You've got this.
Frequently Asked Questions
What should be included in a first incident update?
A first update must acknowledge the issue and define the scope of impact immediately. It should include a clear status (Investigating), a descriptive title like "Increased Latency in EU-West-1," and a brief note on which services are affected. Don't wait for a root cause to post. Your primary goal is to tell users you're on the case and validate their experience.
How often should you update a status page during an outage?
Aim for an update every 30 minutes for major incidents. Even if there's no technical progress, a "still investigating" message prevents user anxiety and reduces support ticket volume. For minor issues, a 60-minute cadence is often sufficient. Consistency is more important than the amount of new information provided; it proves your team is actively managing the failure.
Is it better to admit a mistake or stay vague in status updates?
Admitting a technical mistake is always better than being vague. Developers and SREs value technical honesty over corporate polish. When you share transparent incident communication examples like "a configuration error in our Nginx ingress," you prove you've identified the specific failure. Vague language like "unforeseen circumstances" suggests a lack of control over your infrastructure and damages long-term trust.
How do you communicate an incident caused by a third-party provider?
Focus on how the third-party failure affects your specific functionality. Instead of just blaming AWS or Stripe, explain that "upstream API latency is causing delays in our checkout process." Provide a link to the provider's own status page. This shows you're monitoring dependencies and actively looking for workarounds rather than just pointing fingers at external vendors.
Can AI help in writing incident reports without sounding robotic?
AI is an excellent drafting assistant for summarizing technical telemetry into readable updates. It can take raw data like "5xx error spikes" and suggest a clear impact statement. However, an engineer must always review the output before it goes live. This human-in-the-loop approach ensures the update maintains a professional, technical tone rather than sounding like a generic, unhelpful bot.
What is the difference between a public and private status page?
A public status page is accessible to everyone and acts as your brand's single source of truth. A private status page requires authentication, such as SSO, and is used for internal stakeholders or enterprise clients with specific SLAs. Most teams need a public page to reduce support volume, while private pages are reserved for granular, internal infrastructure monitoring and security details.
Why is regional hosting important for a status page?
Your status page should be independent of your primary infrastructure. If your app and status page share the same region, a regional cloud failure could take both offline. Hosting in the EU or US also supports data sovereignty requirements. This separation ensures your communication remains accessible even when your main systems are experiencing significant downtime or regional connectivity issues.


