

Your uptime dashboard shows the service as available, but customers couldn’t complete a critical API request during an incident. That gap is where SLA compliance monitoring gets difficult: a single availability signal may not show whether the service met the commitment customers rely on.
It’s not enough to collect metrics. Teams need clear rules for translating contract language into indicators, deciding which evidence counts, and recording incidents consistently. Monitoring can show what happened; it can’t interpret the contract for you.
This guide lays out a practical workflow for measuring service commitments with evidence you can explain and review. You’ll learn how to map SLA targets to service-level indicators, choose checks that reflect real user impact, and distinguish an outage from a reporting gap. We’ll also cover how to preserve incident evidence and communicate status updates clearly, so teams can assess performance against the agreed terms rather than rely on a dashboard number alone.
Key Takeaways
- SLA compliance monitoring depends on clear measurement rules, not a green dashboard alone.
- Map each commitment to an indicator, measurement window, evidence source, and review owner.
- Choose checks based on what they observe and what they can miss, from infrastructure metrics to customer journeys.
- Build a repeatable workflow to pilot coverage, validate alerts, and review evidence.
- Keep incident updates factual, then assess contractual compliance against the agreed terms.
What SLA Compliance Monitoring Measures, and What It Does Not
A service dashboard stays green during an incident, but customers can’t submit orders because a critical API endpoint is returning errors. The homepage is reachable; the customer journey is broken. That gap shows why a single uptime number may not tell you whether a service met its commitments.
SLA compliance monitoring collects evidence that can be compared with documented service commitments. It can record availability checks, response times, transaction results, and incident timelines. It can’t decide what a contract means. Teams still need to interpret its terms, exclusions, measurement periods, and reporting rules before drawing a compliance conclusion.
A Service-level agreement (SLA) documents commitments between parties. Its wording might define which service is covered, how performance is measured, and how exceptions are handled. Monitoring evidence is useful only when the measurement matches those terms.
How SLAs, SLOs, and SLIs relate
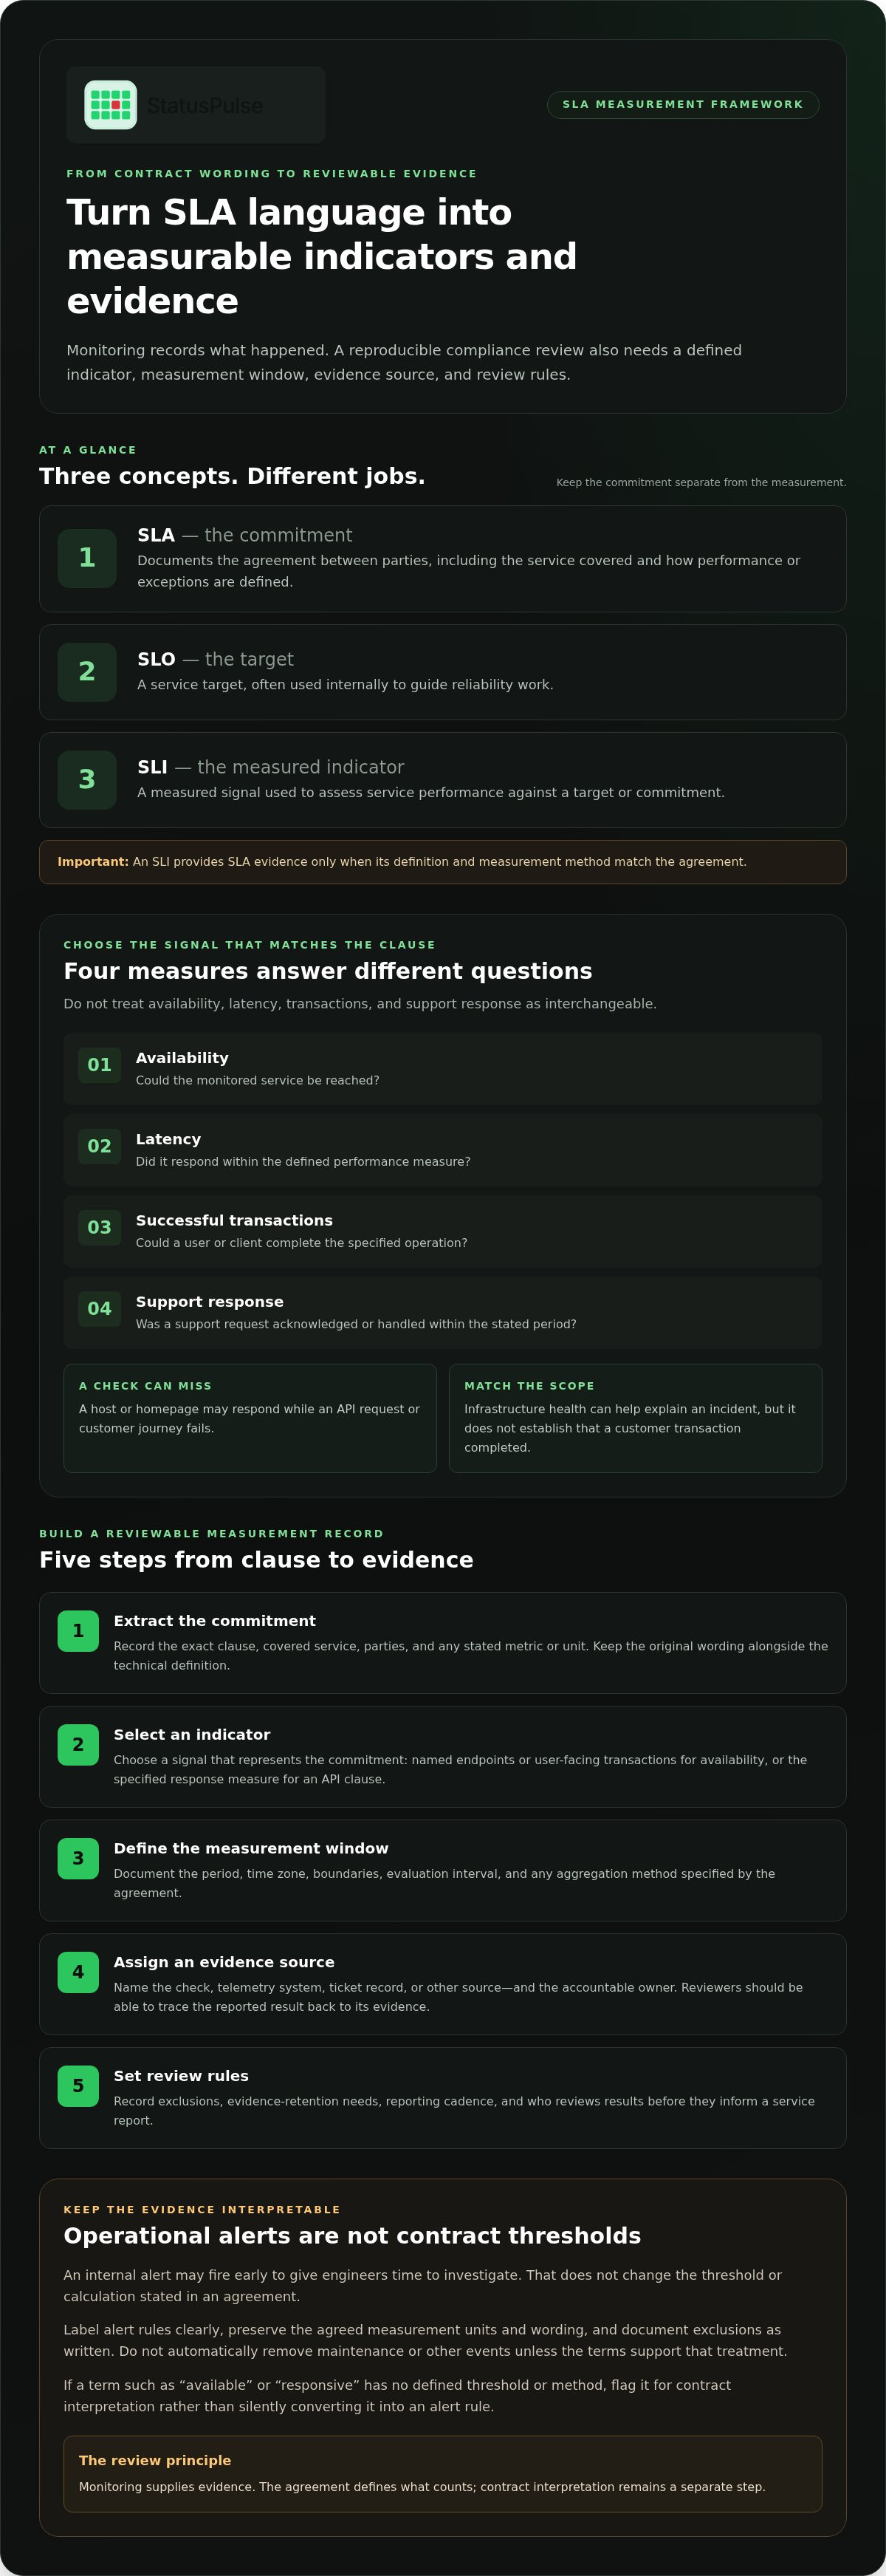
An SLA is a documented commitment between parties, not a monitoring metric. An SLO is a service target, often used internally to guide reliability work. An SLI is the measured indicator used to assess performance against a target or commitment.
The SLA states the commitment, the SLO sets a target, and the SLI measures the service. For example, a team might track successful API requests as an SLI and use that measurement to review an internal SLO. Whether it also provides evidence of an SLA commitment depends on the contract’s exact definition of availability and its measurement method.
Why uptime alone may not prove compliance
A basic uptime check can confirm that a host or page responds. It may not authenticate, submit a transaction, or verify that the response contains usable data. A reachable homepage can therefore coexist with a failed API request that blocks a core customer task.
Separate the signals before choosing checks. They answer different questions:
- Availability: Could the monitored service be reached?
- Latency: Did it respond within the defined performance measure?
- Successful transactions: Could a user or client complete a specified operation?
- Support response: Was a support request acknowledged or handled within the stated period?
These measures aren’t interchangeable. A service can be available but slow; an endpoint can respond while returning an error; and a support-response commitment concerns a different process from service availability. The contract determines which signals matter, what period to measure, and how to treat exclusions. Preserve the original wording and units rather than turning an ambiguous phrase into an assumed threshold. Monitoring supplies evidence. Contract interpretation remains a separate step.
Turn SLA Language into Measurable Indicators and Evidence
Start with the signed commitment, not the monitoring tool. For each service obligation, translate the wording into a measurement record that engineers can implement and reviewers can reproduce. Keep the commitment’s original language and units alongside the technical definition. If a term such as “responsive” or “available” has no defined threshold or method, flag it for contract interpretation instead of silently turning it into an alert rule.
- Extract the commitment. Record the exact clause, covered service, parties, and any stated metric or unit.
- Select an indicator. Choose a measured signal that represents the commitment. An availability clause may call for checks against named endpoints or user-facing transactions; an API response clause may specify success rate, latency, or another measure.
- Define the window. Document the measurement period, time zone, boundaries, evaluation interval, and any aggregation method the agreement specifies.
- Assign the source. Name the check, telemetry system, ticket record, or other source that will provide evidence, along with an accountable owner.
- Set review rules. Record exclusions, evidence-retention needs, reporting cadence, and who reviews results before they inform a service report.
Choose an indicator that reflects the commitment
Match the check to the service and the clause. If the commitment concerns a customer transaction, a host-level CPU metric can help explain an incident but can’t establish whether that transaction completed. If the commitment specifies API latency, measuring request duration may be relevant; counting successful responses alone would answer a different question. Don’t treat infrastructure health as proof that every customer-facing function works.
Define evidence before setting alerts
A measurement is only useful if teams can explain where and how they collected it. Record check locations, evaluation intervals, time boundaries, source identifiers, and retention expectations. Every SLA metric needs a named data source so reviewers can trace the reported result back to the evidence that produced it.
Keep operational alerts distinct from contractual thresholds. An internal alert may fire early to give engineers time to investigate; that doesn’t change the threshold or calculation stated in an agreement. Label each rule clearly, so an alert isn’t later mistaken for proof of a breach. Likewise, document exclusions as written, and don’t automatically remove maintenance or other events unless the agreed terms support that treatment.
When wording is disputed, pause configuration of any rule that depends on its meaning. Ask the appropriate internal contract owner to resolve the interpretation, then record the agreed measurement method and version it with the monitoring configuration. This makes future reviews more consistent and helps teams explain changes to the evidence trail.
For teams building evidence from service checks, uptime and API monitoring can provide signals to include in that documented workflow.
Compare Monitoring Approaches for SLA Compliance
Choose monitoring based on the commitment being measured, not on whichever dashboard is easiest to query. Each approach captures a different part of service behavior. SLA compliance monitoring is stronger when the evidence sources complement one another, but no single signal proves every contractual obligation.
| Approach | What it observes | What it can miss | Likely owner |
|---|---|---|---|
| Infrastructure metrics | Resource and dependency health, such as CPU, memory, or service-level telemetry | Whether an external user can reach the service or complete a workflow | Platform or SRE team |
| Endpoint checks | Whether a URL or service responds from outside the environment | Authenticated behavior, business logic, or a full user journey | Operations or service owner |
| Synthetic journeys | Whether scripted steps across a user workflow complete | Unscripted paths, real-user variation, or every backend cause | Application or QA team |
| API checks | Endpoint responses, status codes, and configured response expectations | Downstream user experience beyond the tested request | API or application team |
Infrastructure monitoring versus customer-facing checks
Infrastructure metrics help teams diagnose resource pressure and dependency failures. They’re valuable operational evidence, but healthy servers don’t prove that customers can use the service. External uptime checks test reachability from outside the environment. Synthetic transactions go further by exercising selected steps, such as signing in and submitting a request, and can expose workflow failures that a basic availability check won’t see.
API, SSL, and incident evidence in one workflow
API checks can show whether a specific endpoint returns an expected response, and can measure response characteristics when the check is configured to do so. For practical guidance on selecting endpoint checks, see this API monitoring guide. Treat the result as evidence about the tested endpoint, not every function that depends on it.
SSL certificate monitoring adds a separate signal: whether a certificate is valid. It can help teams detect certificate problems that affect access, but it doesn’t establish overall SLA compliance. Keep certificate events, endpoint results, infrastructure telemetry, and incident timestamps distinct in reports so reviewers can see what each source supports.
Broader observability may be a better fit when teams need to correlate metrics, logs, and traces across complex services or investigate causes beyond the SLA checks. Dedicated service-level management tools may suit organizations that need contract inventories, approval workflows, or formal reporting controls. The right boundary depends on whether the main gap is service visibility, evidence collection, or managing commitments across teams.
How to Build an SLA Monitoring Workflow Step by Step
A reliable workflow connects each documented commitment to a check, a response path, and a reviewable record. Start with the commitments that matter most to service delivery, then pilot the checks before using their results in reports. SLA compliance monitoring needs clear ownership at every stage, not just a dashboard full of signals.
- Inventory the commitments. List the covered services and obligations, preserving the exact wording, units, measurement periods, and stated exceptions. Flag unclear terms for internal interpretation rather than encoding a guess into monitoring.
- Prioritize the service paths. Identify business-critical endpoints and dependencies tied to explicit commitments. Map each commitment to the check that can observe it, and record where that check cannot represent the full service.
- Assign owners. Name an owner for each indicator, alert path, and evidence review. Make clear who acknowledges an alert, investigates the failure, communicates with affected users, and records the incident.
- Pilot and test. Run checks against known-good behavior and planned failure conditions in a controlled environment. Confirm that expected responses pass and that relevant failures are detected before relying on the resulting reports.
- Review and refine. Compare collected results with authoritative application logs or other suitable evidence. Document false positives, missed incidents, dependencies, exclusions, and any limits that affect interpretation.
Configure checks and escalation paths
Begin with the committed service path, not every available metric. Set alert conditions to distinguish a transient failed request from sustained impact, using operational thresholds that support investigation without misrepresenting contractual criteria. Specify the escalation route and responsibilities: who acknowledges, investigates, communicates, and preserves evidence. Check design choices, including external reachability, are covered in this uptime monitoring guide.
Validate the measurement and review the record
A passing test confirms only the behavior it exercised. Compare check output with application logs or another authoritative source, then review each relevant incident for false positives, missed failures, and dependency issues. Keep a record of the check version, time boundaries, evidence source, and limitations so a later reviewer can reconstruct how the result was produced.
Use each pilot to improve coverage before expanding it. If a dependency failure causes a customer-facing check to fail, record both the observed symptom and the dependency evidence; don’t assume the check identifies root cause. Revisit ownership and escalation paths when services or commitments change, and retain a clear distinction between monitoring results and contractual conclusions.
To put these checks into practice, explore uptime and API monitoring alongside the evidence review process your team already uses.
Use Monitoring and Status Updates to Make SLA Reviews Actionable
A useful service review needs more than a final uptime figure. It needs a record that connects observed signals to the incident timeline, customer impact, and response. This is how SLA compliance monitoring supports a consistent review: it gives teams evidence to examine, while leaving contractual conclusions to the people responsible for interpreting the agreement.
Create a reviewable incident record
Capture key facts as the incident unfolds, not from memory after it’s resolved. Keep timestamps consistent and distinguish automated detections from human observations. A clear update flow helps teams communicate verified information without presenting an early hypothesis as a confirmed cause. This incident communication architecture guide explores how updates can fit into that flow.
- Detection: When the check first observed an issue and which signal triggered it.
- Scope: The affected service, endpoint, or customer-facing function.
- Observed behavior: The response, error, or degradation recorded by the check.
- Response milestones: When the team acknowledged the incident, began investigation, and shared updates.
- Resolution: When service behavior returned to the expected state, according to the monitored signal.
Keep customer-facing updates aligned with verified facts. State what’s affected, what users may experience, and when the next update will be provided if that timing is known. A public status page gives customers one place to follow impact and progress, while internal notes can preserve technical detail that doesn’t belong in a public update.
Separate these updates from the compliance assessment. “The API returned errors during this interval” describes observed behavior. “The service breached its SLA” is a conclusion that depends on the contract’s definitions, measurement rules, and exclusions. A consistent review compares the record with those terms rather than turning an incident label into a verdict.
Where StatusPulse fits, and where it does not
StatusPulse brings uptime, API, and SSL certificate monitoring together as evidence sources for technical teams. Its public status pages support customer updates, and AI-assisted tools can help draft those updates or summarize incident impact. Teams should review AI-generated content against the incident record before publishing it.
These tools support detection, evidence gathering, and communication. They don’t interpret contract wording, decide whether an exclusion applies, or make the final compliance assessment. Keep those responsibilities with the team reviewing the agreement and the incident evidence.
If you’re bringing monitoring and customer updates into one incident workflow, explore StatusPulse monitoring and status pages.
Make the Next Review Easier to Trust
Use your next service review to find one gap between a written commitment and the evidence your team can produce. Assign an owner, clarify the measurement rule, and record what the current checks can and can’t show. That small, specific improvement gives SLA compliance monitoring a firmer foundation without pretending a dashboard can interpret a contract.
The right tooling should support the workflow you’ve defined, not dictate what the agreement means. If data location matters to your operating model, StatusPulse offers a choice of EU or US hosting. Your team remains responsible for deciding which location fits its requirements and for assessing compliance obligations.
When you’re ready to connect service signals with customer-facing updates, explore StatusPulse monitoring and status pages. Start with the commitments that matter most, make the evidence traceable, and improve the process one review at a time.
Frequently Asked Questions
What is SLA compliance monitoring?
SLA compliance monitoring is a structured way to assess whether recorded service performance aligns with agreed obligations. Make the process auditable by keeping a versioned mapping from each commitment to its check, data source, and review owner. If an agreement changes, retain the old mapping with the reporting period it governed. That gives reviewers a clear trail instead of silently applying today’s rules to past results.
How do you monitor an SLA?
Turn each obligation into an owned monitoring record. For example, a commitment covering a customer login path should identify the test account, required steps, expected result, and team responsible for maintaining the test. Add a runbook reference for investigating failures and define where evidence is stored. Review the record after application changes, so the check doesn’t keep passing while testing a path customers no longer use.
Is uptime monitoring enough to verify SLA compliance?
It depends on the obligation under review. If the commitment covers a specific workflow, validate the complete path, including relevant authentication and response content, rather than relying on a server-level signal. For a service with multiple regions or dependencies, note which paths the check exercises and which it doesn’t. That coverage statement helps reviewers avoid drawing conclusions beyond the observations the monitoring setup can support.
What is the difference between an SLA and an SLO?
An SLA records obligations agreed between parties, while an SLO is a target used to steer service operations. A practical safeguard is to label internal objectives separately in dashboards and incident reviews. For instance, an engineering team may choose an internal warning point that prompts investigation before a contractual boundary is reached. Keep that operational trigger distinct from the agreement’s stated terms and any customer-facing report.
How often should SLA monitoring checks run?
There’s no interval that suits every service. During a pilot, compare the check schedule with the kinds of failures the commitment is meant to capture. A short outage occurring between checks may go undetected, while very frequent checks can create excess alerts or load. Record the sampling interval and its known limitations, then adjust it if incident reviews show that the evidence misses relevant behavior.
Can a status page prove that an SLA was met?
A status page is useful for tracking what the team communicated and when, but it shouldn’t be treated as the sole source for a service assessment. Preserve the underlying event data and internal notes that support each update. For example, if an update says a component recovered, retain the observation used to confirm recovery. This lets reviewers distinguish the public communication timeline from the evidence used in their assessment.
Which tools are needed for SLA compliance monitoring?
Choose tools by the evidence and operational gaps you need to address. A small service may need external checks and a controlled incident log; a distributed system may also require telemetry that traces failures across dependencies. Before adopting another dashboard, test whether it can export or preserve records in a form your review process can use. Dedicated observability or service-level management systems may fit more complex investigation or agreement-management needs.


