

A green uptime check can hide a broken checkout. Your server may accept connections and serve its homepage while a POST request fails validation, saves incorrect data, or returns success before the intended action is complete. HTTP POST endpoint monitoring should test the user outcome, not just whether the endpoint responds.
The challenge is making each check safe to repeat. Synthetic requests can create records, send notifications, or trigger duplicate work. Use controlled data, plan for cleanup, and define assertions for both the response and its effects. An HTTP 200 response alone doesn’t prove the workflow worked.
This guide explains how to design a safe POST check, choose assertions and alerts that help pinpoint failures, and compare a custom script with managed HTTP or API monitoring. You’ll see where each approach fits, so you can monitor a critical workflow without adding avoidable noise or side effects.
Key Takeaways
- HTTP POST endpoint monitoring should verify the expected application outcome, not just a successful response code.
- Use a dedicated test record or controlled payload, and plan how to prevent repeated checks from triggering real-world actions.
- Choose between a custom script, synthetic checks, and broader API monitoring based on workflow depth and who will maintain the checks.
- Define separate assertions for status, response content, latency, and consecutive failures so alerts point to actionable problems.
- Connect endpoint alerts to clear ownership and incident communication, including a public status page when a team has validated an incident.
Why HTTP POST Endpoint Monitoring Catches Failures Uptime Checks Miss
Your service’s health page loads, but customers can’t submit a form. The homepage check stays green because it tests a different route with a different request method. Meanwhile, the POST handler may reject valid input, time out while saving data, or return a response before the intended operation is complete.
HTTP POST endpoint monitoring repeatedly sends a controlled request to an endpoint and checks both its HTTP response and the application behavior that response is meant to represent. That distinction matters because the HTTP POST method is commonly used to submit data or initiate processing, not simply retrieve a page. A valid response can still leave the user’s intended action incomplete.
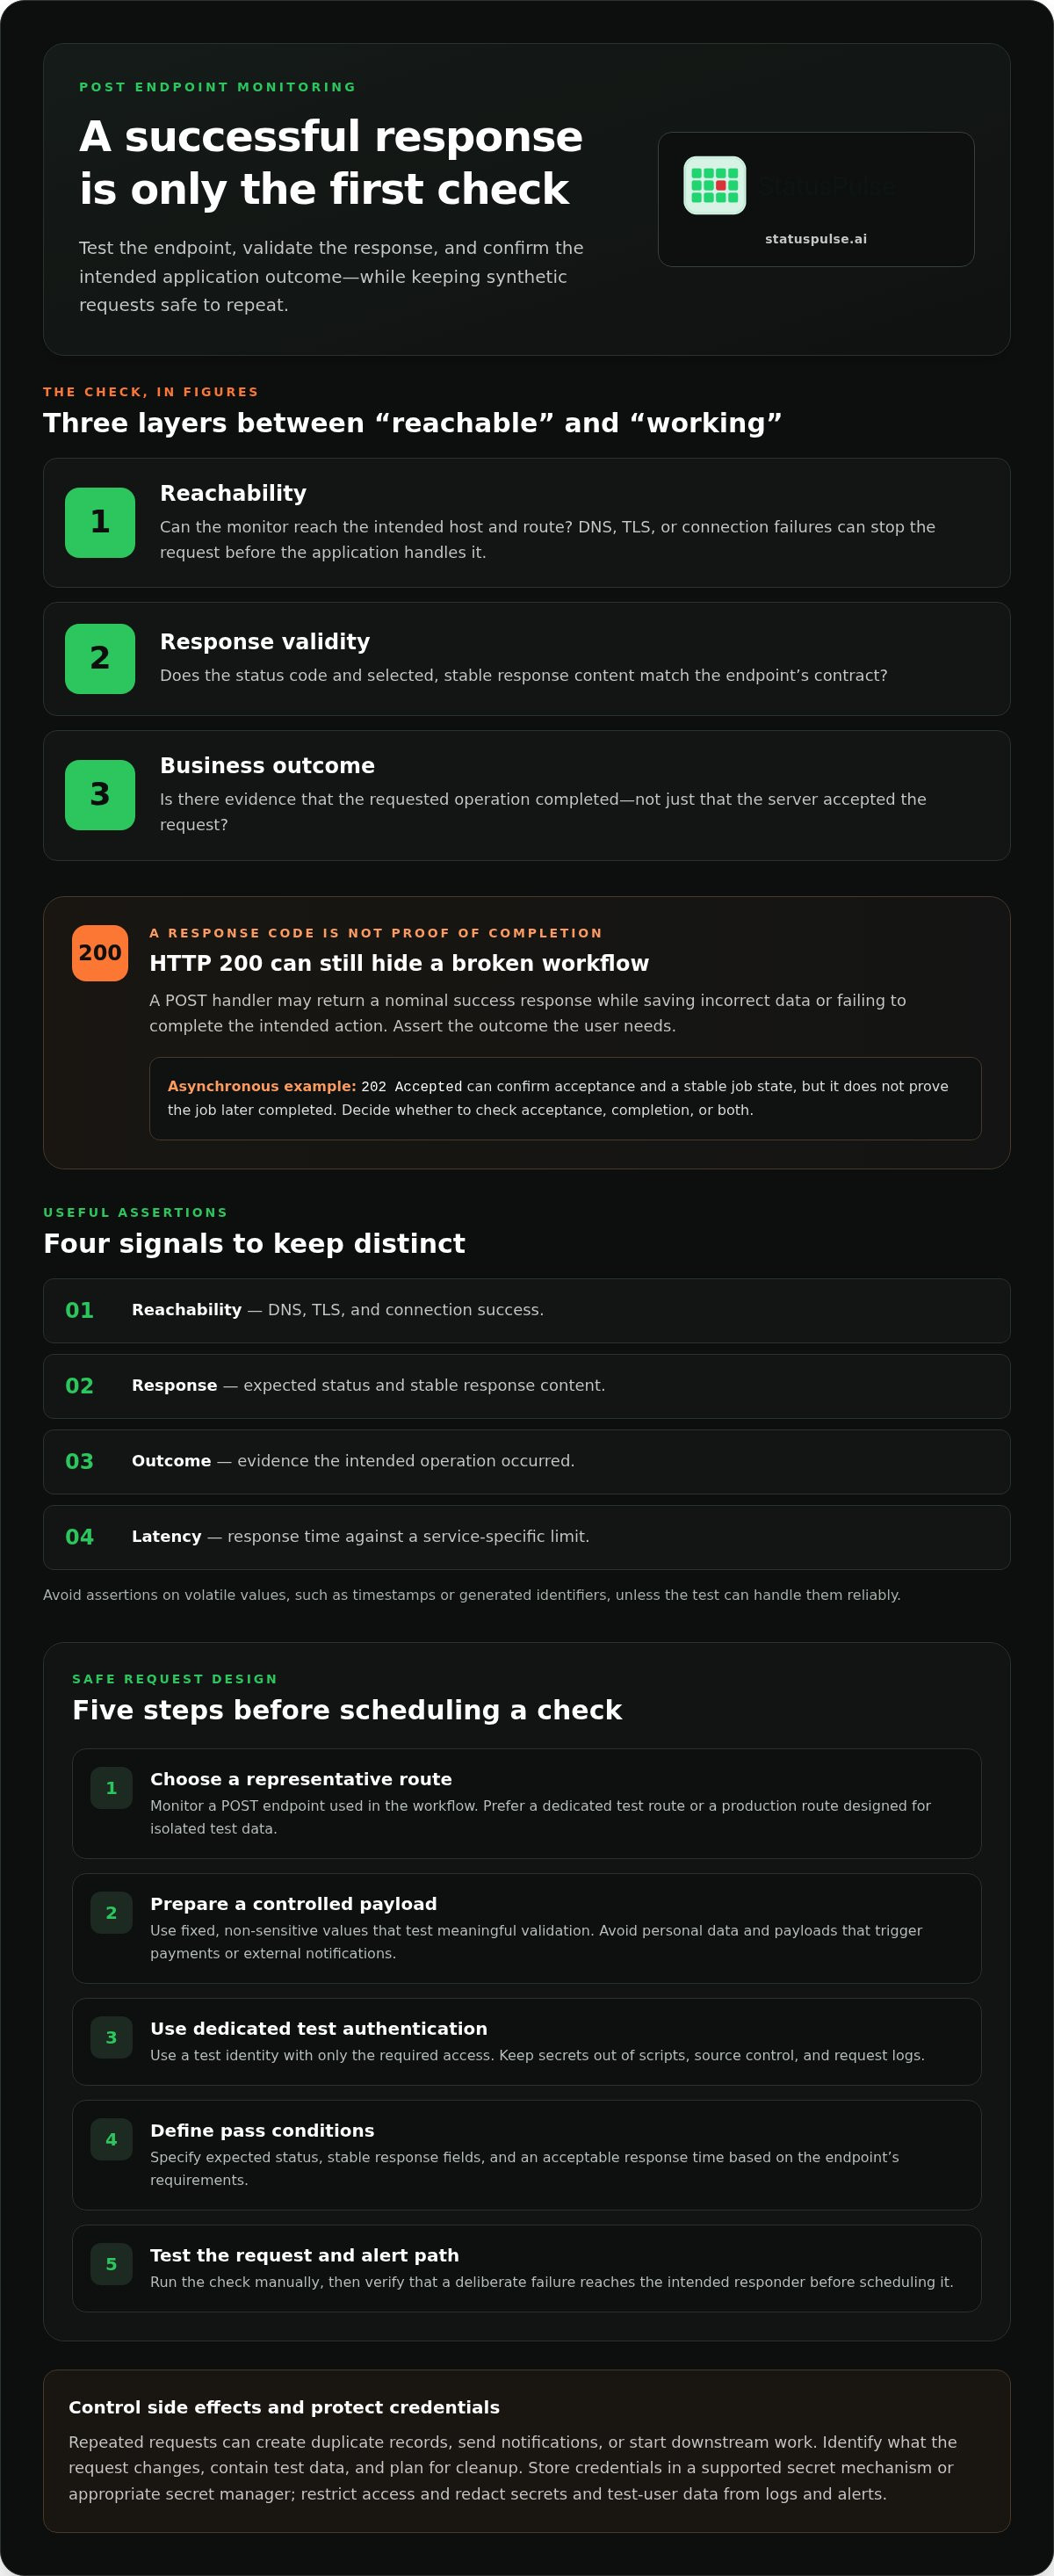
Evaluate a check at three layers: can the monitor reach the service, does the endpoint return an acceptable HTTP response, and did the application complete the expected operation? Passing at one layer doesn’t prove success at the next.
What a POST endpoint check should prove
Start with the endpoint’s contract: the request it accepts and the observable result that counts as success. Check the expected status code, inspect a stable response field or safe content condition where appropriate, and measure response time against a threshold based on the service’s requirements.
- Reachability: The request reaches the intended host and route.
- Response validity: The status and selected response content match the endpoint’s contract.
- Business outcome: The response provides evidence that the requested operation completed, not merely that the server accepted the request.
- Latency: The endpoint responds within a service-specific limit based on its expected behavior and user needs.
For example, a submission endpoint might return 202 Accepted with a stable job state. That can be correct if the service processes the request asynchronously, but it doesn’t prove that the job later completed. Decide whether the check needs to validate acceptance, completion, or both. Avoid assertions on volatile values such as timestamps or generated identifiers unless the test can handle them reliably.
Which failures basic uptime checks can miss
A basic check might request GET / and confirm that the homepage returns 200. That says little about POST /api/orders, which could have a broken database dependency, invalid input handling, or a regression in its business logic. HTTP POST endpoint monitoring targets the route and behavior that a general page check leaves untested.
- DNS failure: The hostname can’t be resolved.
- TLS or connection failure: Name resolution may work, but the secure connection can fail or time out.
- Server failure: The endpoint returns an error such as a server-side status code.
- Application failure: The endpoint returns a nominal success response, but the expected field, state, or operation is wrong.
Keep these signals distinct in monitoring results. A DNS or connection issue points to reachability; a failed application assertion points to endpoint behavior. That separation gives responders a clearer starting point than a single green or red “site up” indicator.
How to Design a Safe, Useful HTTP POST Monitoring Request
A scheduled check is still a real request to your application. Before enabling HTTP POST endpoint monitoring, identify what the request can create, change, or trigger. Then design a test that exercises the route without involving customer data or real downstream actions.
Synthetic POST checks need explicit side-effect controls. A predictable payload isn’t enough if each run creates a record, sends an email, or starts a payment workflow. Build the test around the behavior you need to verify and the consequences you can safely contain.
Build the request around a controlled test case
Define the check before scheduling it:
- Choose a representative route. Select a POST endpoint used in the workflow you need to monitor. Prefer a dedicated test route or a production route designed to accept isolated test data.
- Prepare a controlled payload. Use fixed, non-sensitive values that exercise meaningful validation without representing a real customer. Avoid personal data and payloads that can trigger payments or external notifications.
- Set up test authentication. If the route requires a login or API credential, use a dedicated test identity with only the access needed for the check. Don’t put secrets directly in scripts, source control, or request logs.
- Define pass conditions. Specify the expected status, stable response fields, and acceptable response time based on the endpoint’s requirements. IBM’s overview of API Monitoring also describes performance and availability as useful parts of API oversight.
- Run the check manually, then verify alert delivery. Confirm the request behaves as expected and that a deliberate failure reaches the intended responder before scheduling it.
Store credentials in the monitoring system’s supported secret mechanism or an appropriate secret manager. Restrict access, avoid printing authorization headers or sensitive response bodies, and rotate credentials according to your team’s policy. Check that logs and alert payloads redact values that could expose secrets or test-user data.
Prevent repeated checks from changing real state
Repeated requests can create duplicates even when each request is valid. Use an idempotency key only if the application supports it and defines how repeated keys are handled. Otherwise, isolate test records, arrange safe cleanup, or use a dedicated health workflow that cannot invoke customer-facing actions.
- Document the records, state changes, queues, and integrations each run touches.
- Use a unique test marker so generated data can be identified and cleaned up safely.
- Confirm that cleanup won’t remove real records or hide an application failure.
- Include the endpoint and test identity in alert context, but exclude secrets and sensitive payload values.
Monitoring alerts are more useful when responders can distinguish a failed test from a customer incident. Define that context in your uptime monitoring workflow, including who owns the route and what evidence the check provides. Keep the request small, repeatable, and safe by design.
Compare Scripts, Synthetic Checks, and Broader API Monitoring
The right approach depends on how much of the workflow you need to verify and who will maintain the check. A script may be enough for one stable endpoint. A managed synthetic check or broader monitoring platform can suit teams that need centralized results, recurring validation, or a connection to incident response.
| Approach | Setup | Maintenance | Workflow depth | Diagnostics | Operational ownership |
|---|---|---|---|---|---|
| Custom script | Build the request, assertions, schedule, and alert path. | Update code and supporting processes as the endpoint changes. | Flexible, within the scope of what you build. | Depends on your logging and reporting. | A code owner maintains the full check. |
| Managed synthetic check | Configure a recurring request and its pass conditions in a monitoring service. | Keep the request and assertions aligned with the endpoint contract. | Fits a defined request; multi-step coverage depends on the tool. | Results are available in the monitoring service; detail varies. | Assign an owner for the check and its alerts. |
| Broader API monitoring | Add endpoint checks to a wider monitoring workflow. | Maintain requests, assertions, and ownership across services. | Places endpoint checks alongside other service signals. | Scope and context vary by platform. | Coordinate across API and incident-response teams. |
When a custom script is the right fit
A script works well when the request is simple, the expected response is stable, and your team already has a reliable scheduler and alerting path. It gives you control over request construction and assertions, and fits naturally into existing code review and deployment practices.
That control comes with ongoing work. The owner must maintain scheduling, secret storage and rotation, timeouts and retries, useful logs, and alert delivery. Bespoke checks can become fragile when response schemas, authentication, or business rules change without corresponding test updates.
When managed endpoint monitoring fits better
A managed synthetic check suits recurring external validation of a defined request without requiring your team to build its own scheduler and result history. It still needs an owner to keep the check current. Centralized results can help reveal recurring failures, though diagnostic detail depends on the service.
API monitoring suits teams focused on endpoint availability and behavior. A broader platform can connect monitoring with incident communication, reducing the need to switch between tools during response. API monitoring and availability tracking can sit alongside that wider workflow.
Set Up POST Endpoint Monitoring, Assertions, and Alerts
Build the check in stages. Write down the endpoint contract, configure the request, define independent pass conditions, and test the alert route. This keeps a failed application assertion distinct from a DNS, TLS, or connection problem. A general website availability monitoring workflow can cover reachability, while the POST check evaluates what happens at the application layer.
- Define the contract: Record the method, route, required headers, safe payload, expected response, and the operation the endpoint should perform.
- Create the request: Use controlled test data and appropriately stored credentials. Set a timeout that reflects the endpoint’s expected behavior.
- Add separate assertions: Check status, response content, and latency as distinct conditions.
- Set failure handling: Choose a consecutive-failure rule that balances prompt detection with the risk of transient errors.
- Test the whole path: Trigger a controlled failure and confirm the result reaches the right responder with enough context to investigate.
Choose assertions that identify actionable failures
A status code confirms how the server classified a request, not whether the intended business outcome occurred. Check the expected status, then inspect a stable response field or condition that indicates the operation reached its intended state. For an asynchronous endpoint, an acceptance response may confirm receipt but not completion. Make that distinction explicit in the check.
Track latency separately from functional success. Set the threshold from the endpoint’s normal behavior and service objectives rather than applying a universal benchmark. Avoid assertions tied to generated IDs, timestamps, or wording that may change without breaking the operation. Prefer stable schema fields, documented response states, or other contract-level signals.
Keep reachability and behavior in separate results where possible. A host that cannot resolve, a TLS handshake failure, an HTTP error, and a response that fails an application assertion each point to a different investigation path. Clear labels help responders understand which layer failed.
Tune alerts to reduce noise without hiding incidents
Choose check frequency based on user impact, endpoint risk, and the safety of repeating the request. A high-impact workflow may need faster detection, but increasing frequency also increases request volume and the chance of side effects. Confirm that the test operation remains safe on the chosen schedule.
Use retries or consecutive-failure rules deliberately. A retry can filter a transient network fault, but it can also delay detection or repeat a state-changing request. Test expired authentication, timeouts, malformed responses, and failed assertions in a controlled way. Then verify alert routing and escalation, including what happens if the first destination doesn’t acknowledge the alert.
After responders validate an incident, use the evidence gathered by the check to prepare a concise customer update. State what is affected and what the team is doing, then revise the update as the situation changes.
Connect HTTP POST Monitoring to API Reliability and Incident Communication
A failed POST check is a signal, not automatically a confirmed customer incident. It becomes useful when the alert identifies the affected endpoint, the evidence behind the failure, and the person or team responsible for investigating it. Without ownership and a response path, even an accurate alert can sit unnoticed or trigger unnecessary escalation.
Turn an endpoint failure into an operational response
Define who receives the alert and who decides whether users are affected. The endpoint owner can investigate the request result, while an incident lead or designated responder checks related service signals and determines whether the failure is isolated or part of a wider outage. Record how the team handles repeat failures, unclear evidence, and recovery.
Keep the distinction clear: one failed synthetic request may reflect a transient network issue, test-data problem, or endpoint defect. Confirm impact against other evidence before declaring an incident. Once the team validates the issue, use monitoring results to write a concise update: what’s affected, what users may notice, and what the team is doing. Don’t publish an unverified cause or recovery estimate.
A public status page gives customers a consistent place to check for validated service updates. It should reflect the team’s current understanding, not every raw alert. Set an update owner and a review habit so published information stays accurate as the incident develops. This is the practical link between endpoint monitoring and transparent incident communication.
Choose a monitoring workflow that fits the team
A small script can suit a stable endpoint when the team is prepared to own its scheduling, secrets, diagnostics, and alert delivery. A managed synthetic check can centralize recurring request results. Broader API monitoring makes sense when the team needs endpoint checks alongside wider availability signals and a shared operational view.
Combining monitoring with status communication can reduce the number of separate tools responders use, though a single platform won’t remove the need for clear ownership, safe test design, and sound incident procedures. StatusPulse brings API monitoring, public status pages, and AI-assisted incident management into one platform. Its AI assists with incident work, while people retain responsibility for reviewing and writing updates.
Pricing is flat and transparent, without per-subscriber fees. Teams can choose EU or US hosting to match their operational and data-location needs. Consider these factors alongside check design, diagnostic depth, and incident workflow when choosing a monitoring approach.
If you’re aligning endpoint checks with incident response, explore StatusPulse’s monitoring and incident communication platform.
Make Your Next Check a Maintained Part of the Service
A monitoring check is useful only while it reflects the workflow customers rely on. Treat it like production code: assign an owner, review it when the endpoint contract changes, and remove it when the workflow no longer exists. Regular maintenance helps prevent a stale check from creating false alarms or giving the team confidence in behavior it no longer tests.
For your next step, choose one critical POST workflow and document what the check proves, what it deliberately avoids triggering, and who acts on a failure. Then include the check in the service’s operational review. HTTP POST endpoint monitoring works best as a maintained reliability signal, not a request configured once and forgotten.
Connect endpoint monitoring to incident communication with StatusPulse’s API monitoring and incident communication. Build the check around the real user outcome, assign clear ownership, and improve it as the service evolves.
Frequently Asked Questions
Can a POST endpoint be monitored without creating duplicate records?
Yes. Design the test data so each run can be recognized and managed independently. For example, add a fixed monitor marker plus a run identifier, then have a cleanup task remove only records matching that marker and an agreed age limit. Confirm cleanup runs successfully and doesn’t mask a failed submission. If the endpoint can’t support isolated test records or safe cleanup, use a dedicated test workflow instead.
Is an HTTP 200 response enough to prove a POST request succeeded?
No. For a stronger check, verify the result through a separate, read-only path when the application provides one. If a request updates a preference, for example, inspect that preference afterward rather than relying only on the submission response. Keep the verification query independent from the POST so it doesn’t repeat the state change, and allow for any documented delay before the updated state becomes visible.
How should I monitor an authenticated POST endpoint?
First identify whether the check uses a long-lived credential, a short-lived token, or a separate token-acquisition flow. If it obtains tokens dynamically, monitor that dependency separately so a failed token request isn’t mistaken for a defect in the POST route. Give the check identity a clear owner and review its permissions when the endpoint’s access model changes. Avoid using an employee’s personal account for unattended monitoring.
Can a monitoring check safely submit a web form?
Yes, if the check accounts for the form’s full submission path and its side effects. A browser-driven check may need a valid session, CSRF token, and expected redirect handling; a direct request may bypass those browser behaviors. Confirm whether submission triggers confirmation emails, anti-spam systems, or other external actions. Use a dedicated destination for notifications, and verify that the test submission appears as expected without reaching real customers.
What should I do if a POST endpoint returns HTTP 202?
Check whether the response includes an operation reference or another documented way to inspect processing status. If it does, have the monitor query that resource rather than resending the POST. Bound follow-up checks with a deadline and a reasonable polling interval so a delayed job doesn’t create an excessive stream of requests. Record whether the operation was accepted and whether it later reached its expected terminal state.
Should POST endpoint monitoring run against production or a test environment?
Use an environment that matches the question the check is meant to answer. A test environment can exercise broader scenarios, while a constrained production check can catch configuration drift that staging may not reproduce. Compare relevant settings, dependencies, and deployment versions across environments; otherwise, a passing test may offer little evidence about the live route. Keep production checks narrow enough that routine runs remain predictable and auditable.
How can I tell whether a POST failure comes from authentication, validation, or an outage?
Correlate the monitor’s timestamp and request identifier with application logs, traces, and authentication-provider records. A consistent request ID makes it easier to follow one attempt across services without logging sensitive payloads. Compare a failed check with a known-good request from the same time window, and note whether the failure is isolated to one monitor location or appears across the service. This evidence helps route the investigation to the right owner.


