

A binary up or down status is a dangerous metric for a modern SRE. It misses the silent API failures and regional latency spikes that erode user trust long before a global outage triggers your pager. You've likely felt the stress of explaining a green dashboard to a frustrated team while users report 500 errors. Finding a reliable website uptime monitor in 2026 means looking past marketing fluff to evaluate check depth, data sovereignty, and communication automation.
The best website uptime monitor for 2026 provides deep API validation, EU-based data residency, and flat-rate pricing to prevent silent failures without scaling costs. Technical teams should prioritize tools that offer granular check intervals and automated, honest incident updates.
This guide compares the technical architecture and pricing models of the top tools. We examine how different providers handle data privacy under GDPR and the DSA, while identifying where specific tools might fail your infrastructure needs. The goal is simple. Zero blind spots. Automated updates. Flat pricing. You'll learn how to achieve this without the burden of per-subscriber fees or complex consumption-based billing.
Key Takeaways
- Understand why binary pings are insufficient for modern stacks and how to detect logical failures that return false 200 OK statuses.
- Identify the technical requirements for a professional website uptime monitor, including global node distribution and deep protocol support for SSL, DNS, and Cron jobs.
- Compare the technical trade-offs of popular monitoring tools to find solutions that avoid per-subscriber fees and complex consumption-based billing.
- Standardize your health check data by integrating uptime monitoring into modern observability strategies using OpenTelemetry.
- Navigate European data sovereignty requirements by selecting monitoring providers that offer dedicated EU hosting and GDPR-compliant data handling.
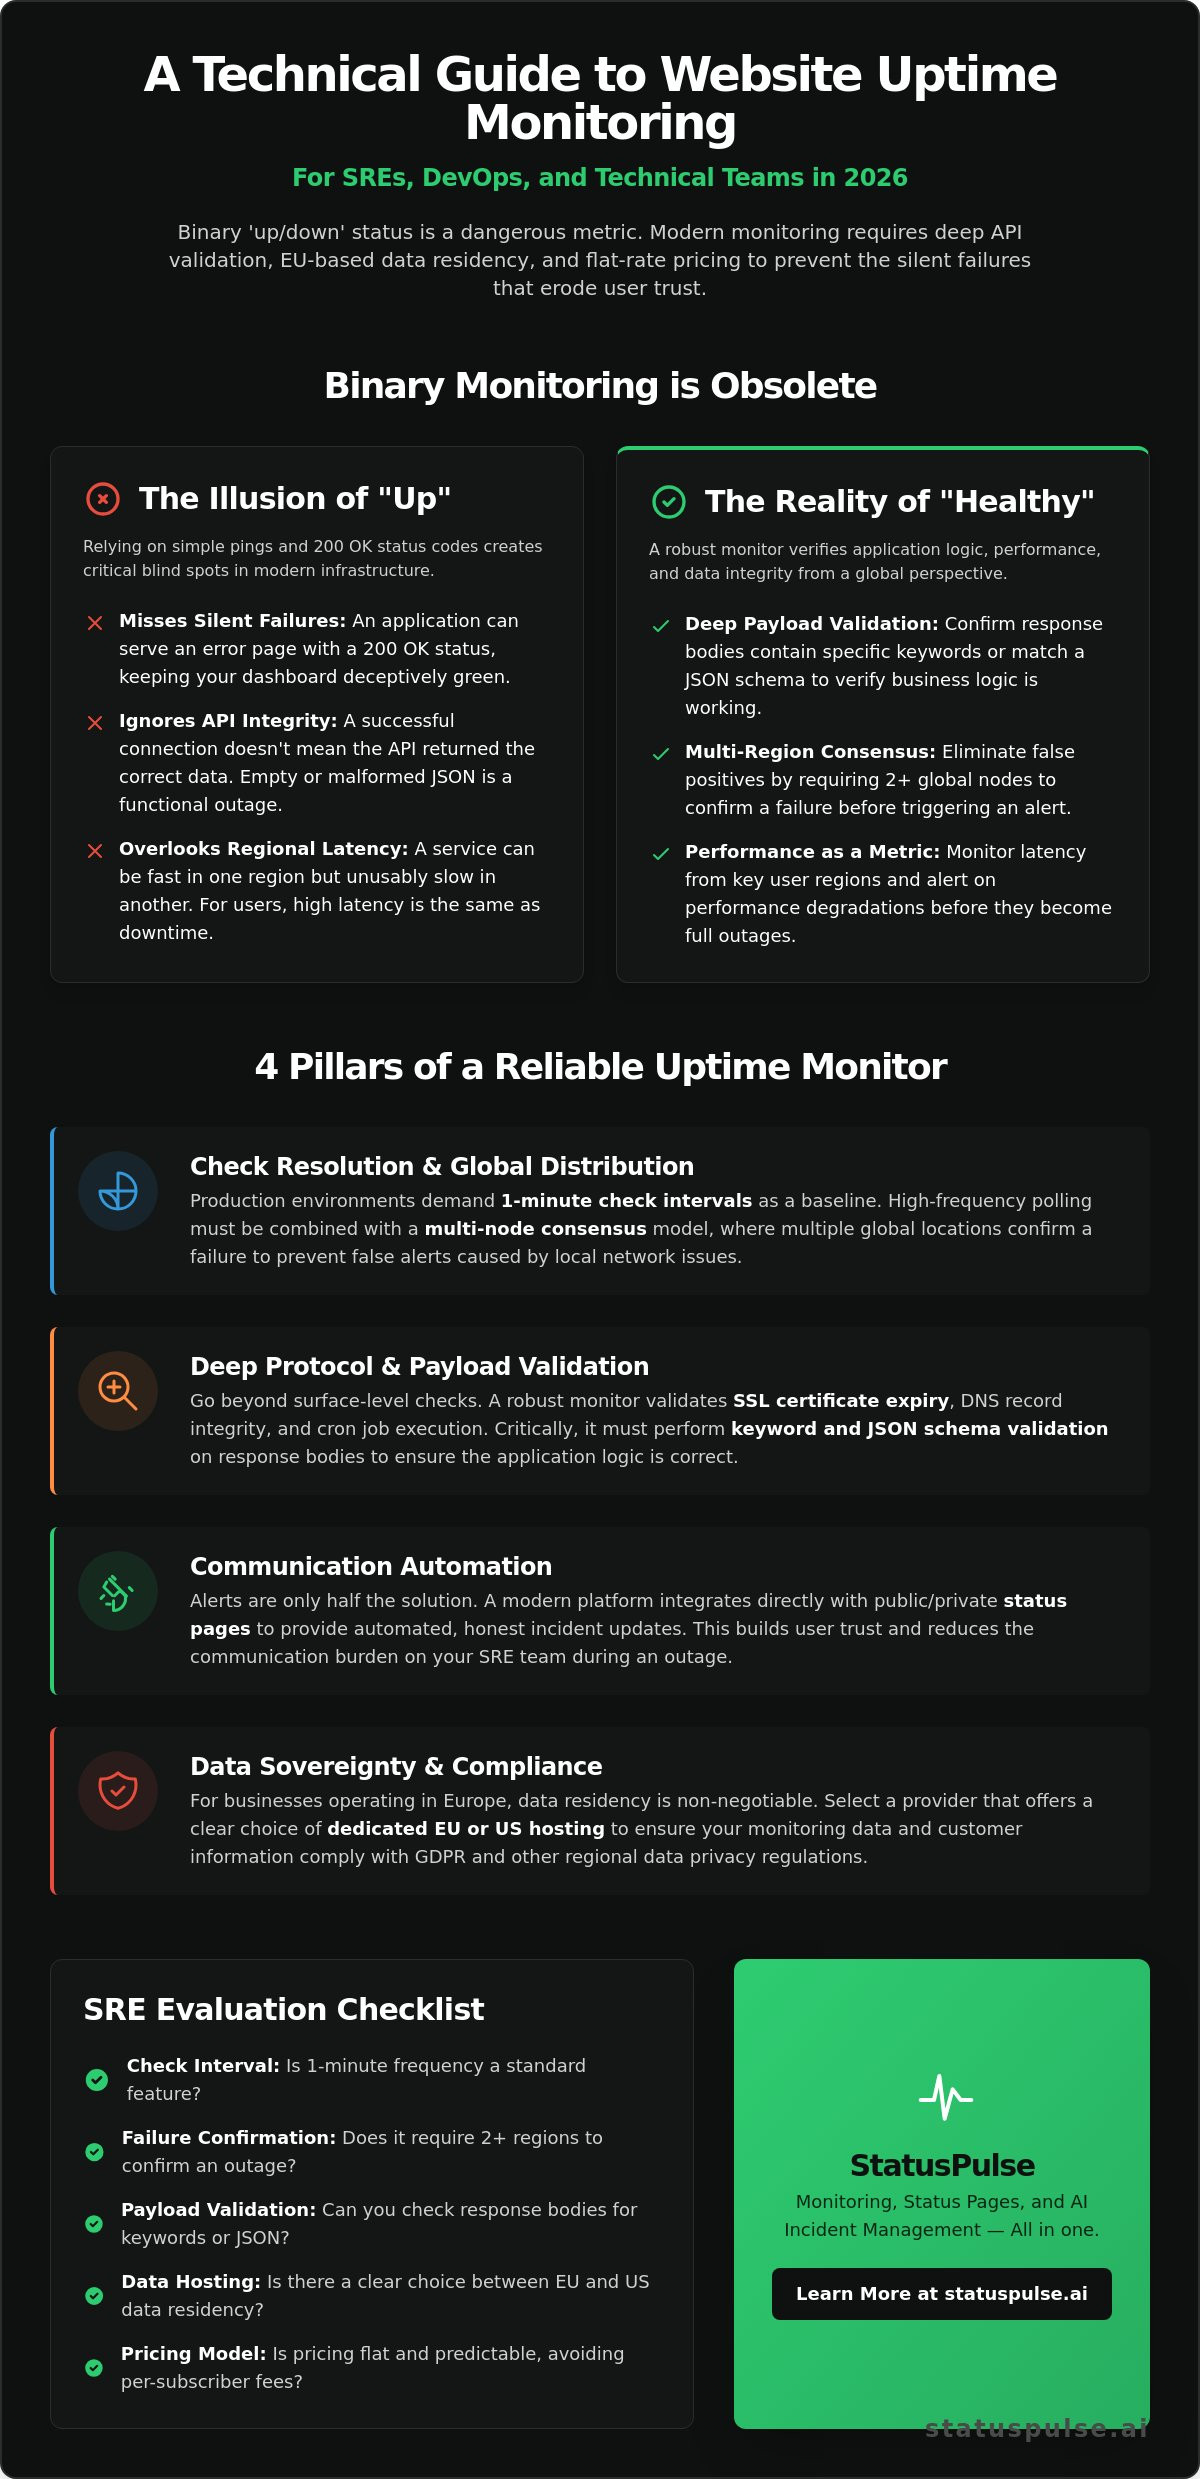
Why Binary Uptime Monitoring is Obsolete in 2026
Relying on a basic ICMP ping or a simple HTTP GET request is no longer enough to verify availability. Modern infrastructure relies on complex inter-dependencies between frontend services, databases, and third-party APIs. A website monitoring strategy that only checks for a 200 OK status will miss critical failures. If your database connection pool is exhausted, your web server might still serve a static error page with a successful header. This is a false positive. Your dashboard stays green while users are stranded.
The Rise of Silent Failures and API Degradation
Silent failures occur when a service appears healthy at the networking layer but fails at the application layer. For example, a zombie process might continue to accept connections without actually processing logic. Effective API endpoint monitoring for automated tasks requires more than just checking connectivity. It demands payload verification and JSON schema validation. If an endpoint returns an empty array instead of the expected data object, your system is down. The HTTP status code doesn't matter if the data is missing.
A robust website uptime monitor must look for specific keywords on the page. This ensures that the underlying rendering engine and database are actually communicating. Without keyword validation, you are monitoring a web server, not a functioning application. It's a dangerous blind spot for any SRE. Integrity checks should be the baseline, not an optional feature.
Latency: The New Downtime
High latency is often indistinguishable from an outage for the end user. If a checkout page takes 30 seconds to load due to a regional routing issue, the customer will leave. The site is effectively down. This is why multi-region checks are essential for a modern website uptime monitor. They help identify partial outages where the site is accessible in London but timing out in New York. These regional spikes often signal deeper infrastructure problems before they become global disasters.
Understanding the distinction between uptime vs performance monitoring is critical for reliability. Uptime checks provide the immediate signal for incident response. Performance monitoring offers the long-term data needed to prevent degradation. In 2026, reliability is defined by system integrity across the entire stack, not just a binary response from a load balancer.
Evaluation Framework: 4 Pillars of a Reliable Website Uptime Monitor
Selecting a website uptime monitor requires a framework that moves beyond the marketing hype of "peace of mind." SREs need tools that provide high-resolution data and verifiable system health. A reliable monitoring strategy isn't just about knowing when a server is down. It's about understanding why it's failing and how that failure impacts different regions. To evaluate a tool effectively, you should focus on four technical pillars: check resolution, protocol depth, communication automation, and data sovereignty.
Check Intervals and Global Distribution
Production environments demand 1-minute check intervals as an absolute baseline. If you use 5-minute or 15-minute polling, a significant outage can persist for several minutes before your team receives the first alert. This delay is unacceptable for services with strict SLAs. However, high-frequency polling from a single location is a recipe for false positives. If a monitoring node in Virginia experiences a local ISP failure, it doesn't mean your application is down for your users in London or Berlin.
A professional website uptime monitor utilizes a consensus-based approach. Multiple global nodes must confirm a failure before an incident is triggered. This distribution should mirror your actual user geography. If most of your traffic is European, your monitoring nodes must be concentrated in EU regions to detect local routing issues or CDN edge failures that US-based nodes might miss.
SRE Evaluation Checklist
Before committing to a provider, run through this technical checklist to ensure the tool meets production standards:
- Multi-node consensus: Does the tool require confirmation from 2+ regions before alerting?
- Custom Headers/Methods: Can you send specific Auth headers or use POST/PUT methods for API checks?
- Keyword/Regex Validation: Can the monitor verify specific JSON keys or HTML strings in the response?
- Heartbeat/Cron Monitoring: Does it support "push" monitoring for background jobs and scheduled tasks?
- SSL/TLS Depth: Does it track the full certificate chain and alert on expiration 30 days out?
- Data Residency: Can you specify that monitoring data stays within the EU or US?
Protocol Integrity and Communication
SSL monitoring acts as a proactive layer against browser trust errors that can block user access entirely. A robust tool tracks the full chain, not just the leaf certificate. DNS monitoring is equally vital. It tracks unauthorized record changes or hijacks that could redirect your traffic to malicious IPs. While a basic uptime check might still return a 200 OK if the malicious server is responsive, your users are compromised.
Technical teams often find that an integrated monitoring and status page solution provides better visibility into these secondary failure points than fragmented tools. Your monitoring data shouldn't be trapped in a silo. It must flow into automated status pages that keep users informed without manual intervention. Clear, flat-rate pricing without per-subscriber fees ensures you can scale these communications as your user base grows.
Comparison of the Top Website Uptime Monitors for Technical Teams
Choosing a website uptime monitor in 2026 involves navigating a landscape of legacy enterprise suites and focused technical tools. Many providers have transitioned to consumption-based models that scale costs based on check frequency or the number of status page subscribers. For SREs, the objective is to find a balance between high-resolution data and predictable, flat-rate billing that doesn't penalize growth.
| Feature | Site24x7 | Pingdom | StatusPulse |
|---|---|---|---|
| Check Interval | 1-minute | Scaling | 1-minute |
| Primary Focus | Enterprise Infrastructure | Synthetic Monitoring | AI Incident Management |
| Data Residency | Global Nodes | Global Nodes | EU or US Choice |
| Pricing Model | Tiered / Add-ons | Scaling per check | Flat-rate |
Site24x7: The Infrastructure Suite
Site24x7 is a comprehensive solution for teams that need to monitor more than just web endpoints. The Starter Plan begins at $9 per month for 10 basic monitors and one advanced monitor at a 1-minute polling frequency. It offers deep integration with broader IT management stacks, making it a powerful choice for large organizations. However, the interface is notoriously cluttered, and managing granular alerts across thousands of resources can become a significant administrative burden.
Pingdom: The Synthetic Standard
Pingdom remains a staple for synthetic monitoring and real user monitoring (RUM). Synthetic Monitoring starts at $15 per month, with pricing that scales based on the number of checks and SMS alerts. It provides reliable global uptime data and is particularly effective for identifying regional performance bottlenecks. The primary trade-off is the cost structure; as your infrastructure expands, the per-check billing can lead to unpredictable monthly expenses that require constant oversight.
StatusPulse: The Technical Peer Alternative
We built StatusPulse to provide the technical depth SREs need without the corporate bloat. It combines uptime monitoring, SSL tracking, and public status pages into a single platform. A core feature is our AI incident management, which assists teams by summarizing logs and drafting technical incident updates during an outage. This reduces the cognitive load on engineers, allowing them to focus on remediation rather than stakeholder management.
Unlike legacy tools, StatusPulse offers a clear, flat-rate pricing model. We don't charge for the number of people viewing your status page or subscribing to updates. You also have the specific choice between EU or US hosting to ensure compliance with regional data sovereignty standards. While we currently offer fewer legacy integrations than century-old incumbents, we prioritize core reliability and transparent communication for modern SaaS teams.
Moving from Monitoring to Observability
Monitoring tells you when a system has failed. Observability tells you why. In 2026, a website uptime monitor should not be an isolated utility. It must function as a high-signal entry point for your entire observability stack. Correlating an external 503 error with internal trace data allows for faster root cause analysis. This transition from "is it up?" to "how is it behaving?" is essential for maintaining complex microservices.
OpenTelemetry and Uptime Standardization
Standardization is the antidote to vendor lock-in. OpenTelemetry has emerged as the industry standard for system health data. It provides a vendor-neutral framework for collecting metrics, logs, and traces. By utilizing an uptime monitor that supports these open standards, you ensure that your availability data remains portable and consistent across different visualization tools.
Integrating external checks with internal telemetry creates a unified view of system health. For example, a latency spike detected by a global monitoring node can be immediately cross-referenced with internal database query logs. This prevents the "it works on my machine" syndrome. It also ensures that your long-term reliability data isn't trapped in a proprietary format owned by a legacy monitoring provider. Vendor neutrality is a core requirement for long-term infrastructure stability.
AI-Driven Incident Management
Technical disruptions are stressful. The most difficult part of an outage is often the communication. SREs are frequently forced to choose between fixing the issue and updating frustrated stakeholders. Automating incident updates reduces support ticket volume and keeps users informed. However, generic automated messages often feel cold or evasive to technical users who want real answers.
Modern tools use AI to bridge this gap. AI can analyze technical logs and summarize the situation into a calm, honest update. This isn't about removing the human element. It's about providing a technical assistant that drafts post-mortems and status updates for your review. A human-in-the-loop approach ensures the final message is accurate and empathetic before it goes public.
By using AI incident management, teams can maintain transparency without sacrificing engineering time. The AI handles the initial drafting of technical timelines and summaries. This allows you to focus on the actual remediation. The result is a more professional incident response that builds trust even during a crisis. It turns a stressful failure into a demonstration of system integrity and operational maturity.
StatusPulse: Monitoring Built on Transparency and EU Standards
We designed StatusPulse as a direct response to the complexity and bloat of legacy monitoring tools. Many SREs are tired of paying enterprise premiums for basic reliability features. Our platform provides a focused website uptime monitor that prioritizes technical precision over marketing noise. It includes 1-minute uptime checks, SSL certificate tracking, and deep API monitoring as standard features. By stripping away unnecessary corporate overhead, we focus on the data that actually prevents outages.
System integrity depends on more than just networking. It requires a monitoring tool that understands the specific needs of modern stacks. Our technical architecture supports keyword validation and JSON schema checks to ensure your application is actually functional, not just "up." This grounded approach helps teams reduce the stress of technical disruptions by providing a reliable, straightforward source of truth.
Flat Pricing for Growing Teams
Most monitoring providers penalize your success by charging per-subscriber fees for status pages. This creates a hidden tax on your growth. We believe incident communication should be accessible to everyone who needs it. StatusPulse includes native public status pages in every plan without charging for individual subscribers. It's a "no surprises" pricing model designed for teams that value budget predictability. You shouldn't have to calculate the cost of telling your users the site is down.
We acknowledge a technical trade-off here. We prioritize core reliability and data integrity over the "flashy" marketing features found in some all-in-one observability suites. If you need a tool that focuses entirely on the precision of your availability data and the clarity of your incident response, we're the right fit. If you require deep infrastructure auto-discovery or complex business intelligence integrations, a larger incumbent may serve you better for now.
Data Sovereignty as a Core Feature
Many monitoring tools treat data residency as an afterthought. For European teams, this is a significant compliance risk under GDPR and the Digital Services Act. StatusPulse treats data sovereignty as a core feature rather than a checkbox. You have the choice between EU or US hosting for your monitoring data and status pages. This ensures your system health data stays in your chosen region, adhering to local privacy standards. We don't default to US hosting unless that's your specific requirement.
Your monitoring nodes and data storage remain physically located where you decide. This regional focus provides the transparency required by modern legal and technical departments. It allows you to prove to your users that their data, and the data about your systems, is handled ethically and legally. You can build trust with your users using StatusPulse by providing a reliable, compliant, and honest window into your system health.
Standardizing Your Reliability Framework
Reliability in 2026 requires moving beyond the simple ping. You need deep validation and regional visibility to catch silent failures before they impact your users. Standardizing on open telemetry and integrity checks ensures your monitoring data remains a technical asset rather than a proprietary silo. It's about maintaining a functional user experience across every region you serve.
Choosing a website uptime monitor involves balancing technical depth with operational ethics. You need a tool that respects your data sovereignty and your budget. StatusPulse provides EU or US hosting, AI-powered incident drafting to reduce high-stress workloads, and transparent, flat-rate pricing without per-subscriber fees. We built this for teams that value precision and honesty over corporate bloat.
Modern uptime monitoring should be straightforward and easy to understand. You've got the framework; now it's time to eliminate the blind spots in your stack. Start monitoring your website for free with StatusPulse and focus on building systems that stay healthy.
Frequently Asked Questions
What is the difference between uptime monitoring and performance monitoring?
Uptime monitoring tracks the binary availability of a service, while performance monitoring measures the speed and quality of the response. Uptime checks tell you if the server is reachable and responding. Performance monitoring analyzes metrics like Time to First Byte (TTFB) and core web vitals. You need both to ensure users can access your site and have a functional experience. Uptime remains the baseline for immediate incident response.
Why should I use a third-party uptime monitor instead of internal logs?
Third-party monitoring provides an external perspective that internal logs cannot capture. Internal logs only track what happens once a request reaches your infrastructure. A website uptime monitor detects failures in the networking layer, such as DNS misconfigurations, CDN edge errors, or ISP routing issues. If your load balancer fails, your internal logs won't show the error because the request never arrived at your application.
Is a 1-minute check interval sufficient for a production SaaS?
A 1-minute check interval is the industry baseline for production SaaS environments. It provides a reliable balance between detection speed and system overhead. While some tools offer 30-second intervals, 1-minute polling is sufficient for the vast majority of SLAs. It ensures you catch global outages quickly without generating excessive noise or accidentally hitting rate limits on your own API endpoints during routine checks.
How does SSL monitoring prevent website downtime?
SSL monitoring prevents downtime by alerting your team well before a certificate expires. When a certificate lapses, modern browsers block access with a security warning. This is functionally equivalent to an outage for your users. Automated checks at 30, 14, and 7 days allow you to manage renewals proactively. It eliminates one of the most common and embarrassing causes of avoidable downtime in modern infrastructure.
Can I host my status page data in the EU for GDPR compliance?
You can host your status page data in the EU with StatusPulse to meet strict GDPR and data sovereignty requirements. Many legacy tools default to US-based storage, which creates compliance hurdles for European companies. We offer a choice of hosting regions. This ensures your monitoring data and incident history remain within your preferred jurisdiction. It simplifies your regulatory reporting and builds trust with privacy-conscious users.
What are the benefits of AI in incident management?
AI in incident management acts as a technical assistant to summarize complex logs and draft incident updates. During an outage, SREs are often overwhelmed by technical tasks and communication demands. AI reduces this cognitive load by generating summaries and timelines for human review. It ensures your status updates remain calm, technical, and honest while you focus on the remediation. It turns a crisis into a controlled process.
Why do some uptime monitors give false positives?
False positives usually occur when a single monitoring node experiences a local network failure or ISP issue. If the website uptime monitor doesn't use a consensus-based approach, it may trigger an alert even if your site is healthy for the rest of the world. A reliable tool verifies failures from multiple global locations before sending a notification. This distribution ensures that only genuine outages trigger your team's pager.
Does StatusPulse charge for status page subscribers?
StatusPulse does not charge for status page subscribers. We use a flat-rate pricing model that allows your audience to grow without increasing your monthly bill. Many competitors charge per-subscriber fees, which effectively taxes your growth and communication. We believe incident communication should be transparent and predictable. You get full access to public status pages and automated updates as part of your core plan without hidden costs.


