

Your static alert thresholds are failing. They catch the catastrophic crashes but usually miss the slow, silent performance degradations that erode user trust. By the time a 5xx error finally triggers your pager, your customers have already noticed the lag. You likely spend more time fighting alert fatigue than investigating genuine system regressions. We agree that the current "threshold and pray" model is broken. It creates too much noise and not enough signal. This article explores Anomaly Detection for Uptime: How a Cross-Tenant LightGBM Model Spots Trouble Early.
You'll learn how leveraging aggregated telemetry across multiple tenants allows models to identify subtle failures that single-tenant data often misses. We'll examine why LightGBM 4.6.0 is often superior to LSTM for time-series latency data. We also cover how to implement these predictive models while maintaining strict GDPR compliance and data sovereignty. Gartner predicts that 40% of organizations deploying AI will use dedicated observability tools by 2028. It's time to move toward a more disciplined, predictive approach to uptime monitoring.
Key Takeaways
- Move beyond static thresholds to identify "grey failures" and performance degradations that do not trigger standard 5xx errors.
- Discover the benefits of Anomaly Detection for Uptime: How a Cross-Tenant LightGBM Model Spots Trouble Early by leveraging aggregated telemetry for better predictive accuracy.
- Understand why tree-based models like LightGBM 4.6.0 outperform LSTMs in speed and memory efficiency for time-series latency monitoring.
- Learn how cross-tenant architectures spot global infrastructure outages before they impact individual services while maintaining strict GDPR data sovereignty.
- Reduce your Time to Detect (TTD) by using AI as a technical assistant to draft incident reports directly from raw anomaly scores.
The Evolution of Uptime Monitoring: Beyond Static Thresholds
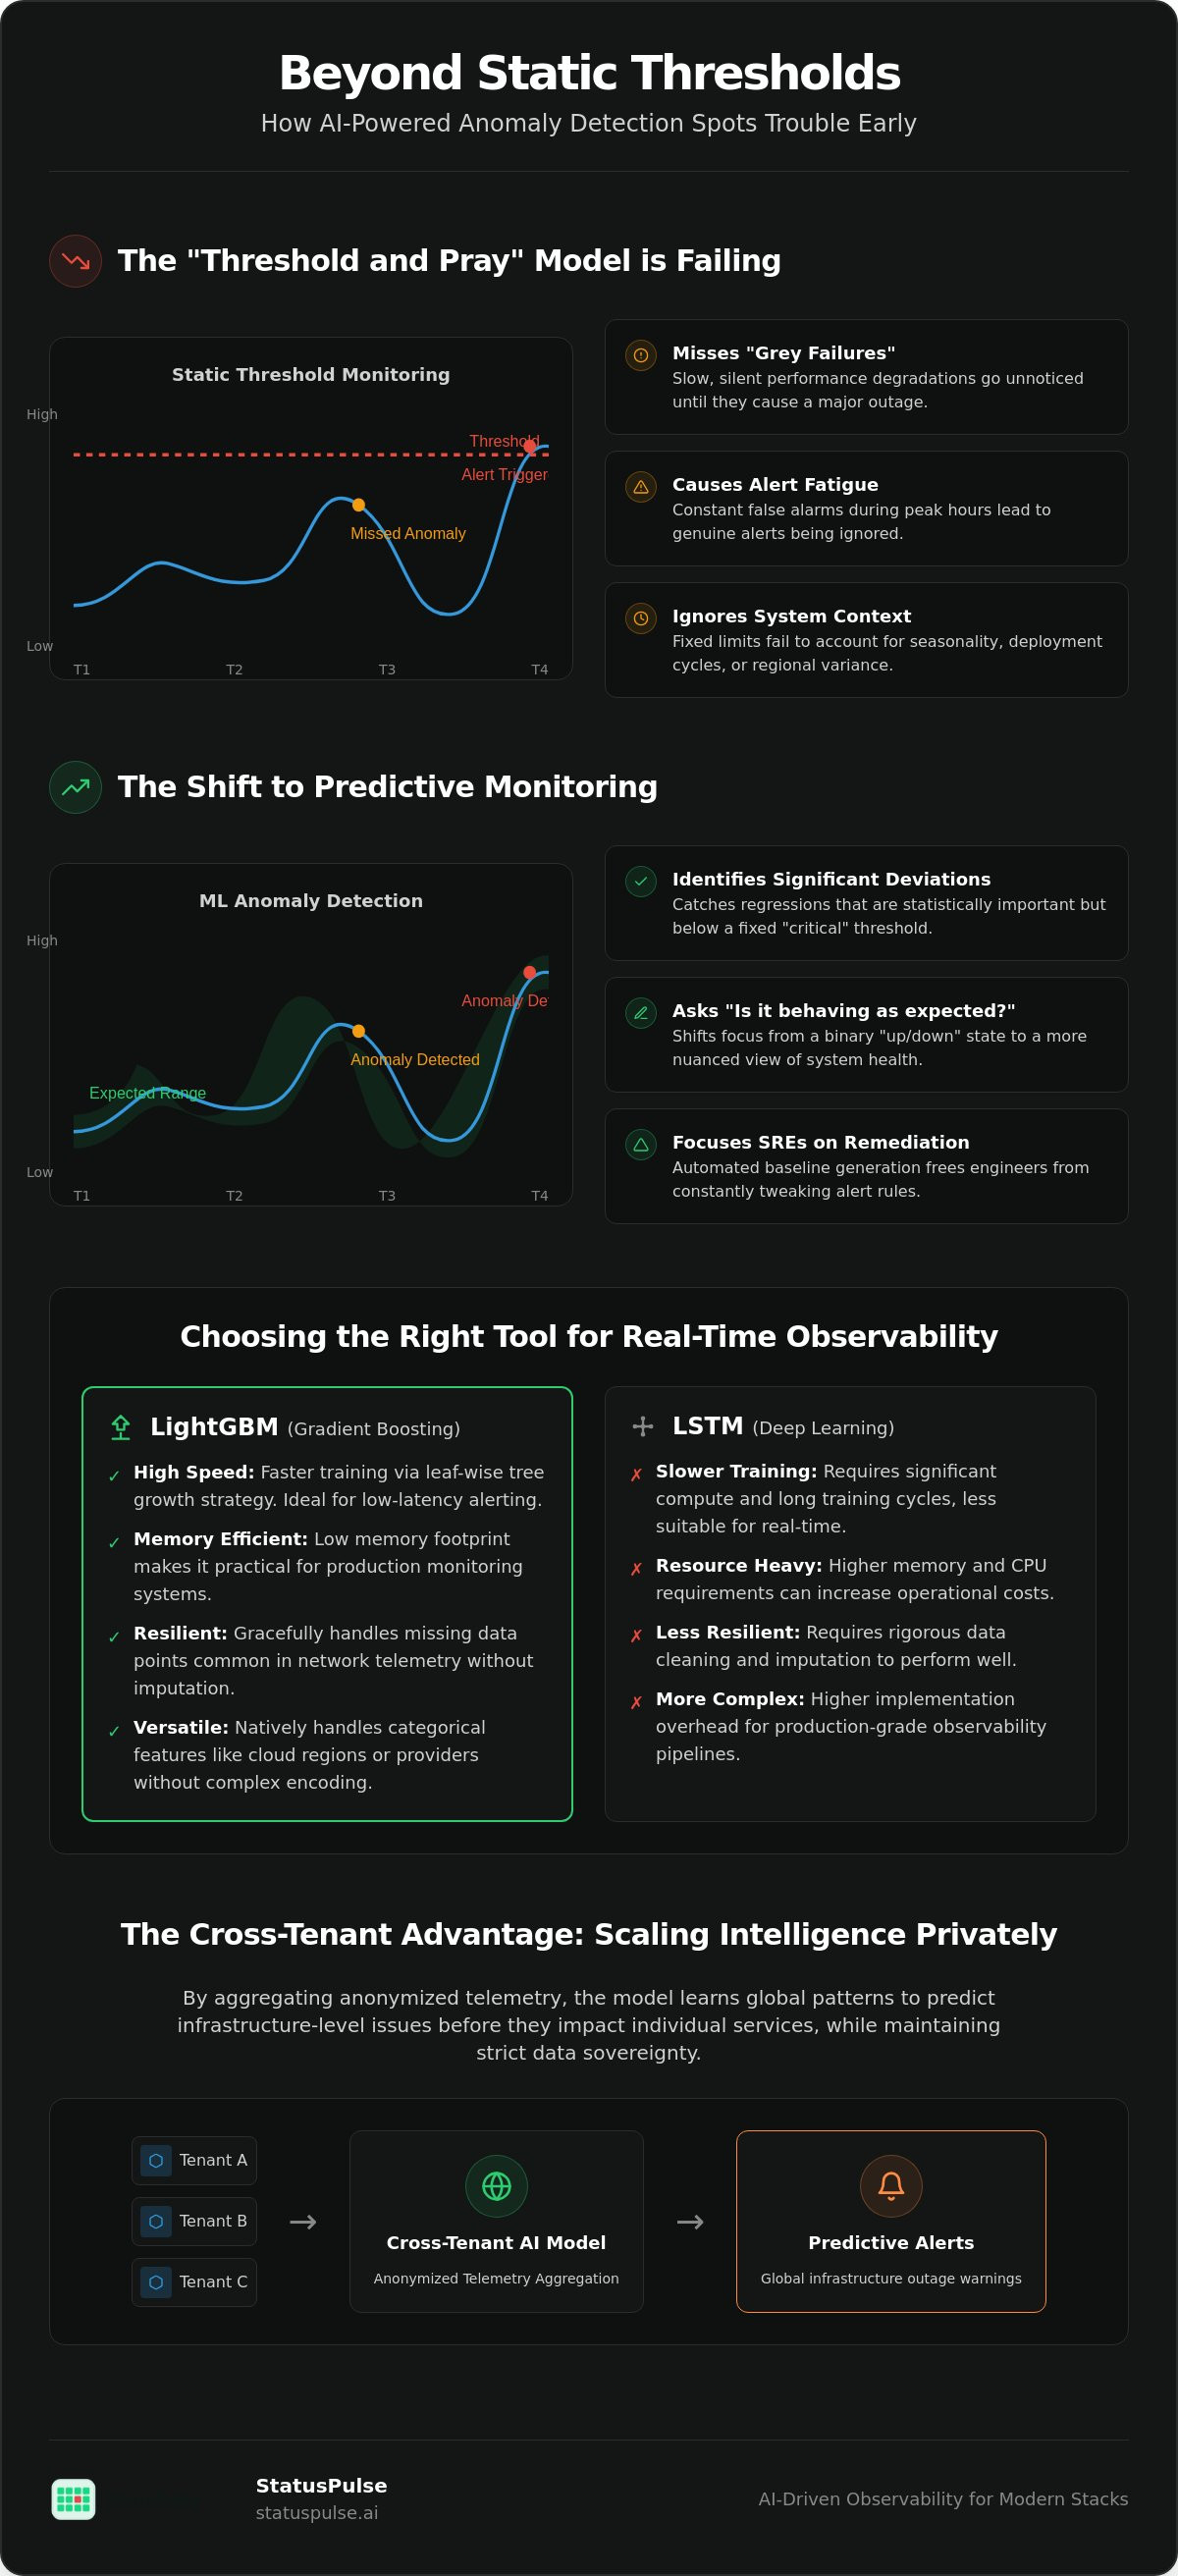
Static thresholds are simple. You set a limit, like 500ms, and wait. If latency crosses that line, you get an alert. But modern infrastructure is rarely that binary. Fixed limits ignore seasonality, deployment cycles, and regional network variance. They create a binary world of "up" or "down" that misses the nuance of modern distributed systems. Relying on these hard-coded rules often leads to a cycle of over-alerting during peak hours and missing critical issues during quiet periods.
This is where anomaly detection comes in. It's the technical process of identifying rare items or observations that differ significantly from the majority of your data. Instead of checking against a fixed number, the system evaluates the current state against an evolving baseline. This shift is critical for Anomaly Detection for Uptime: How a Cross-Tenant LightGBM Model Spots Trouble Early because it allows teams to catch regressions that are statistically significant but still sit below a "critical" threshold. It moves the focus from "is it broken?" to "is it behaving as expected?"
This transition toward behavioral baseline tracking is foundational in other high-stakes fields; ArmIQ, for example, uses data analytics to monitor arm health in baseball, shifting the focus from treating injuries to maintaining optimal performance through anomaly detection.
Traditional statistical models like ARIMA often struggle with modern cloud environments. They were designed for lower cardinality data. In a SaaS stack with hundreds of microservices and thousands of unique metric dimensions, these models become computationally expensive and slow. They often fail to account for the non-linear patterns found in cloud telemetry, leading to false positives that frustrate on-call engineers.
The Problem with "Grey Failures" in SaaS
A service can be technically "up" while remaining functionally broken. We call these grey failures. Perhaps your API returns a 200 OK status, but it takes 4 seconds to do so for 5% of your users. Standard 1-minute uptime checks often miss these intermittent spikes or network jitter. Reactive alerting only fires when the house is already on fire. Proactive anomaly spotting identifies the smoke. By detecting these subtle deviations early, you can investigate a performance regression before it impacts your entire user base.
Machine Learning vs. Heuristics
Manually tuning thresholds for 100+ endpoints is a full-time job. It's also a losing battle. Heuristics require constant adjustment as your traffic grows or your stack changes. Unsupervised machine learning automates this baseline generation. It's an honest trade-off. ML requires more compute power than a simple "if-then" statement, but the precision gains are undeniable. At StatusPulse, we treat AI as a technical assistant to handle this high-dimensional math. This allows SREs to focus on remediation rather than constantly tweaking alert configurations.
Why LightGBM? The Case for Gradient Boosting in Observability
Deep learning isn't always the answer for production observability. While Long Short-Term Memory (LSTM) networks are popular for time-series analysis, they require significant compute and slow training cycles. For real-time telemetry, LightGBM (Light Gradient Boosting Machine) offers a more practical balance. It's built for speed and low memory usage. This makes it ideal for Anomaly Detection for Uptime: How a Cross-Tenant LightGBM Model Spots Trouble Early. Tree-based models naturally handle the non-linear patterns of infrastructure failures better than linear regression ever could.
Infrastructure data is noisy. Network monitoring frequently results in missing data points or extreme outliers during brief outages. LightGBM handles these gracefully. It doesn't require the same level of rigorous data imputation as many neural networks. In network monitoring, a missing packet shouldn't crash your model. LightGBM ignores missing values during a split, which is a more honest way to handle the "gaps" in observability data than forcing a zero or a mean value. This resilience allows for faster deployment in unpredictable cloud environments.
Performance Benchmarks for Time-Series Data
Training times for LightGBM are significantly lower than XGBoost or deep learning alternatives. This is largely due to its leaf-wise growth strategy. While other frameworks grow level-by-level, LightGBM grows trees by choosing the leaf with the max delta loss. This approach reduces loss more effectively per iteration. It's a technical choice that prioritizes accuracy without sacrificing the low-latency requirements of a production pager.
The model also excels at handling categorical features like cloud regions or service providers. You don't need to perform extensive one-hot encoding, which keeps the feature space manageable. Achieving high precision requires careful hyperparameter optimization for LightGBM, specifically tuning the learning rate and number of leaves to avoid overfitting on transient noise. This ensures your alerts reflect genuine anomalies rather than minor network blips.
Feature Engineering for Uptime Telemetry
Model quality depends on the cleanliness of your input. For uptime monitoring, we focus on specific technical markers:
- Time to First Byte (TTFB)
- DNS resolution latency
- TLS handshake duration
The Cross-Tenant Architecture: Scaling Intelligence Privately
Single-tenant models are limited by their own history. They only know what they've seen within one silo. A cross-tenant model acts like a collective immune system for infrastructure. It learns from thousands of monitored services simultaneously. This is the core of Anomaly Detection for Uptime: How a Cross-Tenant LightGBM Model Spots Trouble Early. When a major provider like AWS US-East-1 experiences a brownout, a cross-tenant model identifies the pattern across hundreds of accounts before any single user's threshold is breached.
Sharing technical insights doesn't mean sharing raw data. We prioritize Data Sovereignty by using regional training clusters. EU data stays in the EU. US data stays in the US. This regional isolation ensures compliance while still allowing the model to learn from localized infrastructure trends. It's a principled approach that values privacy as much as precision. You get the intelligence of a global network without compromising your data residency requirements.
Federated Learning vs. Aggregated Metadata
We separate "Private Data" from "Metadata." Private data includes request payloads or headers which we don't need for uptime monitoring. Metadata focuses on latencies, TTFB, and error rates. By aggregating these anonymous signals, we can improve the global model without ever touching sensitive customer information. This approach respects privacy while delivering the benefits of scale. It's a cleaner, more ethical way to build machine learning tools for the enterprise.
Handling Heterogeneous Tenant Behavior
Not all tenants are the same. A high-traffic social app has a different baseline than a low-volume B2B portal. We use personalization layers to adapt the global model to specific application profiles. This prevents a "noisy" tenant from skewing the baseline for everyone else. The result is a model that understands global trends but remains sensitive to your unique traffic patterns. The table below summarizes how we maintain this balance.
| Technique | Technical Function | Privacy Benefit |
|---|---|---|
| Differential Privacy | Adds statistical noise to metadata | Prevents reverse-engineering of specific tenant data |
| Regional Siloing | Clusters training by geography | Ensures compliance with local data residency laws |
| Metadata Aggregation | Learns from latency trends only | Ignores request payloads and user PII |
Building these models requires a dedicated focus on precision. If you're tired of the "black box" approach of larger incumbents, StatusPulse offers a transparent alternative. We provide the technical substance you need to reduce your Time to Detect (TTD) without the corporate bloat or complex pricing models typical of the industry.
Implementation: Building a Resilient Monitoring Pipeline
A resilient pipeline turns raw telemetry into actionable intelligence. It isn't enough to have a model; you need a system that ingests, cleans, and scores data in real-time. This is the operational reality of Anomaly Detection for Uptime: How a Cross-Tenant LightGBM Model Spots Trouble Early. We start by collecting metrics from global probing locations to ensure regional network issues don't bias the global baseline results.
Normalization is the most critical preprocessing step. Latency data is naturally skewed toward the right. We apply log transformations to stabilize variance and prevent the model from being biased by extreme but non-critical spikes. Without this, your anomaly scores will fluctuate wildly, leading to inconsistent alerting. Inference then runs the LightGBM model against incoming 1-minute checks, comparing the live stream to the historical baseline established by the cross-tenant data.
Step-by-Step Pipeline Design
Our pipeline follows a logical, three-step design to move from raw metrics to incident alerts. This structure ensures that every data point is validated before it reaches an engineer's pager.
- Step 1: Metric aggregation via high-frequency API Monitoring. This provides the raw TTFB and latency data needed for training.
- Step 2: Sliding window analysis to identify sustained deviations. We look for patterns over time rather than isolated, transient blips.
- Step 3: Scoring anomalies using a 0-1 probability scale. A score of 0.95 suggests a high likelihood of a genuine system regression.
Reducing False Positives with "Human-in-the-loop"
Alert fatigue is the primary enemy of automated monitoring. If your system cries wolf too often, engineers stop looking at the dashboard. This is the danger of "The Boy Who Cried Wolf" in observability. We implement a confirmation step where the model requires a 95% confidence score before triggering high-priority alerts. This filter ensures that only statistically significant events interrupt your team's focus.
Even a sophisticated website uptime monitor still needs human verification. AI acts as a technical assistant, not a replacement for human agency. The final decision to declare an incident should always involve a specialist who understands the business context. If you want to reduce your TTD without building this infrastructure from scratch, set up your uptime monitoring with StatusPulse today.
StatusPulse: AI-Driven Observability for Modern Stacks
StatusPulse integrates the high-performance LightGBM models we've discussed directly into your standard uptime workflow. We don't believe in "black box" AI that hides its reasoning. Instead, our platform exposes the underlying anomaly scores to your team. This is the practical application of Anomaly Detection for Uptime: How a Cross-Tenant LightGBM Model Spots Trouble Early. It turns raw mathematical deviations into actionable incident drafts that your engineers can review in seconds.
We avoid the "AI tax" common among industry incumbents. Many providers charge extra for machine learning features or add per-subscriber fees for status pages. We don't. We offer flat, transparent pricing. Our goal is to make advanced monitoring accessible to dedicated teams, not just enterprise corporations with bloated budgets. You also choose where your data lives. We provide dedicated hosting in either the EU or the US to ensure you meet your specific data sovereignty requirements.
Closing the Loop: From Detection to Communication
Detecting a failure early is only half the battle. If your users find out about a lag before you tell them, trust is lost. StatusPulse uses anomaly detection to suggest "pre-incident" status page updates. When the model identifies a sustained deviation in TTFB or latency, it drafts a message for you. This allows you to communicate potential issues before they become total outages. It gives you the lead time needed to fix the problem quietly.
A transparent incident communication architecture is essential for building long-term user trust. Our AI acts as a technical assistant by summarizing complex telemetry into clear language for non-technical stakeholders. It explains that "latency has increased in the US-West region" rather than just showing a 0.98 anomaly score. This bridge between technical data and human communication keeps everyone informed without requiring a manual deep dive into logs during a crisis.
Getting Started with Proactive Monitoring
Setting up a new tenant takes less than five minutes. You don't need a PhD in data science to benefit from gradient boosting. We handle the model training and cross-tenant aggregation in the background. Your primary focus remains on shipping code and maintaining your infrastructure. We provide the tools to ensure your uptime remains visible and verifiable.
Data sovereignty is a core virtue in 2026. Whether you're subject to GDPR or other regional regulations, your monitoring data should respect those boundaries. StatusPulse provides the precision of cross-tenant intelligence while maintaining strict data isolation. If you're ready to move beyond static thresholds and catch grey failures before they escalate, start monitoring with StatusPulse. It's a straightforward, reliable tool built by specialists for specialists.
Moving Toward Predictive Reliability
Effective monitoring shouldn't force a trade-off between intelligence and privacy. Using regional hosting in the EU or US ensures your metadata remains compliant while still benefiting from a global "immune system" of infrastructure data. At StatusPulse, we provide this advanced capability through transparent, flat-rate pricing. Our AI-powered incident management tools act as technical assistants, drafting reports so you can maintain human agency during a crisis. If you're ready to stop reacting to 5xx errors and start predicting them, switch to proactive monitoring with StatusPulse. Building a more resilient stack starts with better data.
Frequently Asked Questions
What is the difference between anomaly detection and traditional uptime monitoring?
Traditional monitoring relies on binary thresholds like "alert if latency is over 500ms." Anomaly detection instead builds a statistical baseline of normal behavior. It identifies outliers based on historical patterns rather than fixed limits. This allows you to catch performance regressions that are statistically significant but still stay under a "critical" threshold. It's the difference between knowing your server is down and knowing it is behaving strangely.
Is LightGBM better than LSTM for detecting server outages?
LightGBM is generally better for time-series latency data because it trains faster and requires less compute. While LSTMs are effective for complex sequences, they're often too slow for the high-frequency requirements of production observability. LightGBM 4.6.0 handles the non-linear nature of infrastructure metrics efficiently. It provides the low-latency inference needed to trigger alerts in seconds rather than minutes, saving precious time during an incident.
How does cross-tenant monitoring protect my company privacy?
Privacy is maintained by aggregating anonymous metadata rather than raw request payloads. We focus on technical markers like TTFB and DNS resolution times. This architecture is central to Anomaly Detection for Uptime: How a Cross-Tenant LightGBM Model Spots Trouble Early. By using regional training clusters in the EU and US, we ensure that your monitoring data never leaves its legal jurisdiction. This approach maintains strict data sovereignty and compliance.
Will AI anomaly detection increase my number of false alerts?
Actually, it should decrease your false alert volume. Traditional thresholds often fire during expected traffic surges or transient network blips. Anomaly detection models require a high confidence score, often 95% or higher, before triggering an incident. This technical filter ensures that engineers are only paged for genuine regressions. It effectively reduces the noise that leads to on-call burnout while ensuring critical issues aren't ignored.
Can LightGBM detect SSL certificate expiration issues?
LightGBM isn't used for SSL certificate monitoring because expiration is a deterministic event. You don't need a machine learning model to predict when a certificate will expire; you just need to check the date. We use standard, reliable polling for SSL and domain monitoring. AI is best reserved for high-cardinality data where patterns are difficult to define with simple rules, such as intermittent API latency spikes.
How does EU hosting impact the performance of AI monitoring models?
EU hosting ensures your metadata remains under GDPR jurisdiction without sacrificing model accuracy. The performance of the AI clusters is identical across regions. However, hosting your monitoring locally can reduce the latency of the monitoring probes themselves. This regional approach supports data sovereignty and provides peace of mind for SREs who must comply with strict European privacy standards. We give you the choice between EU and US hosting.
Do I need a data science team to use StatusPulse AI features?
You don't need a data science team to benefit from our AI features. We handle the feature engineering, model training, and hyperparameter optimization in the background. The AI acts as a technical assistant that drafts incident reports based on raw anomaly scores. You simply review the output and take action. It's designed to be a straightforward tool for developers who want results without managing complex infrastructure.
What happens if the AI model fails to detect an outage?
We use a hybrid monitoring approach to ensure reliability. If the AI model misses a subtle anomaly, standard uptime checks act as a safety net for hard failures. AI is an additional layer of intelligence, not a replacement for basic connectivity tests. This multi-layered strategy ensures that catastrophic outages are always caught, even if the predictive model finds the data too noisy to score with high confidence.


