

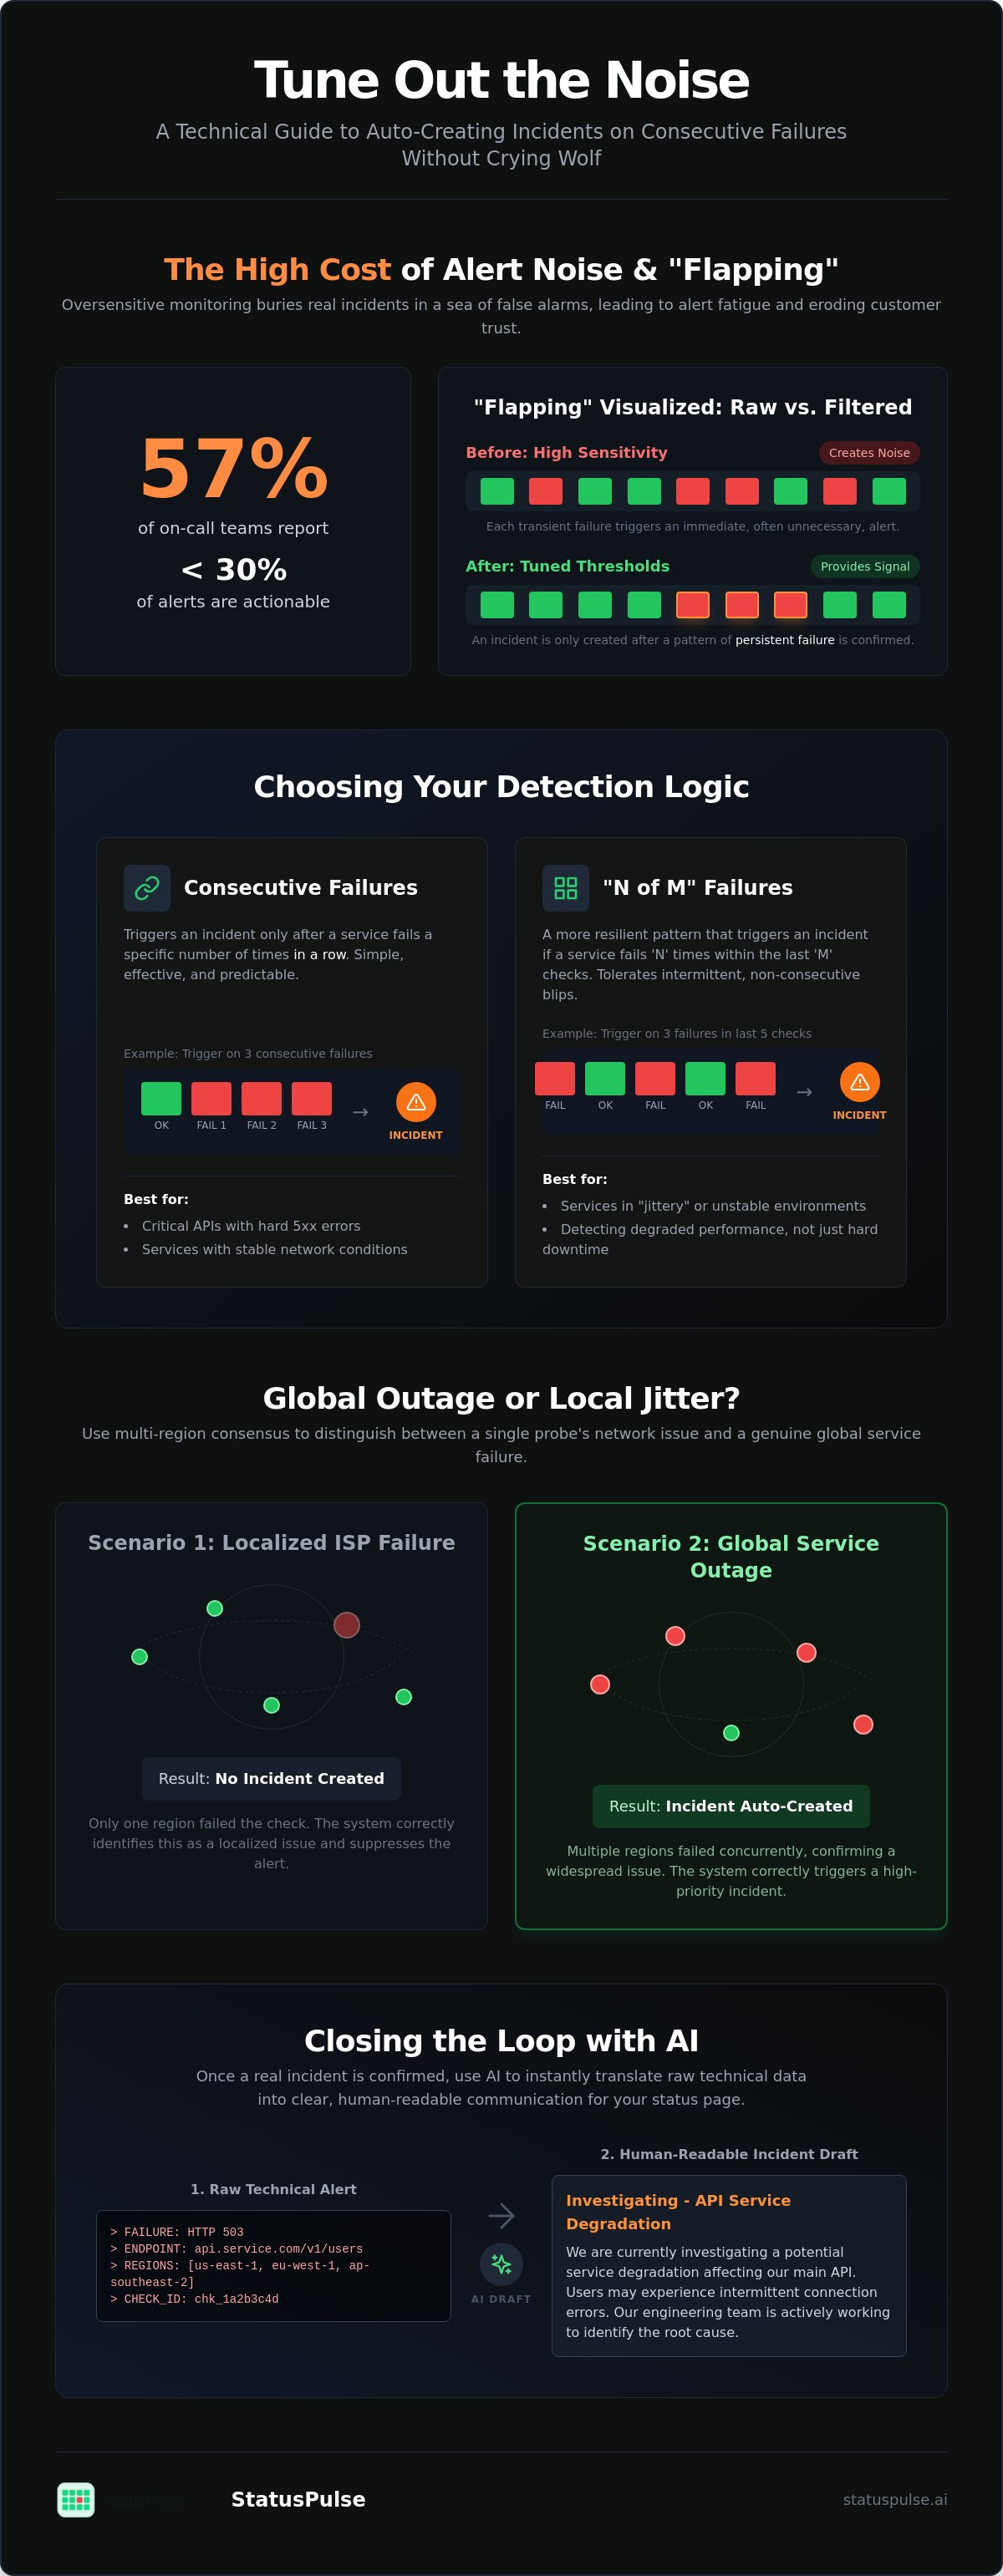
57% of on-call teams report that fewer than 30% of the alerts they receive are actually actionable. This constant noise is more than an annoyance; it's a measurable risk that leads to ignored notifications and missed outages. When your monitoring setup is too sensitive, it treats every minor network jitter like a total system collapse. You need a better strategy for Auto-Creating Incidents on Consecutive Failures: Tuning Thresholds That Don't Cry Wolf. By requiring a specific sequence of failures before triggering an alert, you filter out the noise and protect your team's focus.
You likely agree that manual incident reporting is a drain on resources during a crisis. You want automation that works, but you can't risk your status page flapping and eroding customer trust. This guide will show you how to configure persistent failure logic and multi-region verification to build an incident pipeline you can actually trust. We will cover specific 'N of M' configurations, multi-region probe logic, and how to use AI to draft accurate incident reports so you can finally get a full night of sleep.
Key Takeaways
- Identify and mitigate "flapping" to prevent transient network blips from triggering false alarms and eroding customer trust.
- Compare the technical trade-offs between simple consecutive failure logic and the more resilient "N of M" pattern for error detection.
- Configure Auto-Creating Incidents on Consecutive Failures: Tuning Thresholds That Don't Cry Wolf to automate your incident pipeline with precision.
- Implement multi-region consensus models to distinguish between localized ISP jitter and genuine global service downtime.
- Use AI-assisted drafting to transform raw technical error codes into human-readable incident summaries for your public status page.
The Cost of Flapping: Why Sensitivity Often Fails in Incident Management
Monitoring sensitivity is a double-edged sword. Many teams set their thresholds to trigger at the first sign of a 5xx error, believing that 100% sensitivity equals 100% visibility. In reality, this creates "flapping." Flapping is the rapid cycling between up and down states caused by transient network errors or temporary resource exhaustion. It turns your monitoring dashboard into a strobe light of false positives.
The technical debt of high sensitivity is measurable. When a probe fails once and immediately triggers an alert, it ignores the reality of distributed systems. Network jitter, brief DNS resolution delays, or a single dropped packet can all cause a momentary failure that resolves itself in seconds. Treating these as incidents is a failure of logic. It forces your team to manage noise instead of infrastructure.
Quantifying Alert Fatigue in DevOps Teams
The primary enemy of operational excellence is Alarm fatigue. As of 2026, 57% of on-call teams report that fewer than 30% of their alerts are actionable. This creates a "Boy Who Cried Wolf" effect where genuine outages are buried under a mountain of non-events. When the phone pings every time a local ISP has a 200ms spike, engineers eventually stop looking at the notifications.
The cost of these interruptions goes beyond frustration. Research indicates that a one-minute false alarm can cost an engineer up to twenty minutes of productivity due to context switching. If a median operations center processes nearly 1,000 alerts per day, the cumulative loss of focus is staggering. Successfully implementing Auto-Creating Incidents on Consecutive Failures: Tuning Thresholds That Don't Cry Wolf is the only way to reclaim that time. It moves the team from a reactive state to a focused, proactive one.
The Trust Paradox: Why Honesty Requires Precision
Public status pages are communication tools, not raw data dumps. There is a common misconception that displaying every micro-failure demonstrates transparency. It doesn't. It erodes customer trust. If your status page "flaps" every time a single monitoring probe in London times out, your service looks unstable even when 99% of your users are unaffected. Precision in reporting is more ethical than raw, unverified data.
The goal is to automate incidents only when the user experience is genuinely degraded. This requires a hierarchy of filters that distinguish between a "blip" and a "break." StatusPulse addresses this by combining uptime monitoring with native incident logic. It ensures that an incident is only created once a failure persists across multiple checks. This approach balances the need for speed with the requirement for accuracy. You provide a reliable source of truth for your users without the manual overhead of drafting reports for every transient error.
Choosing between a false positive and a missed outage is a constant trade-off. However, a system that defaults to "down" on a single failure is technically immature. By tuning your thresholds to require consecutive failures, you ensure that when an alert finally hits an engineer's phone, it actually matters. This philosophy of precision detection is universal; for those interested in how similar filtering logic is applied to automotive signal detection, you can find out more.
Logic Patterns for Persistent Failure Detection
Detecting downtime requires more than a binary "up" or "down" sensor. Reliability engineers use persistence filters to distinguish between a momentary hiccup and a genuine outage. The most common method is the consecutive failure count. If a probe fails three times in a row, the system assumes the service is down. This simple logic is effective for hard 5xx errors where the server is clearly failing to respond.
However, consecutive counts can be too rigid for jittery environments. The "N of M" pattern offers a more resilient alternative. In this model, you might require 3 failures out of the last 5 checks to trigger an alert. This sliding window logic accounts for intermittent errors that don't occur back-to-back, such as a database under heavy load that occasionally drops a connection. When implementing Auto-Creating Incidents on Consecutive Failures: Tuning Thresholds That Don't Cry Wolf, you must also define a reset rule. Usually, a single 200 OK response should clear the failure counter to zero, ensuring that a recovering service doesn't trigger a stale alert.
Threshold Recommendations by Service Type
Thresholds should mirror the criticality of the service. For a standard SaaS SLA, an ideal persistence filter is 3 consecutive failures at 60-second intervals. This provides a 3-minute buffer before customers are notified. You can categorize your thresholds as follows:
- Critical APIs: 2-3 consecutive failures (30-60 second window). High sensitivity is required here to protect downstream services.
- Marketing Websites: 5 consecutive failures or 3 of 5 (5-minute window). These are less critical and often subject to third-party CDN jitter.
- Internal Tools: Higher thresholds (e.g., 5-10 failures). Prevents paging your team for tools that don't impact the end-user experience.
The Math of Time: Check Intervals vs. Thresholds
Every threshold is a trade-off between "Time to Detect" and "Time to Verify." If you check every 60 seconds with a 3-failure threshold, your minimum time to alert is 180 seconds. Shortening the interval increases your monitoring costs and server load. Lengthening the threshold delays your response time. Excessive alerts are often an unintended consequence of the computerization of monitoring, where we prioritize data volume over signal quality. Below is a configuration example for a robust monitoring probe:
monitoring:
  endpoint: "https://api.example.com/health"
  interval: 60s
  threshold_type: "n_of_m"
  threshold_n: 3
  threshold_m: 5
  timeout: 5s
Setting these values correctly ensures your automated incident pipeline is both fast and accurate. If you want to simplify this logic, StatusPulse natively handles N of M logic, allowing you to focus on code rather than fine-tuning YAML files for every new endpoint.
Multi-Region Verification: Filtering Global Outages from Local Jitter
A single failed check from a London probe doesn't mean your entire application is down. It often means a local ISP is having a bad day or a BGP leak is rerouting traffic through a black hole. These tradeoffs define modern security operations; you must decide if you value immediate notification over accuracy. Relying on a single geographic point of failure is a recipe for false alarms. Multi-region verification acts as a necessary sanity check for your automated systems.
The consensus model requires at least two distinct regions to confirm a failure before any action is taken. This is the foundation of Auto-Creating Incidents on Consecutive Failures: Tuning Thresholds That Don't Cry Wolf. If London reports a 503 but New York and Frankfurt see a 200 OK, the problem is likely localized jitter. You shouldn't wake an engineer for a routing issue that affects only a small fraction of your traffic unless your specific SLA demands it. By integrating multi-region consensus with Auto-Creating Incidents on Consecutive Failures: Tuning Thresholds That Don't Cry Wolf, you create a filter that only triggers when the problem is undeniable.
Solving the 'Observer Effect' in Monitoring
Sometimes the monitoring tool itself is the source of the error. A regional outage at a major cloud provider can take down the very probes meant to watch your site. Implementing a quorum ensures the monitor isn't hallucinating. A 2/3 or 3/5 region agreement provides a high-confidence signal. This distinguishes between a regional latency spike and a hard global outage. It prevents your status page from flapping due to issues outside your own infrastructure.
Practical Setup for Multi-Region Probes
Strategic probe placement is vital for maintaining technical authority and data sovereignty. If you host in the EU to comply with GDPR, your monitoring should reflect that reality. Probes should be placed in major AWS or GCP regions but also at edge locations to mimic real user paths. For a deeper dive into how geography impacts your metrics, see the StatusPulse guide to multi-region latency. This ensures your data is accurate and legally compliant.
When a single region fails but others remain healthy, your automation should reflect a "Partial Outage" or "Degraded Performance" state. This level of detail builds trust. It shows you are in control of your stack and aware of regional nuances. StatusPulse allows you to choose between EU and US hosting for your monitoring data. This choice supports data sovereignty without defaulting to a single global region. You get the benefit of global probes while keeping your management data exactly where you need it.
Implementation: Tuning Thresholds for Auto-Created Incidents
Moving from manual reporting to automated incident creation requires a structured approach. You can't just flip a switch; it requires logic. Implementation follows a direct path to ensure your public status page remains a source of truth while protecting your team from unnecessary interruptions.
Step 1: Define the 'Criticality' of the monitored endpoint. A broken checkout flow is a P1 failure. A missing image on a blog post is not. Step 2: Set the Persistence Filter. As established, 3 consecutive failures is a standard starting point for SaaS. Step 3: Apply the Geographic Filter. Require at least 2 regions to agree on the failure. Step 4: Connect the trigger to an 'Investigating' incident template. This buys your team time to perform root cause analysis while keeping customers informed. Step 5: Define the 'Auto-Resolve' logic. Ensure the incident closes automatically only after a sustained period of healthy 200 OK responses.
Implementing Auto-Creating Incidents on Consecutive Failures: Tuning Thresholds That Don't Cry Wolf means trusting your logic. If your thresholds are too tight, you'll publish noise. If they're too loose, you'll be late to the conversation.
Automating the Public Status Page Safely
Safety comes from tiered automation. For high-traffic endpoints, use 'Draft' mode for automated incidents. This alerts your team to a drafted report that requires one human click to publish. For less critical services, 'Immediate Publish' is often acceptable if the persistence filter is high enough.
Tagging incidents with 'Automated Detection' is an ethical way to manage user expectations. It signals that the system has detected a problem and a human is currently investigating. Linking monitoring metadata, like specific error codes and affected regions, directly to the report provides immediate technical context for your users.
Avoiding the 'Incident Storm'
A single database failure can trigger a dozen alerts if your microservices aren't mapped correctly. Use dependency mapping to suppress child alerts when a parent service is down. Rate limiting is also essential. Set a cooldown period to ensure only one incident is created per service per 15 minute window.
Before enabling 'Auto-Publish', use this checklist:
- Is the persistence filter set to at least 3 checks?
- Is multi-region consensus required?
- Are dependency rules active to prevent alert storms?
- Is an 'Investigating' template ready for each service?
Automating these workflows reduces the manual overhead of drafting reports during an outage. Successful implementation of Auto-Creating Incidents on Consecutive Failures: Tuning Thresholds That Don't Cry Wolf requires a balance between speed and certainty. If you're ready to build a more resilient pipeline, you can automate incident management with StatusPulse to handle these thresholds natively.
Closing the Loop: AI-Assisted Incident Management with StatusPulse
The final step in a resilient monitoring strategy is translating technical failure logic into clear, human communication. While your persistence filters identify the problem, raw error codes rarely help your customers. StatusPulse bridges this gap by combining Uptime Monitoring with native incident management. This integration ensures that when your thresholds are met, the system doesn't just alert your team; it prepares the response.
AI plays a specific, supportive role here. Instead of a generic "503 Service Unavailable" notification, the system analyzes the failure context to draft a summary like "API Latency in EU-West." This moves your team away from manual drafting during a crisis. By adopting Auto-Creating Incidents on Consecutive Failures: Tuning Thresholds That Don't Cry Wolf, you ensure that the data entering your communication pipeline is already high-signal. The AI acts as an assistant, but the final agency remains with the human. An SRE reviews the draft and clicks "Publish," providing a final sanity check before the update goes live.
Unlike many industry incumbents, StatusPulse uses flat pricing models. We don't charge per-subscriber fees because we believe that cost should never be a barrier to transparent communication. This ethical approach allows you to automate notifications for as many users as necessary without worrying about a ballooning invoice. It's a straightforward alternative for teams tired of corporate bloat and complex billing.
AI Triage: Beyond Simple Thresholds
Modern incident management requires more than just counting errors. As of 2026, 72.9% of organizations have deployed AI in some form, yet many still struggle with operational maturity. StatusPulse uses AI to correlate log patterns with your consecutive failure sequences. This helps distinguish between a database connection timeout and a simple frontend asset failure. To support data sovereignty, we offer a choice between EU and US hosting for all monitoring data. This ensures your logs and incident reports remain within your required jurisdiction while maintaining strict GDPR compliance.
Transitioning to Automated Transparency
The shift to automated transparency should be gradual. Start by configuring "Internal Alerts" using your new persistence logic. Once your team trusts that the system isn't crying wolf, enable "Draft Mode" for public incidents. This "Honesty Edge" allows you to beat the slow, manual silence of your competitors. Fast, accurate automation builds more trust than a manual status page that only updates an hour after the outage began. If you're ready to reduce on-call stress, you can build your resilient incident pipeline with StatusPulse today.
Reclaiming Your On-Call Focus
Reliability isn't built on 100% sensitivity; it's built on precision. By moving away from binary alerts and adopting persistence logic, you eliminate the "flapping" that erodes customer trust. Multi-region consensus acts as the final gatekeeper, ensuring that localized ISP jitter never triggers a global incident report. To ensure the underlying hardware and network are just as stable, solutions from terapixels.net provide the structural cabling and remote monitoring management needed to keep your operations running smoothly. These technical filters allow your SRE team to focus on root cause analysis instead of managing noise.
Successfully implementing Auto-Creating Incidents on Consecutive Failures: Tuning Thresholds That Don't Cry Wolf transforms your status page into a reliable source of truth. You move from a reactive state of firefighting to a controlled, automated communication workflow. This shift reduces context switching costs and protects your team from the burnout associated with non-actionable alerts.
StatusPulse handles this complexity natively with EU and US hosting options and AI-powered incident drafting. Our flat, transparent pricing model means you never pay per-subscriber fees for being honest with your users. It's time to build a monitoring pipeline that respects your time and your data sovereignty. Start Monitoring with StatusPulse – No Per-Subscriber Fees. You've earned a full night of sleep.
Frequently Asked Questions
What is the ideal number of consecutive failures for a production API?
Three consecutive failures at 60-second intervals is the standard benchmark for production APIs. This configuration provides a three-minute buffer that filters out transient network blips while ensuring you are notified quickly during a genuine outage. Setting this threshold lower often leads to alert fatigue, while setting it higher may violate your recovery time objectives.
How do I prevent false alarms caused by scheduled maintenance?
You should utilize maintenance windows to pause monitoring or suppress alerts during planned downtime. Most professional tools allow you to define these windows via API or a dashboard. This prevents your automation from Auto-Creating Incidents on Consecutive Failures: Tuning Thresholds That Don't Cry Wolf when you are intentionally taking a service offline for infrastructure updates.
Can I automate incident creation for SSL certificate expirations?
Yes, but SSL monitoring requires a date-based threshold rather than a failure count. You should configure your system to trigger alerts at 30, 14, and 7 days before expiration. This allows your team to handle renewals during standard business hours instead of treating a preventable expiration as an emergency page.
Does multi-region monitoring significantly increase 'Time to Alert'?
Multi-region monitoring adds a negligible delay, usually only the few seconds required for a consensus check between probes. While a single-region check might be marginally faster, the risk of a false positive from localized ISP jitter is significantly higher. The slight increase in detection time is a necessary trade-off for high-confidence incident reporting.
What is the difference between 'N of M' and 'Consecutive Failures'?
Consecutive failures require a strict, unbroken sequence of errors, such as three failures in a row. The "N of M" pattern is a sliding window that requires a specific number of failures within a larger set of checks, like three failures out of the last five attempts. N of M is generally superior for detecting intermittent issues that might be masked by an occasional successful response.
How does StatusPulse handle data sovereignty for EU-based companies?
StatusPulse provides dedicated EU and US hosting options to support regional data sovereignty requirements. EU-based companies can ensure their monitoring data and incident logs remain within the European Economic Area. This simplifies GDPR compliance by keeping all operational data within your required jurisdiction without defaulting to US-based infrastructure.
Should I always auto-publish incidents to my public status page?
You should only auto-publish when your monitoring thresholds are high enough to guarantee a total service failure. For most teams, using a "Draft" mode is a safer approach. This allows the system to perform the heavy lifting of Auto-Creating Incidents on Consecutive Failures: Tuning Thresholds That Don't Cry Wolf while giving an engineer the final chance to verify the technical context before the report goes public.
How can AI help reduce the stress of on-call rotations?
AI reduces stress by handling the initial triage and drafting of incident reports. Instead of waking up to a raw 503 error code, an on-call engineer receives a human-readable summary of the actual impact. This reduces the cognitive load during a crisis and allows your team to focus on remediation rather than drafting status updates.


