
You've finally closed the incident, but the real work is just beginning. Now you have to spend three hours hunting through Slack threads and log timestamps to piece together a timeline for the post-mortem. This "reconstruction tax" is a sign of a broken process. It wastes engineering talent and creates information silos that leave your support team in the dark. To stop the leak, you need a structured approach. From Alert to Post-Mortem: An 8-Phase Incident Lifecycle That Doesn't Lose the Thread provides a blueprint for capturing data while you work, not after.
We know that technical resolution is only one part of the job. If your status page is out of sync with your engineering reality, customer trust evaporates. This article explains how to bridge that gap using a clear, 8-phase framework. You'll learn how to automate timeline capture, improve transparency, and drive down your MTTR. We'll walk through each stage of the response, from the first alert to the final report, so your team never loses the thread again.
Key Takeaways
- Learn how to implement a process From Alert to Post-Mortem: An 8-Phase Incident Lifecycle That Doesn't Lose the Thread, ensuring critical technical data is captured in real-time rather than reconstructed from memory.
- Eliminate the "reconstruction tax" by moving away from manual Slack archaeology and toward automated timeline construction using AI-driven tools.
- Bridge the gap between engineering and support by integrating public status pages that update automatically, maintaining transparency without adding manual overhead.
- Understand the importance of data sovereignty and why choosing EU or US hosting is critical for meeting modern regulatory reporting requirements like NIS2.
- Build a sustainable, blameless post-mortem culture that focuses on systemic vulnerabilities rather than human error to drive down long-term MTTR.
Why Linear Incident Response Fails in Complex Systems
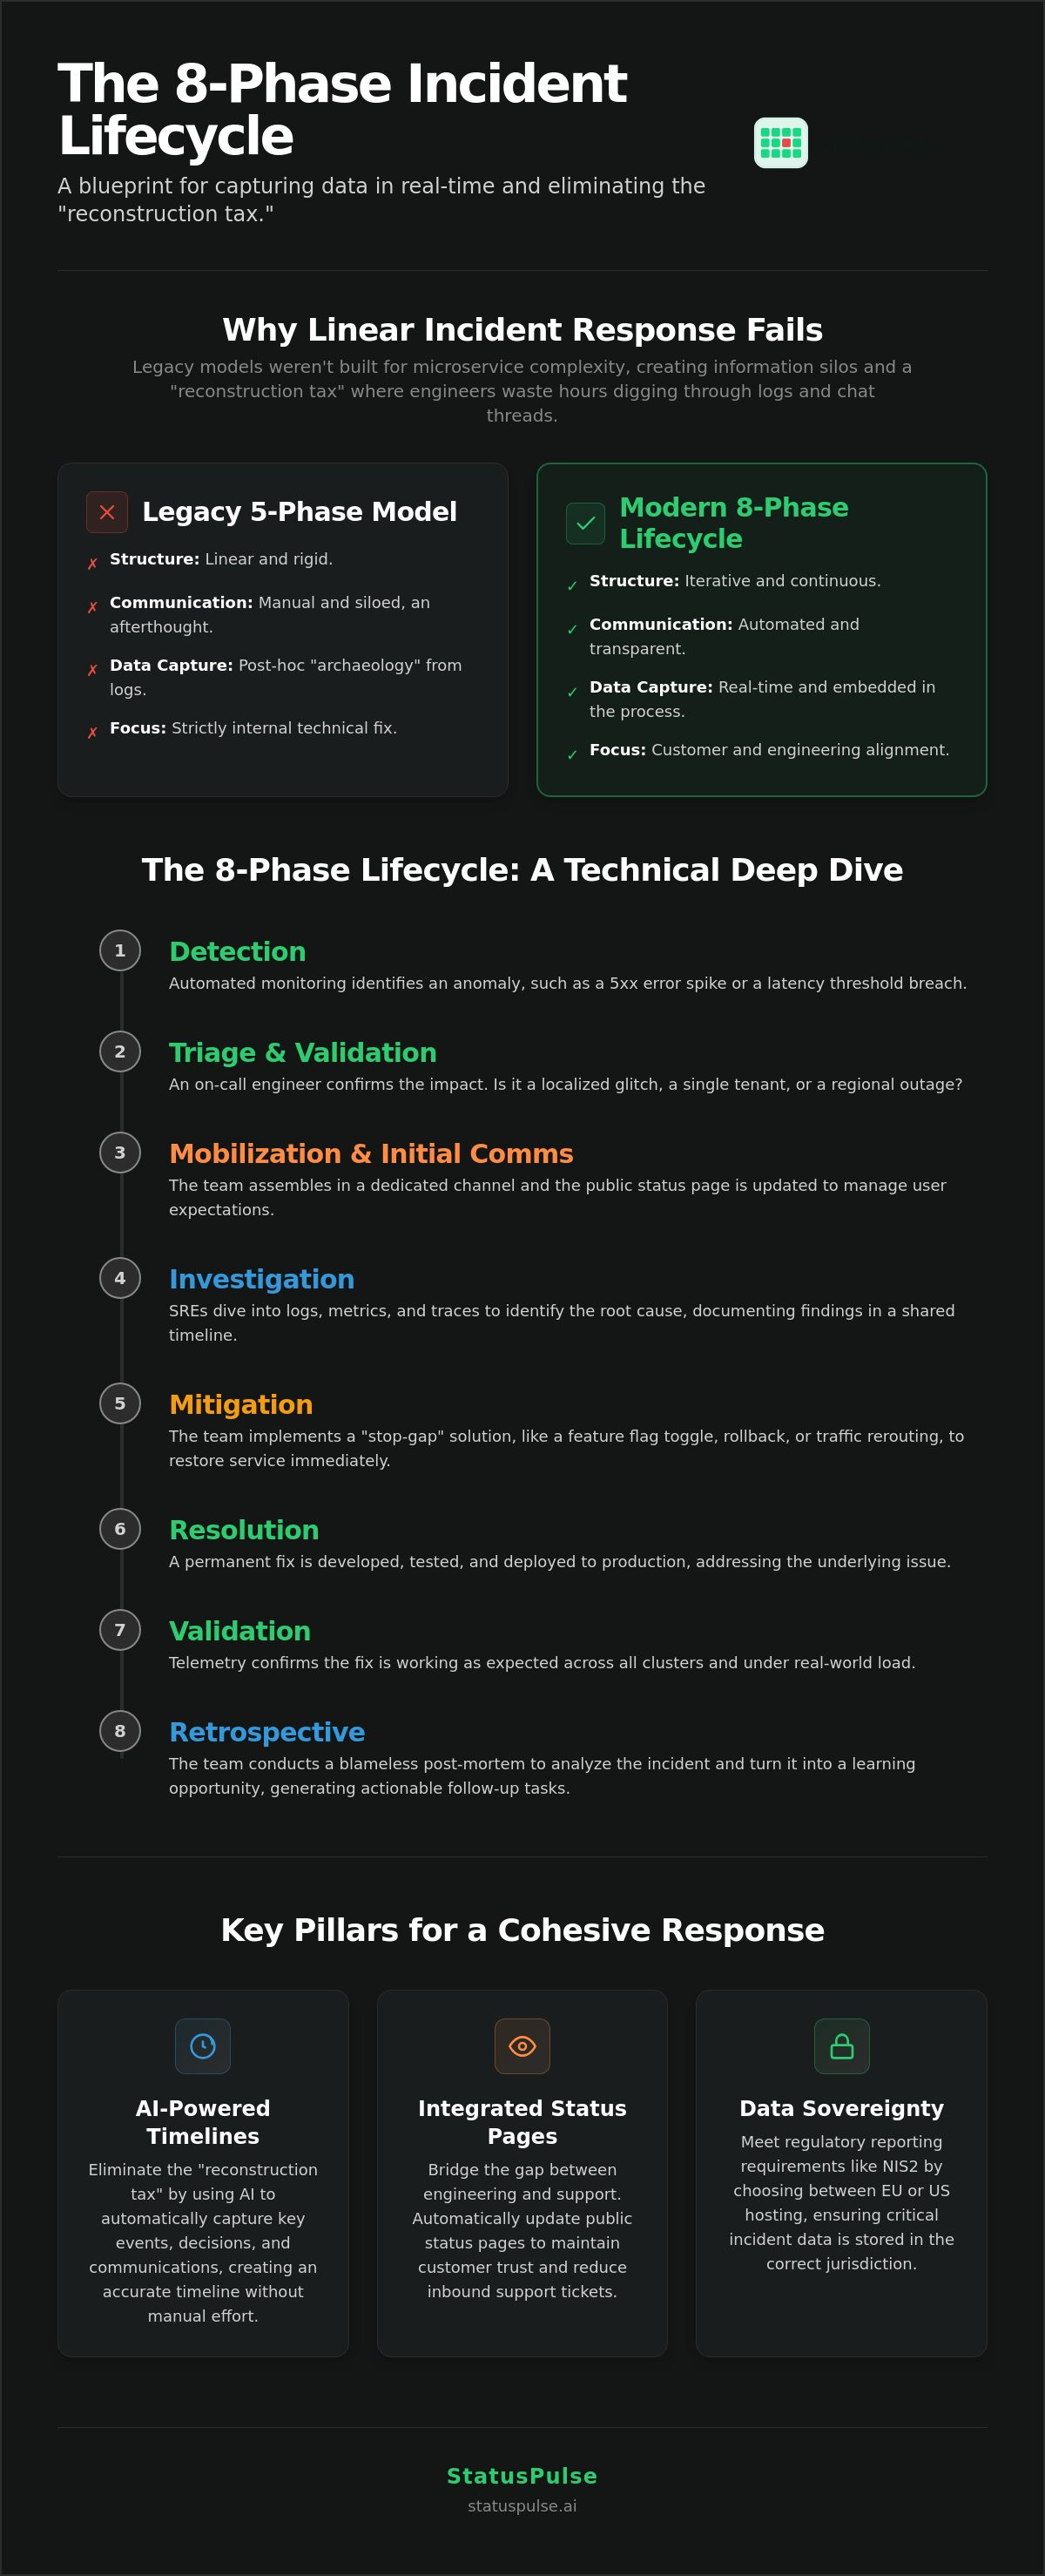
Traditional incident management often feels like a race where you're losing the baton at every lap. The standard incident response lifecycle, while foundational, wasn't built for the complexity of microservices or the speed of modern deployment cycles. When you're managing a high-velocity SaaS environment, a linear 5-phase model breaks down because it treats communication as an afterthought and documentation as a final chore. This leads to the "reconstruction tax," where engineers spend hours digging through Slack to understand why a specific decision was made mid-crisis.
The breakdown occurs because legacy models assume a clear start and end point. In reality, modern incidents are messy and iterative. To maintain reliability, you need a process that goes From Alert to Post-Mortem: An 8-Phase Incident Lifecycle That Doesn't Lose the Thread. This approach ensures that the context of a technical fix isn't lost before the report is even started.
| Feature | NIST 5-Phase Model (Legacy) | Modern 8-Phase Lifecycle |
|---|---|---|
| Structure | Linear and rigid. | Iterative and continuous. |
| Communication | Manual and siloed. | Automated and transparent. |
| Data Capture | Post-hoc archaeology. | Real-time and embedded. |
| Stakeholder Focus | Strictly internal. | Customer and engineering alignment. |
The Cost of Lost Context
During an active outage, decisions happen in seconds. You might tweak a load balancer setting or roll back a specific canary deployment. If these "silent" decisions aren't captured immediately, they disappear into the noise of the investigation. By the time you sit down for the post-mortem, the "why" behind the action is often gone. Fragmented tooling only makes this worse. When your monitoring, alerting, and communication tools don't talk to each other, your Mean Time to Detect (MTTD) climbs. Manual documentation becomes a reliability bottleneck because it forces engineers to choose between fixing the system and explaining what they're doing.
Communication as a Technical Requirement
Status updates aren't just a PR exercise for your customers. They're a vital coordination tool for your internal teams. When an SRE updates a status page, it tells the support team exactly what to say, reducing inbound ticket volume and preventing information silos. Transparency builds trust, but it also reduces the cognitive load on the engineers responding to the fire. The 'Communication Gap' is the technical debt accrued when system state changes aren't broadcasted to stakeholders in real-time. Bridging this gap requires an integrated system that captures the thread of truth from the very first alert.
The 8-Phase Incident Lifecycle: A Technical Deep Dive
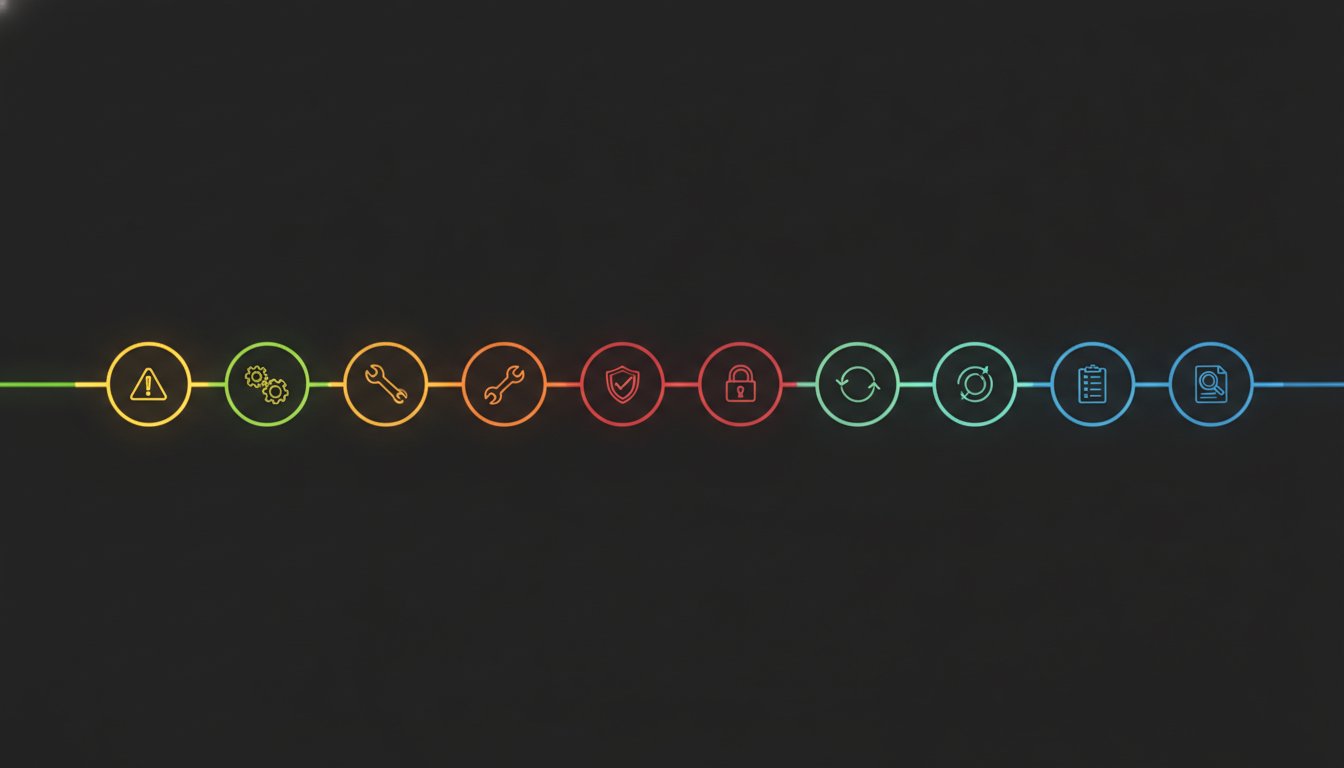
Most legacy frameworks stop at five stages, leaving a massive gap between the technical fix and the final report. This gap is where context dies and technical debt grows. To maintain a reliable system, you need a process that spans From Alert to Post-Mortem: An 8-Phase Incident Lifecycle That Doesn't Lose the Thread. Each phase serves a specific purpose in preserving the narrative of the incident.
- Phase 1: Detection – Automated monitoring identifies an anomaly, such as a 5xx spike or a latency threshold breach.
- Phase 2: Triage & Validation – An on-call engineer confirms the impact. Is it a localized glitch or a regional outage?
- Phase 3: Mobilization & Initial Comms – The team assembles in a dedicated channel and the public status page is updated to manage user expectations.
- Phase 4: Investigation – SREs dive into logs and traces to identify the root cause.
- Phase 5: Mitigation – The team implements a "stop-gap" solution, like a rollback or traffic rerouting, to restore service immediately.
- Phase 6: Resolution – A permanent fix is developed, tested, and deployed to production.
- Phase 7: Validation – Telemetry confirms the fix works across all clusters under real-world load.
- Phase 8: Retrospective – The team conducts a blameless post-mortem to turn the incident into a learning opportunity.
Industry leaders often highlight the role of automation in supporting ITOps to reduce manual toil during these high-pressure phases. By automating the transition between these stages, you ensure that no data point is dropped along the way.
Bridging Detection and Investigation
Phase 2 is the most critical for external trust. Triage must include a rapid impact assessment. If you don't know who is affected, you can't communicate honestly. For high-availability APIs, we recommend 1-minute uptime checks. Anything slower leaves you reactive rather than proactive. If you're looking for better detection strategies, check out our uptime monitoring guide. High-frequency monitoring ensures that Phase 1 triggers before your customers start reporting the issue.
Validation: The Often-Forgotten Phase 7
Many teams declare "victory" at Phase 6. This is a mistake. An incident isn't resolved until your telemetry proves it. Validation requires observing the fix under actual production load to ensure no regressions occurred. Only after successful validation should you close the communication loop on your status page. If you're tired of manual updates during these phases, consider using an AI incident management tool to help draft updates and capture the timeline automatically. This ensures the thread of truth remains intact until the final retrospective is complete.
Maintaining the Communication Thread via Public Status Pages
A status page acts as the persistent record of an event. It's the technical backbone of your external response. To follow the path From Alert to Post-Mortem: An 8-Phase Incident Lifecycle That Doesn't Lose the Thread, you must ensure your communication layer is tightly coupled with your monitoring layer. If these systems are siloed, you're forced to manually sync data, which is where context dies and errors happen.
The architecture of incident communication transparency relies on a single source of truth that bridges the gap between engineering and support. When an incident moves from Phase 2 (Triage) to Phase 3 (Mobilization), the status page should reflect that state immediately. This prevents your support team from being buried under a mountain of repetitive tickets while engineers focus on the fix. It's about moving from manual copy-pasting to a system where your monitoring state drives your public narrative.
Many corporate incumbents charge per subscriber, which feels like a penalty for growing your audience. During a viral outage, your subscriber list might spike rapidly. You shouldn't face a surprise bill for keeping your customers informed. Flat pricing models ensure your costs remain predictable even when your systems aren't. Additionally, for teams in regulated industries, where you host your status infrastructure is a legal requirement. Choosing between EU and US hosting allows you to maintain data sovereignty and comply with regional mandates like NIS2.
Automated Alerts vs. Manual Updates
Use website monitoring tools to drive transparency without increasing manual toil. Automated triggers can flip a status component to "degraded" the moment a health check fails. However, be cautious of alert fatigue. Flapping services shouldn't spam your public-facing pages. Set thresholds so that only verified, sustained anomalies trigger an update. This keeps your communication thread clean and relevant for your users.
Ethics of Uptime Reporting
Honesty is a technical requirement for modern SRE teams. Acknowledging partial outages rather than hiding behind a generic "99.9% uptime" claim builds long-term trust. Hiding downtime is a risk that eventually leads to customer churn. European privacy standards require that any subscriber data collected for status updates is handled under strict GDPR guidelines. Choosing a platform like StatusPulse that prioritizes these ethics over flashy marketing is the principled choice for specialists who value precision.
Leveraging AI for Timeline Capture and Incident Summarization
AI in incident management works best as a silent observer. It watches the 8-phase lifecycle unfold, capturing data that humans often overlook during high-pressure investigations. By the time you reach the final report, From Alert to Post-Mortem: An 8-Phase Incident Lifecycle That Doesn't Lose the Thread is already documented. It identifies the "thread" in fragmented logs and Slack discussions, turning chaotic telemetry into a structured narrative.
Automated timeline construction is the primary benefit. Instead of manual data entry, AI captures log snippets and architectural decisions as they happen. It drafts honest incident updates by summarizing complex root causes for your non-technical stakeholders. This ensures your communication remains truthful without requiring an engineer to step away from the fix. It shows the technical reality rather than claiming a vague resolution.
The Role of the Human-in-the-Loop
{
  "role": "SRE Assistant",
  "task": "Summarize Incident #402",
  "context": "Logs: [attached], Slack: #incident-402",
  "output_format": "Timeline + 2-sentence public update",
  "constraint": "Technical accuracy only. No superlatives."
}
Eliminating the Reconstruction Tax
Moving from Phase 4 (Investigation) directly to Phase 8 (Retrospective) usually involves a massive data gap. AI bridges this by identifying patterns across multiple historical incidents. It helps you see if a current deployment failure mirrors a similar event from six months ago. This proactive approach is proven to work. For example, teams are reducing support tickets by publishing AI-generated summaries that explain the impact clearly. By automating the capture of decisions, you eliminate the "reconstruction tax" and focus on system improvement. If you're ready to automate your incident narrative, explore our AI incident management tools.
Closing the Loop: Blameless Post-Mortems and Data Sovereignty
The final phase of the incident lifecycle is where most teams fail. They fix the bug, update the status page, and move back to the development roadmap. Without a structured retrospective, you're essentially paying for the same outage twice. Implementing a process From Alert to Post-Mortem: An 8-Phase Incident Lifecycle That Doesn't Lose the Thread ensures that the data you captured during the heat of the moment is used to prevent the next fire. It turns a stressful event into a technical asset.
Closing the loop also means moving action items from the retrospective into your active workflow. Action items shouldn't die in a static document. By automatically turning post-mortem tasks into Jira or GitHub tickets, you ensure that systemic improvements are prioritized alongside new features. This keeps the technical thread alive until the vulnerability is actually patched. It's the only way to drive down your long-term MTTR.
Blameless Retrospectives in Practice
A blameless culture isn't about ignoring mistakes. It's about recognizing that human error is a symptom of a systemic vulnerability. Use the "5 Whys" framework to dig past the immediate action. If a configuration error caused a regional outage, don't stop at "the engineer made a typo." Ask why the CI/CD pipeline didn't catch it. Ask why the staging environment didn't mirror production. This technical depth is what separates a mature SRE team from a reactive one. A standard post-mortem should include:
- Incident Summary: A high-level overview for stakeholders.
- Impact Analysis: Specific numbers on affected users or services.
- Timeline: A verified sequence of events from detection to resolution.
- Root Cause: The underlying systemic failure.
- Action Items: Concrete steps to prevent recurrence.
Sovereignty and Compliance
Incident reports often contain sensitive metadata about your internal architecture and security posture. In regulated markets, storing this data in the EU isn't just a preference; it's a compliance requirement. US-centric corporate tools often default to North American regions, which can complicate GDPR or NIS2 audits. Choosing a platform that offers a choice between EU and US hosting allows you to satisfy local regulators while maintaining a global response capability. It's about ethical data management and respecting regional sovereignty.
Before you call the incident truly finished, run through this final checklist. Has the thread been closed?
- Is the public status page updated with a final, honest summary?
- Have all "stop-gap" mitigations been replaced by permanent fixes?
- Are the post-mortem action items tracked in your primary task manager?
- Has the incident data been stored in your preferred geographic region?
If you're ready to build a more transparent and resilient response process, you can start your journey toward transparent incident management with StatusPulse. We provide the tools to maintain the thread of truth from the first alert to the final report.
Building a Resilient Incident Culture
Adopting a structured response isn't about adding bureaucracy. It's about ensuring your engineering team can focus on technical resolution while the system handles the narrative. By moving From Alert to Post-Mortem: An 8-Phase Incident Lifecycle That Doesn't Lose the Thread, you eliminate the reconstruction tax and build a persistent record of truth. This approach bridges the gap between the first alert and the final retrospective. It ensures that no critical context is lost in fragmented Slack threads or log files.
Maintaining this level of operational excellence requires a stable network environment; for organizations seeking 30 years of expertise in IT administration and technology consulting, you can learn more about Uptime Co..
Real-time data capture and transparent communication are the foundations of customer trust. You can build a transparent incident lifecycle with StatusPulse. Our platform offers AI-powered incident summarization to draft updates and EU-based hosting for strict data sovereignty. We use a flat pricing model with no per-subscriber fees, so your costs remain predictable even during viral outages. Start treating your incidents as opportunities for systemic improvement rather than just fires to be extinguished. You have the tools to make your next response your most professional one yet.
Frequently Asked Questions
What is the difference between an incident response lifecycle and a post-mortem?
An incident response lifecycle encompasses the entire journey from initial detection to final resolution. A post-mortem is specifically the retrospective phase where the team analyzes the event to prevent recurrence. Following a process From Alert to Post-Mortem: An 8-Phase Incident Lifecycle That Doesn't Lose the Thread ensures that the data needed for the post-mortem is collected throughout the response, rather than being reconstructed from memory at the end.
How do I choose between EU and US hosting for my status page?
Base your choice on your organization's data sovereignty requirements and the geographic location of your primary user base. Teams operating in Europe often choose EU hosting to satisfy strict GDPR and NIS2 compliance mandates regarding the storage of subscriber data and incident metadata. StatusPulse provides both options to ensure you can meet regional regulatory standards without sacrificing performance or technical reliability for your global stakeholders.
Is an 8-phase lifecycle too complex for a small startup team?
No, it provides a necessary structure that actually reduces cognitive load during a crisis. For a small team, these phases might move quickly, but having a defined path prevents critical steps like validation or internal communication from being skipped. Even a two person team benefits from a repeatable framework that ensures technical fixes are verified and customer trust is maintained through consistent, honest updates on a public status page.
How can AI help with incident management without losing technical accuracy?
AI functions as a technical assistant that observes the lifecycle to automate timeline construction and draft incident summaries. To maintain accuracy, you should always keep a human in the loop to review and approve any AI generated content before it goes public. This approach leverages the speed of machine learning for data collection while ensuring that the final narrative remains grounded in verified technical reality and engineering judgment.
Why is blameless culture important in the incident lifecycle?
Blameless culture shifts the focus from individual human error to systemic vulnerabilities that allowed the error to occur. If engineers fear punishment, they are less likely to be transparent about their actions during the investigation phase. A blameless approach encourages the honest data sharing required to complete a process From Alert to Post-Mortem: An 8-Phase Incident Lifecycle That Doesn't Lose the Thread, ultimately leading to more resilient systems.
What metrics should I track across the 8 phases of an incident?
Focus on Mean Time to Detect (MTTD) and Mean Time to Resolve (MTTR), but also track the duration of individual phases. Measuring the time between Mitigation (Phase 5) and Validation (Phase 7) can reveal bottlenecks in your testing or deployment pipelines. Tracking these granular metrics helps identify whether your delays are technical in nature or caused by communication gaps between your engineering and customer facing teams.
Does StatusPulse charge per status page subscriber?
No, we utilize a flat pricing model that does not penalize you for growing your audience. Many corporate incumbents charge per subscriber, which can lead to unpredictable costs during viral outages or major service disruptions. We believe in transparent, ethical pricing that allows you to communicate with all your users without worrying about your billing tier, ensuring that your focus remains entirely on technical resolution and customer trust.
Can I automate status page updates from my existing monitoring tools?
Yes, you can use automated monitoring triggers to drive status page changes based on specific health check failures. For instance, an API monitoring failure can automatically flip a status component to "degraded" to provide immediate transparency. While automation improves speed, we recommend setting thresholds to avoid flapping services and ensuring that a human provides a brief, honest summary of the impact to maintain a high standard of communication.


